

genomewide characterization of host-pathogen interactions by ...
genomewide characterization of host-pathogen interactions by ...
genomewide characterization of host-pathogen interactions by ...

You also want an ePaper? Increase the reach of your titles
YUMPU automatically turns print PDFs into web optimized ePapers that Google loves.
Maren Depke<br />
Results<br />
Kidney Gene Expression Pattern in an in vivo Infection Model<br />
and inflammation related categories (e. g. Inflammatory / Immunological / Infectious Disease,<br />
Antigen Presentation) and categories showing the impact <strong>of</strong> infection on the tissue (e. g. Cellular<br />
Compromise, Cell Death) were significantly affected.<br />
More detailed analysis <strong>of</strong> the tissue reaction is <strong>of</strong>fered <strong>by</strong> the so-called Canonical Pathway<br />
analysis in IPA. This tool contains predefined pathways and the associated genes, displayed in<br />
order <strong>of</strong> cellular location and function, which can be overlaid with gene expression data, e. g. fold<br />
change values. A p-value for enrichment <strong>of</strong> pathway members in the data set <strong>of</strong> interest<br />
(compared to a reference set, e. g. the whole array) is calculated. Many pathways scored with a<br />
highly significant p-value because <strong>of</strong> the large input data set. Additionally, a ratio <strong>of</strong> the<br />
pathway’s genes included in the data set and the total number <strong>of</strong> genes in the pathway is given.<br />
When data <strong>of</strong> such a Canonical Pathway analysis were ordered <strong>by</strong> p-value, “Acute Phase<br />
Response Signaling” with p = 5.00E−21 and a ratio <strong>of</strong> 53/178 <strong>of</strong> genes from the data set included<br />
in the pathway was the most significantly influenced reaction. This pathway includes signaling<br />
chains starting with TNF-α, IL-1 and IL-6, their signal transduction molecules and transcription<br />
factors and finally the genes whose transcription is induced or repressed. While the acute phase<br />
response is located in hepatic tissue the pathway has a high overlap with a localized<br />
infection/inflammation reaction and therefore is covered <strong>by</strong> the kidney infection vs. sham<br />
infection data set to this high extent.<br />
Directly infection related genes are included in the canonical pathways “Role <strong>of</strong> Pattern<br />
Recognition Receptors in Recognition <strong>of</strong> Bacteria and Viruses” (p = 1.16E−13; ratio = 27/80,<br />
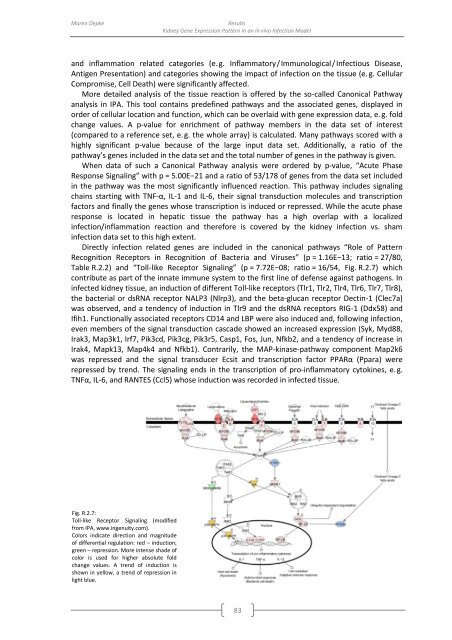
Table R.2.2) and “Toll-like Receptor Signaling” (p = 7.72E−08; ratio = 16/54, Fig. R.2.7) which<br />
contribute as part <strong>of</strong> the innate immune system to the first line <strong>of</strong> defense against <strong>pathogen</strong>s. In<br />
infected kidney tissue, an induction <strong>of</strong> different Toll-like receptors (Tlr1, Tlr2, Tlr4, Tlr6, Tlr7, Tlr8),<br />
the bacterial or dsRNA receptor NALP3 (Nlrp3), and the beta-glucan receptor Dectin-1 (Clec7a)<br />
was observed, and a tendency <strong>of</strong> induction in Tlr9 and the dsRNA receptors RIG-1 (Ddx58) and<br />
Ifih1. Functionally associated receptors CD14 and LBP were also induced and, following infection,<br />
even members <strong>of</strong> the signal transduction cascade showed an increased expression (Syk, Myd88,<br />
Irak3, Map3k1, Irf7, Pik3cd, Pik3cg, Pik3r5, Casp1, Fos, Jun, Nfkb2, and a tendency <strong>of</strong> increase in<br />
Irak4, Mapk13, Map4k4 and Nfkb1). Contrarily, the MAP-kinase-pathway component Map2k6<br />
was repressed and the signal transducer Ecsit and transcription factor PPARα (Ppara) were<br />
repressed <strong>by</strong> trend. The signaling ends in the transcription <strong>of</strong> pro-inflammatory cytokines, e. g.<br />
TNFα, IL-6, and RANTES (Ccl5) whose induction was recorded in infected tissue.<br />
Fig. R.2.7:<br />
Toll-like Receptor Signaling (modified<br />
from IPA, www.ingenuity.com).<br />
Colors indicate direction and magnitude<br />
<strong>of</strong> differential regulation: red – induction;<br />
green – repression. More intense shade <strong>of</strong><br />
color is used for higher absolute fold<br />
change values. A trend <strong>of</strong> induction is<br />
shown in yellow, a trend <strong>of</strong> repression in<br />
light blue.<br />
83


