

genomewide characterization of host-pathogen interactions by ...
genomewide characterization of host-pathogen interactions by ...
genomewide characterization of host-pathogen interactions by ...

Create successful ePaper yourself
Turn your PDF publications into a flip-book with our unique Google optimized e-Paper software.
mean normalized intensity<br />
mean normalized intensity<br />
mean normalized intensity<br />
mean normalized intensity<br />
mean normalized intensity<br />
mean normalized intensity<br />
Maren Depke<br />
Results<br />
Pathogen Gene Expression Pr<strong>of</strong>iling<br />
A<br />
B<br />
45 37 34<br />
98 75 43<br />
C<br />
internalization-specific<br />
differential expression;<br />
induction 2.5 h after<br />
start <strong>of</strong> infection<br />
internalization-specific<br />
differential expression;<br />
induction 6.5 h after<br />
start <strong>of</strong> infection<br />
F<br />
internalization-specific<br />
differential expression;<br />
repression 2.5 h after<br />
start <strong>of</strong> infection<br />
internalization-specific<br />
differential expression;<br />
repression 6.5 h after<br />
start <strong>of</strong> infection<br />
10E+02<br />
10E+02<br />
10E+01 10.00<br />
10E+01 10.00<br />
10E+00 1.00<br />
10E+00 1.00<br />
10E-01 0.10<br />
10E-01 0.10<br />
D<br />
10E-02 0.01<br />
1 2 3 4 5 6 7<br />
exp.<br />
1 h<br />
co.<br />
2.5 h<br />
int.<br />
6.5 h<br />
int.<br />
2.5 h<br />
co.<br />
6.5 h<br />
co.<br />
2.5 h<br />
anae.<br />
S. aureus RN1HG sample conditions and time points<br />
G<br />
10E-02 0.01<br />
1 2 3 4 5 6 7<br />
exp.<br />
1 h<br />
co.<br />
2.5 h<br />
int.<br />
6.5 h<br />
int.<br />
2.5 h<br />
co.<br />
6.5 h<br />
co.<br />
2.5 h<br />
anae.<br />
S. aureus RN1HG sample conditions and time points<br />
10E+02<br />
10E+02<br />
10E+01 10.00<br />
10E+01 10.00<br />
10E+00 1.00<br />
10E+00 1.00<br />
10E-01 0.10<br />
10E-01 0.10<br />
E<br />
10E-02 0.01<br />
10E-02 0.01<br />
10E+02<br />
1 2 3 4 5 6 7<br />
exp.<br />
1 h<br />
co.<br />
2.5 h<br />
int.<br />
6.5 h<br />
int.<br />
2.5 h<br />
co.<br />
6.5 h<br />
co.<br />
2.5 h<br />
anae.<br />
S. aureus RN1HG sample conditions and time points<br />
H<br />
10E+02<br />
1 2 3 4 5 6 7<br />
exp.<br />
1 h<br />
co.<br />
2.5 h<br />
int.<br />
6.5 h<br />
int.<br />
2.5 h<br />
co.<br />
6.5 h<br />
co.<br />
2.5 h<br />
anae.<br />
S. aureus RN1HG sample conditions and time points<br />
10E+01 10.00<br />
10E+01 10.00<br />
10E+00 1.00<br />
10E+00 1.00<br />
10E-01 0.10<br />
10E-01 0.10<br />
10E-02 0.01<br />
10E-02 0.01<br />
1 2 3 4 5 6 7<br />
exp.<br />
1 h<br />
co.<br />
2.5 h<br />
int.<br />
6.5 h<br />
int.<br />
2.5 h<br />
co.<br />
6.5 h<br />
co.<br />
2.5 h<br />
anae.<br />
S. aureus RN1HG sample conditions and time points<br />
1 2 3 4 5 6 7<br />
exp.<br />
1 h<br />
co.<br />
2.5 h<br />
int.<br />
6.5 h<br />
int.<br />
2.5 h<br />
co.<br />
6.5 h<br />
co.<br />
2.5 h<br />
anae.<br />
S. aureus RN1HG sample conditions and time points<br />
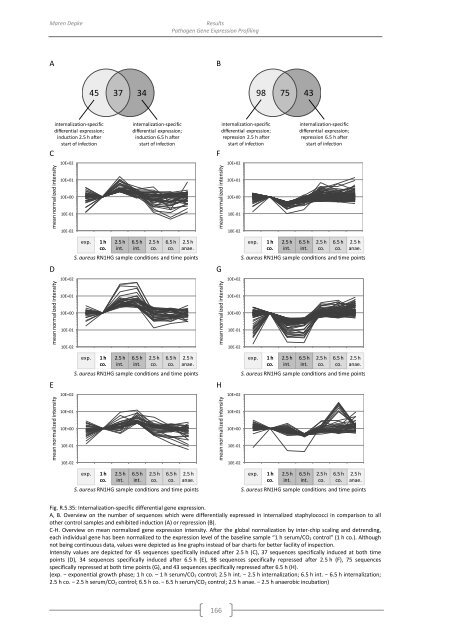
Fig. R.5.35: Internalization-specific differential gene expression.<br />
A, B. Overview on the number <strong>of</strong> sequences which were differentially expressed in internalized staphylococci in comparison to all<br />
other control samples and exhibited induction (A) or repression (B).<br />
C-H. Overview on mean normalized gene expression intensity. After the global normalization <strong>by</strong> inter-chip scaling and detrending,<br />
each individual gene has been normalized to the expression level <strong>of</strong> the baseline sample “1 h serum/CO 2 control” (1 h co.). Although<br />
not being continuous data, values were depicted as line graphs instead <strong>of</strong> bar charts for better facility <strong>of</strong> inspection.<br />
Intensity values are depicted for 45 sequences specifically induced after 2.5 h (C), 37 sequences specifically induced at both time<br />
points (D), 34 sequences specifically induced after 6.5 h (E), 98 sequences specifically repressed after 2.5 h (F), 75 sequences<br />
specifically repressed at both time points (G), and 43 sequences specifically repressed after 6.5 h (H).<br />
(exp. − exponential growth phase; 1 h co. – 1 h serum/CO 2 control; 2.5 h int. − 2.5 h internalization; 6.5 h int. − 6.5 h internalization;<br />
2.5 h co. − 2.5 h serum/CO 2 control; 6.5 h co. − 6.5 h serum/CO 2 control; 2.5 h anae. − 2.5 h anaerobic incubation)<br />
166


