

genomewide characterization of host-pathogen interactions by ...
genomewide characterization of host-pathogen interactions by ...
genomewide characterization of host-pathogen interactions by ...

You also want an ePaper? Increase the reach of your titles
YUMPU automatically turns print PDFs into web optimized ePapers that Google loves.
mean normalized intensity<br />
Maren Depke<br />
Results<br />
Pathogen Gene Expression Pr<strong>of</strong>iling<br />
Additionally, a high number <strong>of</strong> peptide/oligopeptide transporters were induced: peptide<br />
transporters oppF and SAOUHSC_00169, oligopeptide transporters SAOUHSC_00926 and oppA,<br />
and genes SAOUHSC_00923, oppC (SAOUHSC_00924), and oppD (SAOUHSC_00925) from the<br />
same operon (SAOUHSC_00923 to SAOUHSC_00927). Also induced SAOUHSC_00928 gene codes<br />
for an oligopeptide ABC transporter. In the same chromosomal region, a four-gene-operon<br />
(SAOUHSC_00929 to SAOUHSC_00932) encodes oligopeptide ABC transporters appD, appF,<br />
SAOUHSC_00931, and appC, but these were not induced in internalized staphylococci<br />
(Fig. R.5.33).<br />
Further example for induced transporter gene expression was another operon including msmX<br />
(SAOUHSC_00175, multiple sugar-binding transport ATP-binding protein), SAOUHSC_00176<br />
(bacterial extracellular solute-binding protein), SAOUHSC_00177 and SAOUHSC_00178 (both<br />
maltose ABC transporter, permease proteins). Also opuD2 (osmoprotectant transporter), glnQ<br />
(amino acid ABC transporter), SAOUHSC_02729 (amino acid ABC transporter-like protein), and<br />
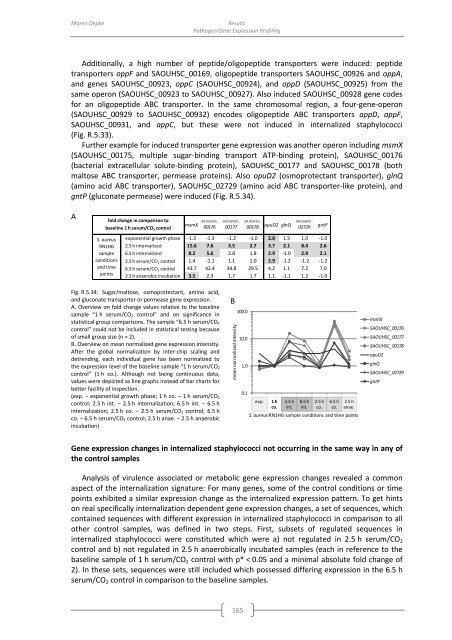
gntP (gluconate permease) were induced (Fig. R.5.34).<br />
A<br />
fold change in comparison to<br />
baseline 1 h serum/CO 2 control<br />
S. aureus<br />
RN1HG<br />
sample<br />
conditions<br />
and time<br />
points<br />
msmX SAOUHSC_<br />
00176<br />
SAOUHSC_<br />
00177<br />
SAOUHSC_<br />
00178<br />
opuD2 glnQ<br />
SAOUHSC_<br />
02729<br />
exponential growth phase -1.3 -1.3 -1.2 -1.0 2.8 1.5 1.0 -1.0<br />
2.5 h internalized 15.6 7.6 3.5 2.7 3.7 2.1 8.4 2.6<br />
6.5 h internalized 8.2 5.6 2.8 1.8 2.9 -1.0 2.9 2.1<br />
2.5 h serum/CO 2 control 1.4 -1.1 1.1 1.0 2.9 -1.2 -1.2 -1.2<br />
6.5 h serum/CO 2 control 43.7 42.4 34.8 29.5 4.2 1.1 7.2 7.0<br />
2.5 h anaerobic incubation 3.5 2.3 1.7 1.7 1.1 -1.1 1.2 -1.0<br />
gntP<br />
Fig. R.5.34: Sugar/maltose, osmoprotectant, amino acid,<br />
and gluconate transporter or permease gene expression.<br />
A. Overview on fold change values relative to the baseline<br />
sample “1 h serum/CO 2 control” and on significance in<br />
statistical group comparisons. The sample “6.5 h serum/CO 2<br />
control” could not be included in statistical testing because<br />
<strong>of</strong> small group size (n = 2).<br />
B. Overview on mean normalized gene expression intensity.<br />
After the global normalization <strong>by</strong> inter-chip scaling and<br />
detrending, each individual gene has been normalized to<br />
the expression level <strong>of</strong> the baseline sample “1 h serum/CO 2<br />
control” (1 h co.). Although not being continuous data,<br />
values were depicted as line graphs instead <strong>of</strong> bar charts for<br />
better facility <strong>of</strong> inspection.<br />
(exp. − exponential growth phase; 1 h co. – 1 h serum/CO 2<br />
control; 2.5 h int. − 2.5 h internalization; 6.5 h int. − 6.5 h<br />
internalization; 2.5 h co. − 2.5 h serum/CO 2 control; 6.5 h<br />
co. − 6.5 h serum/CO 2 control; 2.5 h anae. − 2.5 h anaerobic<br />
incubation)<br />
B<br />
100.0<br />
10.0<br />
1.0<br />
0.1<br />
exp.<br />
1 h<br />
co.<br />
2.5 h<br />
int.<br />
6.5 h<br />
int.<br />
2.5 h<br />
co.<br />
6.5 h<br />
co.<br />
2.5 h<br />
anae.<br />
S. aureus RN1HG sample conditions and time points<br />
msmX<br />
SAOUHSC_00176<br />
SAOUHSC_00177<br />
SAOUHSC_00178<br />
opuD2<br />
glnQ<br />
SAOUHSC_02729<br />
gntP<br />
Gene expression changes in internalized staphylococci not occurring in the same way in any <strong>of</strong><br />
the control samples<br />
Analysis <strong>of</strong> virulence associated or metabolic gene expression changes revealed a common<br />
aspect <strong>of</strong> the internalization signature: For many genes, some <strong>of</strong> the control conditions or time<br />
points exhibited a similar expression change as the internalized expression pattern. To get hints<br />
on real specifically internalization dependent gene expression changes, a set <strong>of</strong> sequences, which<br />
contained sequences with different expression in internalized staphylococci in comparison to all<br />
other control samples, was defined in two steps. First, subsets <strong>of</strong> regulated sequences in<br />
internalized staphylococci were constituted which were a) not regulated in 2.5 h serum/CO 2<br />
control and b) not regulated in 2.5 h anaerobically incubated samples (each in reference to the<br />
baseline sample <strong>of</strong> 1 h serum/CO 2 control with p* < 0.05 and a minimal absolute fold change <strong>of</strong><br />
2). In these sets, sequences were still included which possessed differing expression in the 6.5 h<br />
serum/CO 2 control in comparison to the baseline samples.<br />
165


