

genomewide characterization of host-pathogen interactions by ...
genomewide characterization of host-pathogen interactions by ...
genomewide characterization of host-pathogen interactions by ...

Create successful ePaper yourself
Turn your PDF publications into a flip-book with our unique Google optimized e-Paper software.
mean normalized intensity<br />
mean normalized intensity<br />
Maren Depke<br />
Results<br />
Pathogen Gene Expression Pr<strong>of</strong>iling<br />
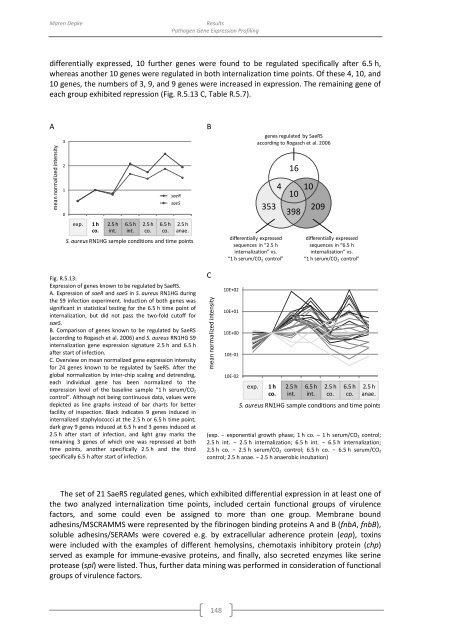
differentially expressed, 10 further genes were found to be regulated specifically after 6.5 h,<br />
whereas another 10 genes were regulated in both internalization time points. Of these 4, 10, and<br />
10 genes, the numbers <strong>of</strong> 3, 9, and 9 genes were increased in expression. The remaining gene <strong>of</strong><br />
each group exhibited repression (Fig. R.5.13 C, Table R.5.7).<br />
A<br />
33<br />
B<br />
genes regulated <strong>by</strong> SaeRS<br />
according to Rogasch et al. 2006<br />
22<br />
16<br />
11<br />
saeR<br />
saeS<br />
00<br />
OD 0.4 CO2 (serum) internalized internalized CO2 (serum) CO2 (serum) anaerobic<br />
exp.<br />
1 h<br />
co.<br />
2.5 h<br />
int.<br />
6.5 h<br />
int.<br />
2.5 h<br />
co.<br />
6.5 h<br />
co.<br />
2.5 h<br />
anae.<br />
0 h 1 h 2.5 h 6.5 h 2.5 h 6.5 h 2.5 h<br />
S. aureus RN1HG sample conditions and time points<br />
differentially expressed<br />
sequences in “2.5 h<br />
internalization” vs.<br />
“1 h serum/CO 2 control”<br />
4 10<br />
10<br />
353 209<br />
398<br />
differentially expressed<br />
sequences in “6.5 h<br />
internalization” vs.<br />
“1 h serum/CO 2 control”<br />
Fig. R.5.13:<br />
Expression <strong>of</strong> genes known to be regulated <strong>by</strong> SaeRS.<br />
A. Expression <strong>of</strong> saeR and saeS in S. aureus RN1HG during<br />
the S9 infection experiment. Induction <strong>of</strong> both genes was<br />
significant in statistical testing for the 6.5 h time point <strong>of</strong><br />
internalization, but did not pass the two-fold cut<strong>of</strong>f for<br />
saeS.<br />
B. Comparison <strong>of</strong> genes known to be regulated <strong>by</strong> SaeRS<br />
(according to Rogasch et al. 2006) and S. aureus RN1HG S9<br />
internalization gene expression signature 2.5 h and 6.5 h<br />
after start <strong>of</strong> infection.<br />
C. Overview on mean normalized gene expression intensity<br />
for 24 genes known to be regulated <strong>by</strong> SaeRS. After the<br />
global normalization <strong>by</strong> inter-chip scaling and detrending,<br />
each individual gene has been normalized to the<br />
expression level <strong>of</strong> the baseline sample “1 h serum/CO 2<br />
control”. Although not being continuous data, values were<br />
depicted as line graphs instead <strong>of</strong> bar charts for better<br />
facility <strong>of</strong> inspection. Black indicates 9 genes induced in<br />
internalized staphylococci at the 2.5 h or 6.5 h time point,<br />
dark gray 9 genes induced at 6.5 h and 3 genes induced at<br />
2.5 h after start <strong>of</strong> infection, and light gray marks the<br />
remaining 3 genes <strong>of</strong> which one was repressed at both<br />
time points, another specifically 2.5 h and the third<br />
specifically 6.5 h after start <strong>of</strong> infection.<br />
C<br />
10E+02 100.000<br />
10E+01 10.000<br />
10E+00 1.000<br />
10E-01 0.100<br />
10E-02 0.010<br />
OD 0.4 CO2 (serum) internalized internalized CO2 (serum) CO2 (serum) anaerobic<br />
exp.<br />
1 h<br />
co.<br />
2.5 h<br />
int.<br />
6.5 h<br />
int.<br />
2.5 h<br />
co.<br />
6.5 h<br />
co.<br />
2.5 h<br />
anae.<br />
0 h 1 h 2.5 h 6.5 h 2.5 h 6.5 h 2.5 h<br />
S. aureus RN1HG sample conditions and time points<br />
(exp. − exponential growth phase; 1 h co. – 1 h serum/CO 2 control;<br />
2.5 h int. − 2.5 h internalization; 6.5 h int. − 6.5 h internalization;<br />
2.5 h co. − 2.5 h serum/CO 2 control; 6.5 h co. − 6.5 h serum/CO 2<br />
control; 2.5 h anae. − 2.5 h anaerobic incubation)<br />
The set <strong>of</strong> 21 SaeRS regulated genes, which exhibited differential expression in at least one <strong>of</strong><br />
the two analyzed internalization time points, included certain functional groups <strong>of</strong> virulence<br />
factors, and some could even be assigned to more than one group. Membrane bound<br />
adhesins/MSCRAMMS were represented <strong>by</strong> the fibrinogen binding proteins A and B (fnbA, fnbB),<br />
soluble adhesins/SERAMs were covered e. g. <strong>by</strong> extracellular adherence protein (eap), toxins<br />
were included with the examples <strong>of</strong> different hemolysins, chemotaxis inhibitory protein (chp)<br />
served as example for immune-evasive proteins, and finally, also secreted enzymes like serine<br />
protease (spl) were listed. Thus, further data mining was performed in consideration <strong>of</strong> functional<br />
groups <strong>of</strong> virulence factors.<br />
148


