

genomewide characterization of host-pathogen interactions by ...
genomewide characterization of host-pathogen interactions by ...
genomewide characterization of host-pathogen interactions by ...

You also want an ePaper? Increase the reach of your titles
YUMPU automatically turns print PDFs into web optimized ePapers that Google loves.
Maren Depke<br />
Results<br />
Pathogen Gene Expression Pr<strong>of</strong>iling<br />
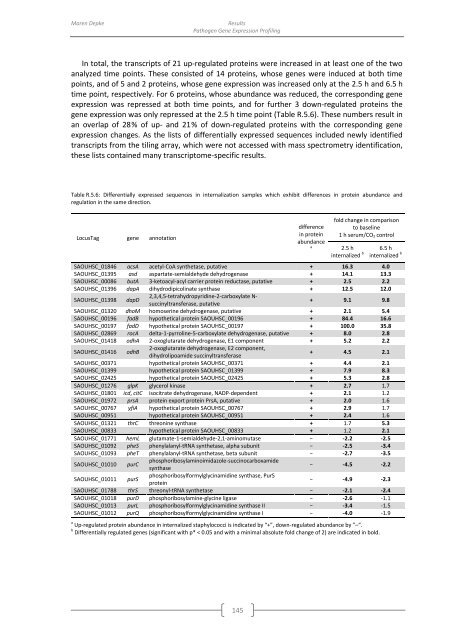
In total, the transcripts <strong>of</strong> 21 up-regulated proteins were increased in at least one <strong>of</strong> the two<br />
analyzed time points. These consisted <strong>of</strong> 14 proteins, whose genes were induced at both time<br />
points, and <strong>of</strong> 5 and 2 proteins, whose gene expression was increased only at the 2.5 h and 6.5 h<br />
time point, respectively. For 6 proteins, whose abundance was reduced, the corresponding gene<br />
expression was repressed at both time points, and for further 3 down-regulated proteins the<br />
gene expression was only repressed at the 2.5 h time point (Table R.5.6). These numbers result in<br />
an overlap <strong>of</strong> 28 % <strong>of</strong> up- and 21 % <strong>of</strong> down-regulated proteins with the corresponding gene<br />
expression changes. As the lists <strong>of</strong> differentially expressed sequences included newly identified<br />
transcripts from the tiling array, which were not accessed with mass spectrometry identification,<br />
these lists contained many transcriptome-specific results.<br />
Table R.5.6: Differentially expressed sequences in internalization samples which exhibit differences in protein abundance and<br />
regulation in the same direction.<br />
LocusTag gene annotation<br />
difference<br />
in protein<br />
abundance<br />
a<br />
fold change in comparison<br />
to baseline<br />
1 h serum/CO 2 control<br />
2.5 h<br />
internalized b<br />
6.5 h<br />
internalized b<br />
SAOUHSC_01846 acsA acetyl-CoA synthetase, putative + 16.3 4.0<br />
SAOUHSC_01395 asd aspartate-semialdehyde dehydrogenase + 14.1 13.3<br />
SAOUHSC_00086 butA 3-ketoacyl-acyl carrier protein reductase, putative + 2.5 2.2<br />
SAOUHSC_01396 dapA dihydrodipicolinate synthase + 12.5 12.0<br />
SAOUHSC_01398 dapD<br />
2,3,4,5-tetrahydropyridine-2-carboxylate N-<br />
succinyltransferase, putative<br />
+ 9.1 9.8<br />
SAOUHSC_01320 dhoM homoserine dehydrogenase, putative + 2.1 5.4<br />
SAOUHSC_00196 fadB hypothetical protein SAOUHSC_00196 + 84.4 16.6<br />
SAOUHSC_00197 fadD hypothetical protein SAOUHSC_00197 + 100.0 35.8<br />
SAOUHSC_02869 rocA delta-1-pyrroline-5-carboxylate dehydrogenase, putative + 8.0 2.8<br />
SAOUHSC_01418 odhA 2-oxoglutarate dehydrogenase, E1 component + 5.2 2.2<br />
SAOUHSC_01416 odhB<br />
2-oxoglutarate dehydrogenase, E2 component,<br />
dihydrolipoamide succinyltransferase<br />
+ 4.5 2.1<br />
SAOUHSC_00371 hypothetical protein SAOUHSC_00371 + 4.4 2.1<br />
SAOUHSC_01399 hypothetical protein SAOUHSC_01399 + 7.9 8.3<br />
SAOUHSC_02425 hypothetical protein SAOUHSC_02425 + 5.3 2.8<br />
SAOUHSC_01276 glpK glycerol kinase + 2.7 1.7<br />
SAOUHSC_01801 icd, citC isocitrate dehydrogenase, NADP-dependent + 2.1 1.2<br />
SAOUHSC_01972 prsA protein export protein PrsA, putative + 2.0 1.6<br />
SAOUHSC_00767 yfiA hypothetical protein SAOUHSC_00767 + 2.9 1.7<br />
SAOUHSC_00951 hypothetical protein SAOUHSC_00951 + 2.4 1.6<br />
SAOUHSC_01321 thrC threonine synthase + 1.7 5.3<br />
SAOUHSC_00833 hypothetical protein SAOUHSC_00833 + 1.2 2.1<br />
SAOUHSC_01771 hemL glutamate-1-semialdehyde-2,1-aminomutase − -2.2 -2.5<br />
SAOUHSC_01092 pheS phenylalanyl-tRNA synthetase, alpha subunit − -2.5 -3.4<br />
SAOUHSC_01093 pheT phenylalanyl-tRNA synthetase, beta subunit − -2.7 -3.5<br />
SAOUHSC_01010 purC<br />
phosphoribosylaminoimidazole-succinocarboxamide<br />
synthase<br />
− -4.5 -2.2<br />
SAOUHSC_01011 purS<br />
phosphoribosylformylglycinamidine synthase, PurS<br />
protein<br />
− -4.9 -2.3<br />
SAOUHSC_01788 thrS threonyl-tRNA synthetase − -2.1 -2.4<br />
SAOUHSC_01018 purD phosphoribosylamine-glycine ligase − -2.6 -1.1<br />
SAOUHSC_01013 purL phosphoribosylformylglycinamidine synthase II − -3.4 -1.5<br />
SAOUHSC_01012 purQ phosphoribosylformylglycinamidine synthase I − -4.0 -1.9<br />
a Up-regulated protein abundance in internalized staphylococci is indicated <strong>by</strong> “+”, down-regulated abundance <strong>by</strong> ”–“.<br />
b Differentially regulated genes (significant with p* < 0.05 and with a minimal absolute fold change <strong>of</strong> 2) are indicated in bold.<br />
145


