

genomewide characterization of host-pathogen interactions by ...
genomewide characterization of host-pathogen interactions by ...
genomewide characterization of host-pathogen interactions by ...

Create successful ePaper yourself
Turn your PDF publications into a flip-book with our unique Google optimized e-Paper software.
Maren Depke<br />
Results<br />
Pathogen Gene Expression Pr<strong>of</strong>iling<br />
Comparison <strong>of</strong> experimental condition groups and assessment <strong>of</strong> differentially regulated<br />
genes/sequences<br />
The first general data analysis steps had provided insight into the overall similarity <strong>of</strong> the 23<br />
arrays available after hybridization <strong>of</strong> samples and controls from the infection experiment.<br />
Biological replicates exhibited good reproducibility. The time-matched serum/CO 2 controls for<br />
the internalized samples built a distinct group <strong>of</strong> samples. As a more detailed analysis revealed<br />
similarities <strong>of</strong> these controls with stationary phase/stringent response, it became apparent that<br />
the 1 h serum/CO 2 samples were the most suitable control to use as baseline in this study.<br />
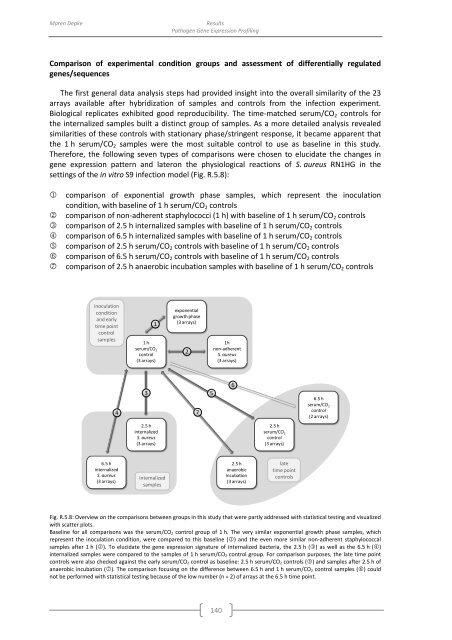
Therefore, the following seven types <strong>of</strong> comparisons were chosen to elucidate the changes in<br />
gene expression pattern and lateron the physiological reactions <strong>of</strong> S. aureus RN1HG in the<br />
settings <strong>of</strong> the in vitro S9 infection model (Fig. R.5.8):<br />
<br />
<br />
<br />
<br />
<br />
<br />
<br />
comparison <strong>of</strong> exponential growth phase samples, which represent the inoculation<br />
condition, with baseline <strong>of</strong> 1 h serum/CO 2 controls<br />
comparison <strong>of</strong> non-adherent staphylococci (1 h) with baseline <strong>of</strong> 1 h serum/CO 2 controls<br />
comparison <strong>of</strong> 2.5 h internalized samples with baseline <strong>of</strong> 1 h serum/CO 2 controls<br />
comparison <strong>of</strong> 6.5 h internalized samples with baseline <strong>of</strong> 1 h serum/CO 2 controls<br />
comparison <strong>of</strong> 2.5 h serum/CO 2 controls with baseline <strong>of</strong> 1 h serum/CO 2 controls<br />
comparison <strong>of</strong> 6.5 h serum/CO 2 controls with baseline <strong>of</strong> 1 h serum/CO 2 controls<br />
comparison <strong>of</strong> 2.5 h anaerobic incubation samples with baseline <strong>of</strong> 1 h serum/CO 2 controls<br />
inoculation<br />
condition<br />
and early<br />
time point<br />
control<br />
samples<br />
1<br />
1 h<br />
serum/CO 2<br />
control<br />
(3 arrays)<br />
exponential<br />
growth phase<br />
(3 arrays)<br />
2<br />
1h<br />
non-adherent<br />
S. aureus<br />
(3 arrays)<br />
4<br />
3<br />
7<br />
5<br />
6<br />
6.5 h<br />
serum/CO 2<br />
control<br />
(2 arrays)<br />
2.5 h<br />
internalized<br />
S. aureus<br />
(3 arrays)<br />
2.5 h<br />
serum/CO 2<br />
control<br />
(3 arrays)<br />
6.5 h<br />
internalized<br />
S. aureus<br />
(3 arrays)<br />
internalized<br />
samples<br />
2.5 h<br />
anaerobic<br />
incubation<br />
(3 arrays)<br />
late<br />
time point<br />
controls<br />
Fig. R.5.8: Overview on the comparisons between groups in this study that were partly addressed with statistical testing and visualized<br />
with scatter plots.<br />
Baseline for all comparisons was the serum/CO 2 control group <strong>of</strong> 1 h. The very similar exponential growth phase samples, which<br />
represent the inoculation condition, were compared to this baseline () and the even more similar non-adherent staphylococcal<br />
samples after 1 h (). To elucidate the gene expression signature <strong>of</strong> internalized bacteria, the 2.5 h () as well as the 6.5 h ()<br />
internalized samples were compared to the samples <strong>of</strong> 1 h serum/CO 2 control group. For comparison purposes, the late time point<br />
controls were also checked against the early serum/CO 2 control as baseline: 2.5 h serum/CO 2 controls () and samples after 2.5 h <strong>of</strong><br />
anaerobic incubation (). The comparison focusing on the difference between 6.5 h and 1 h serum/CO 2 control samples () could<br />
not be performed with statistical testing because <strong>of</strong> the low number (n = 2) <strong>of</strong> arrays at the 6.5 h time point.<br />
140


