

genomewide characterization of host-pathogen interactions by ...
genomewide characterization of host-pathogen interactions by ...
genomewide characterization of host-pathogen interactions by ...

Create successful ePaper yourself
Turn your PDF publications into a flip-book with our unique Google optimized e-Paper software.
Maren Depke<br />
Results<br />
Host Cell Gene Expression Pattern in an in vitro Infection Model<br />
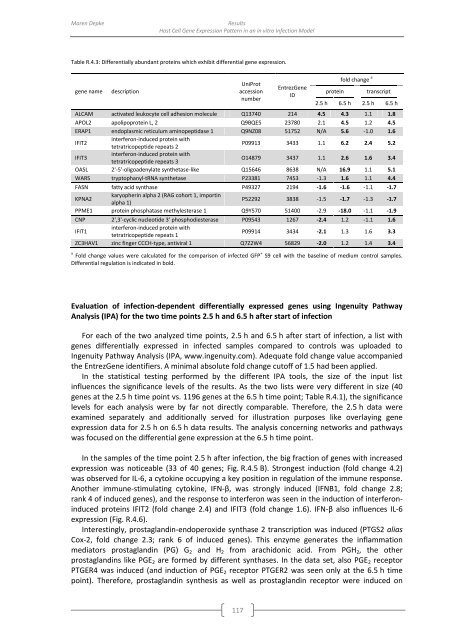
Table R.4.3: Differentially abundant proteins which exhibit differential gene expression.<br />
gene name<br />
description<br />
UniProt<br />
accession<br />
number<br />
EntrezGene<br />
ID<br />
protein<br />
fold change a<br />
transcript<br />
2.5 h 6.5 h 2.5 h 6.5 h<br />
ALCAM activated leukocyte cell adhesion molecule Q13740 214 4.5 4.3 1.1 1.8<br />
APOL2 apolipoprotein L, 2 Q9BQE5 23780 2.1 4.5 1.2 4.5<br />
ERAP1 endoplasmic reticulum aminopeptidase 1 Q9NZ08 51752 N/A 5.6 -1.0 1.6<br />
IFIT2<br />
interferon-induced protein with<br />
tetratricopeptide repeats 2<br />
P09913 3433 1.1 6.2 2.4 5.2<br />
IFIT3<br />
interferon-induced protein with<br />
tetratricopeptide repeats 3<br />
O14879 3437 1.1 2.6 1.6 3.4<br />
OASL 2'-5'-oligoadenylate synthetase-like Q15646 8638 N/A 16.9 1.1 5.1<br />
WARS tryptophanyl-tRNA synthetase P23381 7453 -1.3 1.6 1.1 4.4<br />
FASN fatty acid synthase P49327 2194 -1.6 -1.6 -1.1 -1.7<br />
KPNA2<br />
karyopherin alpha 2 (RAG cohort 1, importin<br />
alpha 1)<br />
P52292 3838 -1.5 -1.7 -1.3 -1.7<br />
PPME1 protein phosphatase methylesterase 1 Q9Y570 51400 -2.9 -18.0 -1.1 -1.9<br />
CNP 2',3'-cyclic nucleotide 3' phosphodiesterase P09543 1267 -2.4 1.2 -1.1 1.6<br />
IFIT1<br />
interferon-induced protein with<br />
tetratricopeptide repeats 1<br />
P09914 3434 -2.1 1.3 1.6 3.3<br />
ZC3HAV1 zinc finger CCCH-type, antiviral 1 Q7Z2W4 56829 -2.0 1.2 1.4 3.4<br />
a Fold change values were calculated for the comparison <strong>of</strong> infected GFP + S9 cell with the baseline <strong>of</strong> medium control samples.<br />
Differential regulation is indicated in bold.<br />
Evaluation <strong>of</strong> infection-dependent differentially expressed genes using Ingenuity Pathway<br />
Analysis (IPA) for the two time points 2.5 h and 6.5 h after start <strong>of</strong> infection<br />
For each <strong>of</strong> the two analyzed time points, 2.5 h and 6.5 h after start <strong>of</strong> infection, a list with<br />
genes differentially expressed in infected samples compared to controls was uploaded to<br />
Ingenuity Pathway Analysis (IPA, www.ingenuity.com). Adequate fold change value accompanied<br />
the EntrezGene identifiers. A minimal absolute fold change cut<strong>of</strong>f <strong>of</strong> 1.5 had been applied.<br />
In the statistical testing performed <strong>by</strong> the different IPA tools, the size <strong>of</strong> the input list<br />
influences the significance levels <strong>of</strong> the results. As the two lists were very different in size (40<br />
genes at the 2.5 h time point vs. 1196 genes at the 6.5 h time point; Table R.4.1), the significance<br />
levels for each analysis were <strong>by</strong> far not directly comparable. Therefore, the 2.5 h data were<br />
examined separately and additionally served for illustration purposes like overlaying gene<br />
expression data for 2.5 h on 6.5 h data results. The analysis concerning networks and pathways<br />
was focused on the differential gene expression at the 6.5 h time point.<br />
In the samples <strong>of</strong> the time point 2.5 h after infection, the big fraction <strong>of</strong> genes with increased<br />
expression was noticeable (33 <strong>of</strong> 40 genes; Fig. R.4.5 B). Strongest induction (fold change 4.2)<br />
was observed for IL-6, a cytokine occupying a key position in regulation <strong>of</strong> the immune response.<br />
Another immune-stimulating cytokine, IFN-β, was strongly induced (IFNB1, fold change 2.8;<br />
rank 4 <strong>of</strong> induced genes), and the response to interferon was seen in the induction <strong>of</strong> interferoninduced<br />
proteins IFIT2 (fold change 2.4) and IFIT3 (fold change 1.6). IFN-β also influences IL-6<br />
expression (Fig. R.4.6).<br />
Interestingly, prostaglandin-endoperoxide synthase 2 transcription was induced (PTGS2 alias<br />
Cox-2, fold change 2.3; rank 6 <strong>of</strong> induced genes). This enzyme generates the inflammation<br />
mediators prostaglandin (PG) G 2 and H 2 from arachidonic acid. From PGH 2 , the other<br />
prostaglandins like PGE 2 are formed <strong>by</strong> different synthases. In the data set, also PGE 2 receptor<br />
PTGER4 was induced (and induction <strong>of</strong> PGE 2 receptor PTGER2 was seen only at the 6.5 h time<br />
point). Therefore, prostaglandin synthesis as well as prostaglandin receptor were induced on<br />
117


