

genomewide characterization of host-pathogen interactions by ...
genomewide characterization of host-pathogen interactions by ...
genomewide characterization of host-pathogen interactions by ...

Create successful ePaper yourself
Turn your PDF publications into a flip-book with our unique Google optimized e-Paper software.
Maren Depke<br />
Results<br />
Host Cell Gene Expression Pattern in an in vitro Infection Model<br />
Differentially abundant proteins in infected samples compared to medium-treated controls<br />
[Melanie Gutjahr]<br />
Samples for transcriptome analysis were generated from the same experiments which yielded<br />
samples for a proteome study (Melanie Gutjahr). Here, a gel-free mass spectrometric analysis<br />
was performed, which allowed the identification <strong>of</strong> 1049 proteins in all analyzed samples. Of<br />
these, Melanie Gutjahr classified 112 and 224 as different in abundance 2.5 h and 6.5 h after start<br />
<strong>of</strong> infection, respectively. At the 2.5 h time point, reduced abundance prevailed with 73 proteins<br />
in comparison to 39 proteins with increased abundance. In contrary, 96 reduced and 128<br />
increased proteins were observed 6.5 h after start <strong>of</strong> infection. The common signature <strong>of</strong> both<br />
2.5 h and 6.5 h time point included 63 proteins, whereas 49 and 161 proteins were specifically<br />
regulated at the 2.5 h and 6.5 h time point, respectively. Reverse regulation at both time points<br />
did not exist.<br />
UniProt accession numbers <strong>of</strong> proteins exhibiting differential abundance were mapped to<br />
EntrezGene IDs using the UniProt ID mapping tool (www.uniprot.org). The majority <strong>of</strong> these<br />
EntrezGene IDs was available as annotation for sequences <strong>of</strong> the GeneChip Human Gene 1.0 ST<br />
array in Rosetta Resolver s<strong>of</strong>tware. Finally, 98 regulated proteins were available for comparison<br />
with transcriptome data from samples 2.5 h after infection, and at the 6.5 h time point, 198<br />
regulated proteins could be compared to array results (Table R.4.2).<br />
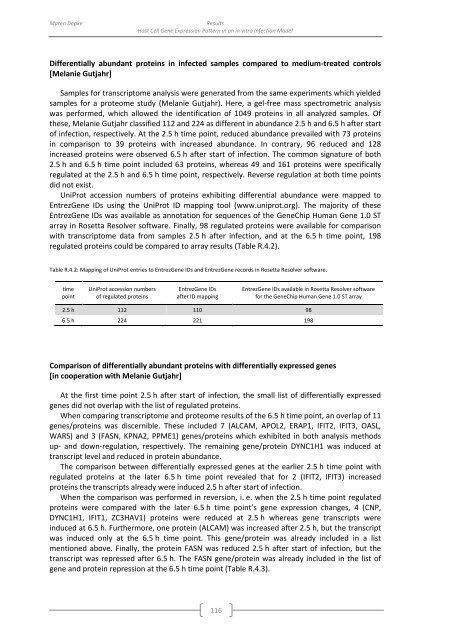
Table R.4.2: Mapping <strong>of</strong> UniProt entries to EntrezGene IDs and EntrezGene records in Rosetta Resolver s<strong>of</strong>tware.<br />
time<br />
point<br />
UniProt accession numbers<br />
<strong>of</strong> regulated proteins<br />
EntrezGene IDs<br />
after ID mapping<br />
EntrezGene IDs available in Rosetta Resolver s<strong>of</strong>tware<br />
for the GeneChip Human Gene 1.0 ST array<br />
2.5 h 112 110 98<br />
6.5 h 224 221 198<br />
Comparison <strong>of</strong> differentially abundant proteins with differentially expressed genes<br />
[in cooperation with Melanie Gutjahr]<br />
At the first time point 2.5 h after start <strong>of</strong> infection, the small list <strong>of</strong> differentially expressed<br />
genes did not overlap with the list <strong>of</strong> regulated proteins.<br />
When comparing transcriptome and proteome results <strong>of</strong> the 6.5 h time point, an overlap <strong>of</strong> 11<br />
genes/proteins was discernible. These included 7 (ALCAM, APOL2, ERAP1, IFIT2, IFIT3, OASL,<br />
WARS) and 3 (FASN, KPNA2, PPME1) genes/proteins which exhibited in both analysis methods<br />
up- and down-regulation, respectively. The remaining gene/protein DYNC1H1 was induced at<br />
transcript level and reduced in protein abundance.<br />
The comparison between differentially expressed genes at the earlier 2.5 h time point with<br />
regulated proteins at the later 6.5 h time point revealed that for 2 (IFIT2, IFIT3) increased<br />
proteins the transcripts already were induced 2.5 h after start <strong>of</strong> infection.<br />
When the comparison was performed in reversion, i. e. when the 2.5 h time point regulated<br />
proteins were compared with the later 6.5 h time point’s gene expression changes, 4 (CNP,<br />
DYNC1H1, IFIT1, ZC3HAV1) proteins were reduced at 2.5 h whereas gene transcripts were<br />
induced at 6.5 h. Furthermore, one protein (ALCAM) was increased after 2.5 h, but the transcript<br />
was induced only at the 6.5 h time point. This gene/protein was already included in a list<br />
mentioned above. Finally, the protein FASN was reduced 2.5 h after start <strong>of</strong> infection, but the<br />
transcript was repressed after 6.5 h. The FASN gene/protein was already included in the list <strong>of</strong><br />
gene and protein repression at the 6.5 h time point (Table R.4.3).<br />
116


