Etudes et évaluation de processus océaniques par des hiérarchies ...
Etudes et évaluation de processus océaniques par des hiérarchies ... Etudes et évaluation de processus océaniques par des hiérarchies ...
114 CHAPITRE 4. ETUDES DE PROCESSUS OCÉANOGRAPHIQUES APRIL 2008 W I R T H A N D B A R N I E R 813 tel-00545911, version 1 - 13 Dec 2010 averaged vertical velocity vanishes at every depth. No such constraint applies to the horizontal velocity components. For the case of an alignment of the rotation vector and gravity, the average horizontal velocity vanishes at every depth because the problem is invariant to rotations around the vertical axis. This is not the case for tilted convection. Indeed, Hathaway and Somerville (1983) noted that the tilted rotation vector can induce mean flows by producing correlations between the vertical and horizontal velocity components. The numerical calculations of Hathaway and Somerville (1983) are at very small Rayleigh and Taylor numbers and are not in a turbulent regime. They studied the influence of tilted rotation on the dynamics of convective rolls, and noted that when the Taylor number is increased, the averaged velocities and the correlations between the vertical and horizontal velocity components decrease. No quantitative estimate for the magnitude of the horizontal velocity in the case of oceanic tilted convection is thus possible from their calculations. Our calculations are at much higher Rayleigh and Taylor numbers and are tuned to investigate oceanic convection. The equation for the horizontally averaged velocity is given by t u h z uw h f h z 2 u h , t h z w h fu h z 2 h . 13 14 These equations also reflect the fact that a vanishing total momentum (depth-averaged u h and h ) is conserved at all times because the vertical integral of z uw h and z w h vanish due to the vanishing vertical velocity at the top and bottom boundaries. If we suppose that the velocity variables are statistically stationary, the time derivative vanishes when time averages, denoted by .., t , are taken. If we further neglect the direct effects of viscosity in Eqs. (13) and (14), we obtain f h,t z uw h,t , fu h,t z w h,t . 15 16 Because upward-moving fluid parcels are deflected north and westward and downward-moving fluid parcels are deflected south and eastward by rotation (conservation of angular momentum with a tilted rotation vector), this leads to a negative correlation of uw h,t (see Fig. 7c) and a positive correlation of w h, t (see Fig. 7d). The vertical velocity component (w) vanishes at the lower and upper boundary, while the horizontal velocity components (u, ) vanish only on the lower (no slip) boundary and have a local extreme at the upper boundary (vanishing first derivative). This leads to a positive velocity to a northeastward mean velocity in the upper kilometer of the ocean and an opposite velocity in the deeper part. In Fig. 8 it can be appreciated that Eqs. (15) and (16) are almost perfectly verified for an averaging over horizontal slices of the entire domain at 30 consecutive instances of time, separated by 3 h. Small differences are visible near the upper and lower boundaries. The neglected friction plays a nonnegligible role for the differences at the lower boundary. Other differences are caused by the incomplete elimination of the terms containing a time derivative due to a too short averaging period. For experiment E31 the mean meridional velocity averaged over the upper 1 km of the ocean is about 8 10 3 m s 1 , with the zonal velocity being much smaller (see Figs. 7a,b). We would like to remark that the existence of a nonvanishing horizontal mean velocity does not contradict the assumption of locality of the convection process and the usage of biperiodic geometry. The above clearly shows that the horizontal mean velocity is generated by a local balance between Coriolis force and turbulent Reynolds stress. c. Second-order moments In the previous subsection we clearly saw the importance of second-order moments as they are responsible for the generation of a mean horizontal velocity. It is the very nature of the turbulent closure problem that nth-order correlations are governed by (n 1)th-order correlations. We first reconsider the question of the right scaling for w rms w 2 h,t , and we see in Fig. 9a that u scal B .38 is almost perfectly verified. This coefficient is close to, but significantly higher than, 1/3 of the three-dimensional scaling. This might be the remnant of a 1/2 scaling of the rotationally dominated case. [The flux Rayleigh number (Ra f ) is constant in all of the experiments.] With an increasing Rayleigh number the dynamics further converge toward the three-dimensional regime. It is thus reasonable to suppose that in the real ocean, where the Rayleigh number is many orders of magnitude higher, the dynamics are in the 3D regime, justifying our approach to using nonrotational scaling as the basis of our calculations. When considering second-order moments of velocity components we see in Fig. 9b that the vertical component shows no considerable dependence on the latitude . The values in the experiments with a tilted rotation vector are mostly a little smaller than the nontilted
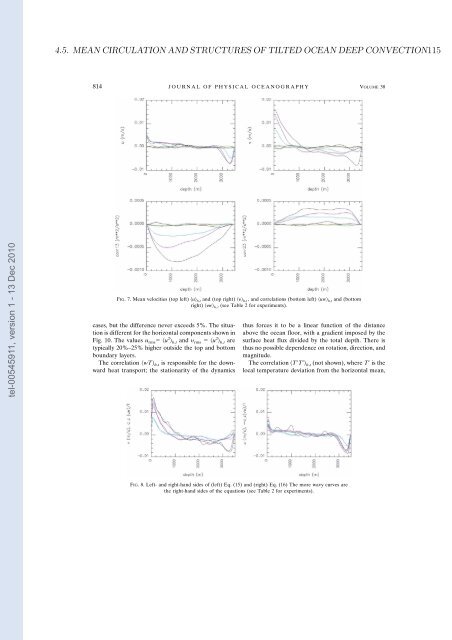
4.5. MEAN CIRCULATION AND STRUCTURES OF TILTED OCEAN DEEP CONVECTION115 814 J O U R N A L O F P H Y S I C A L O C E A N O G R A P H Y VOLUME 38 tel-00545911, version 1 - 13 Dec 2010 FIG. 7. Mean velocities (top left) u h,t and (top right) h,t , and correlations (bottom left) uw h,t and (bottom right) w h, t (see Table 2 for experiments). cases, but the difference never exceeds 5%. The situation is different for the horizontal components shown in Fig. 10. The values u rms u 2 h,t and rms u 2 h,t are typically 20%–25% higher outside the top and bottom boundary layers. The correlation wT h,t is responsible for the downward heat transport; the stationarity of the dynamics thus forces it to be a linear function of the distance above the ocean floor, with a gradient imposed by the surface heat flux divided by the total depth. There is thus no possible dependence on rotation, direction, and magnitude. The correlation TT h,t (not shown), where T is the local temperature deviation from the horizontal mean, FIG. 8. Left- and right-hand sides of (left) Eq. (15) and (right) Eq. (16) The more wavy curves are the right-hand sides of the equations (see Table 2 for experiments).
- Page 69 and 70: 4.2. THE PARAMETRIZATION OF BAROCLI
- Page 71 and 72: 4.2. THE PARAMETRIZATION OF BAROCLI
- Page 73 and 74: 4.2. THE PARAMETRIZATION OF BAROCLI
- Page 75 and 76: 4.2. THE PARAMETRIZATION OF BAROCLI
- Page 77 and 78: 4.2. THE PARAMETRIZATION OF BAROCLI
- Page 79 and 80: 4.3. A NON-HYDROSTATIC FLAT-BOTTOM
- Page 81 and 82: 4.3. A NON-HYDROSTATIC FLAT-BOTTOM
- Page 83 and 84: 4.3. A NON-HYDROSTATIC FLAT-BOTTOM
- Page 85 and 86: 4.3. A NON-HYDROSTATIC FLAT-BOTTOM
- Page 87 and 88: 4.3. A NON-HYDROSTATIC FLAT-BOTTOM
- Page 89 and 90: 4.3. A NON-HYDROSTATIC FLAT-BOTTOM
- Page 91 and 92: 4.3. A NON-HYDROSTATIC FLAT-BOTTOM
- Page 93 and 94: 4.3. A NON-HYDROSTATIC FLAT-BOTTOM
- Page 95 and 96: 4.3. A NON-HYDROSTATIC FLAT-BOTTOM
- Page 97 and 98: 4.4. TILTED CONVECTIVE PLUMES IN NU
- Page 99 and 100: 4.4. TILTED CONVECTIVE PLUMES IN NU
- Page 101 and 102: 4.4. TILTED CONVECTIVE PLUMES IN NU
- Page 103 and 104: 4.4. TILTED CONVECTIVE PLUMES IN NU
- Page 105 and 106: 4.4. TILTED CONVECTIVE PLUMES IN NU
- Page 107 and 108: 4.4. TILTED CONVECTIVE PLUMES IN NU
- Page 109 and 110: 4.5. MEAN CIRCULATION AND STRUCTURE
- Page 111 and 112: 4.5. MEAN CIRCULATION AND STRUCTURE
- Page 113 and 114: 4.5. MEAN CIRCULATION AND STRUCTURE
- Page 115 and 116: 4.5. MEAN CIRCULATION AND STRUCTURE
- Page 117 and 118: 4.5. MEAN CIRCULATION AND STRUCTURE
- Page 119: 4.5. MEAN CIRCULATION AND STRUCTURE
- Page 123 and 124: 4.5. MEAN CIRCULATION AND STRUCTURE
- Page 125 and 126: 4.6. ESTIMATION OF FRICTION PARAMET
- Page 127 and 128: 4.6. ESTIMATION OF FRICTION PARAMET
- Page 129 and 130: 4.6. ESTIMATION OF FRICTION PARAMET
- Page 131 and 132: 4.6. ESTIMATION OF FRICTION PARAMET
- Page 133 and 134: 4.6. ESTIMATION OF FRICTION PARAMET
- Page 135 and 136: 4.6. ESTIMATION OF FRICTION PARAMET
- Page 137 and 138: 4.7. ON THE BASIC STRUCTURE OF OCEA
- Page 139 and 140: 4.7. ON THE BASIC STRUCTURE OF OCEA
- Page 141 and 142: 4.7. ON THE BASIC STRUCTURE OF OCEA
- Page 143 and 144: 4.7. ON THE BASIC STRUCTURE OF OCEA
- Page 145 and 146: 4.7. ON THE BASIC STRUCTURE OF OCEA
- Page 147 and 148: 4.7. ON THE BASIC STRUCTURE OF OCEA
- Page 149 and 150: 4.7. ON THE BASIC STRUCTURE OF OCEA
- Page 151 and 152: 4.8. ESTIMATION OF FRICTION LAWS AN
- Page 153 and 154: 4.8. ESTIMATION OF FRICTION LAWS AN
- Page 155 and 156: 4.8. ESTIMATION OF FRICTION LAWS AN
- Page 157 and 158: 4.8. ESTIMATION OF FRICTION LAWS AN
- Page 159 and 160: 4.8. ESTIMATION OF FRICTION LAWS AN
- Page 161 and 162: 4.8. ESTIMATION OF FRICTION LAWS AN
- Page 163 and 164: 4.8. ESTIMATION OF FRICTION LAWS AN
- Page 165 and 166: 4.8. ESTIMATION OF FRICTION LAWS AN
- Page 167 and 168: 4.9. ON THE NUMERICAL RESOLUTION OF
- Page 169 and 170: 4.9. ON THE NUMERICAL RESOLUTION OF
4.5. MEAN CIRCULATION AND STRUCTURES OF TILTED OCEAN DEEP CONVECTION115<br />
814 J O U R N A L O F P H Y S I C A L O C E A N O G R A P H Y VOLUME 38<br />
tel-00545911, version 1 - 13 Dec 2010<br />
FIG. 7. Mean velocities (top left) u h,t and (top right) h,t , and correlations (bottom left) uw h,t and (bottom<br />
right) w h, t (see Table 2 for experiments).<br />
cases, but the difference never exceeds 5%. The situation<br />
is different for the horizontal components shown in<br />
Fig. 10. The values u rms u 2 h,t and rms u 2 h,t are<br />
typically 20%–25% higher outsi<strong>de</strong> the top and bottom<br />
boundary layers.<br />
The correlation wT h,t is responsible for the downward<br />
heat transport; the stationarity of the dynamics<br />
thus forces it to be a linear function of the distance<br />
above the ocean floor, with a gradient imposed by the<br />
surface heat flux divi<strong>de</strong>d by the total <strong>de</strong>pth. There is<br />
thus no possible <strong>de</strong>pen<strong>de</strong>nce on rotation, direction, and<br />
magnitu<strong>de</strong>.<br />
The correlation TT h,t (not shown), where T is the<br />
local temperature <strong>de</strong>viation from the horizontal mean,<br />
FIG. 8. Left- and right-hand si<strong>de</strong>s of (left) Eq. (15) and (right) Eq. (16) The more wavy curves are<br />
the right-hand si<strong>de</strong>s of the equations (see Table 2 for experiments).


