- Page 1 and 2:
THÈSE Pour l’obtention du Grade
- Page 3 and 4:
Acknowledgements Acknowledgements T
- Page 5 and 6:
Résumé __________________________
- Page 7 and 8:
Nomenclature Nomenclature Roman tel
- Page 9 and 10:
Nomenclature Subscripts tel-0062309
- Page 11 and 12:
Contents tel-00623090, version 1 -
- Page 13 and 14:
Contents 6.4. SYNGAS FUELLED-ENGINE
- Page 15 and 16:
Introduction CHAPTER 1 INTRODUCTION
- Page 17 and 18:
Introduction proves to have higher
- Page 19 and 20:
Introduction Chapter 3 - Experiment
- Page 21 and 22:
Bibliographic revision CHAPTER 2 BI
- Page 23 and 24:
Bibliographic revision point today
- Page 25 and 26: Bibliographic revision - Boudouard
- Page 27 and 28: Bibliographic revision Table 2.1 -
- Page 29 and 30: Bibliographic revision Biomass Dryi
- Page 31 and 32: Bibliographic revision Circulating
- Page 33 and 34: Bibliographic revision or eliminate
- Page 35 and 36: Bibliographic revision established
- Page 37 and 38: Bibliographic revision Hydrogen Hyd
- Page 39 and 40: Bibliographic revision of low moist
- Page 41 and 42: Bibliographic revision scrubbing an
- Page 43 and 44: Bibliographic revision suggests tha
- Page 45 and 46: Bibliographic revision 1 d( δ A) 1
- Page 47 and 48: Bibliographic revision Since n is
- Page 49 and 50: Bibliographic revision 2 ( rsr ) 2
- Page 51 and 52: Bibliographic revision This evoluti
- Page 53 and 54: Bibliographic revision The burning
- Page 55 and 56: Bibliographic revision δVG = − a
- Page 57 and 58: Bibliographic revision 2 1 − −
- Page 59 and 60: Bibliographic revision where the su
- Page 61 and 62: Bibliographic revision the stretche
- Page 63 and 64: Bibliographic revision burning velo
- Page 65 and 66: Experimental set ups and diagnostic
- Page 67 and 68: Experimental set ups and diagnostic
- Page 69 and 70: Experimental set ups and diagnostic
- Page 71 and 72: Experimental set ups and diagnostic
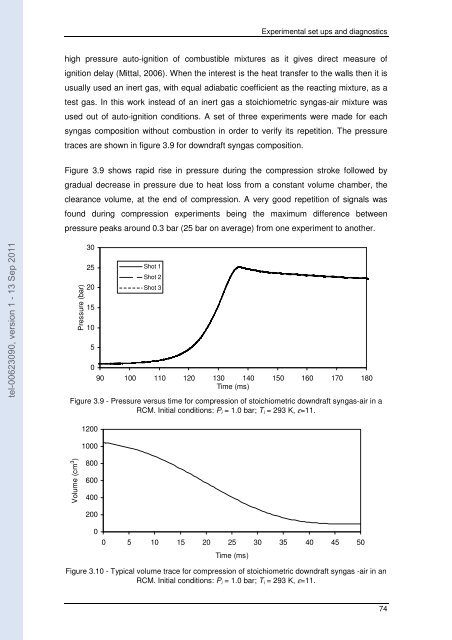
- Page 73 and 74: Experimental set ups and diagnostic
- Page 75: Experimental set ups and diagnostic
- Page 79 and 80: Experimental set ups and diagnostic
- Page 81 and 82: Experimental set ups and diagnostic
- Page 83 and 84: Experimental set ups and diagnostic
- Page 85 and 86: Experimental set ups and diagnostic
- Page 87 and 88: Experimental set ups and diagnostic
- Page 89 and 90: Chapter 4 CHAPTER 4 EXPERIMENTAL AN
- Page 91 and 92: Chapter 4 4.1 Laminar burning veloc
- Page 93 and 94: Chapter 4 4.1.1.1 Flame morphology
- Page 95 and 96: Chapter 4 P i = 1.0 bar, Ti = 293 K
- Page 97 and 98: Chapter 4 Figure 4.5 shows schliere
- Page 99 and 100: Chapter 4 P i = 2.0 bar, T i = 293
- Page 101 and 102: Chapter 4 Sn (m/s) 3.0 2.5 2.0 1.5
- Page 103 and 104: Chapter 4 5 ms 10 ms 15 ms 20 ms 25
- Page 105 and 106: Chapter 4 behaviour of the curves r
- Page 107 and 108: Chapter 4 1.50 Sn (m/s) 1.25 1.00 0
- Page 109 and 110: Chapter 4 0.5 0.4 φ =1.0 Su (m/s)
- Page 111 and 112: Chapter 4 variation of the normaliz
- Page 113 and 114: Chapter 4 4.1.1.6 Comparison with o
- Page 115 and 116: Chapter 4 The values of laminar bur
- Page 117 and 118: Chapter 4 Pressure (bar) 7 6 5 4 3
- Page 119 and 120: Chapter 4 0.5 0.4 φ=1.2 Su (m/s) 0
- Page 121 and 122: Chapter 4 0.3 φ=0.8 Su (m/s) 0.2 0
- Page 123 and 124: Chapter 4 a minimum pressure to exp
- Page 125 and 126: Chapter 4 Notice the similar behavi
- Page 127 and 128:
Chapter 4 A very good agreement bet
- Page 129 and 130:
Chapter 4 ( ) Q = h T − T (4.21)
- Page 131 and 132:
Chapter 4 tel-00623090, version 1 -
- Page 133 and 134:
Chapter 4 are tested and discussed.
- Page 135 and 136:
Chapter 4 7 500 Pressure (bar) 6 5
- Page 137 and 138:
Chapter 4 Pressure (bar) 7 6 5 4 3
- Page 139 and 140:
Chapter 4 4.2.3.4 Quenching distanc
- Page 141 and 142:
Chapter 4 10000 Quenching distance
- Page 143 and 144:
Chapter 5 CHAPTER 5 EXPERIMENTAL ST
- Page 145 and 146:
Chapter 5 30 10 25 8 Pressure (bar)
- Page 147 and 148:
Chapter 5 30 Piston position (mm) 2
- Page 149 and 150:
Chapter 5 5.1.1.4 In-cylinder press
- Page 151 and 152:
Chapter 5 estimation of various par
- Page 153 and 154:
Chapter 5 TDC 1.25 ms 2.5 ms 3.75 m
- Page 155 and 156:
Chapter 5 Piston position (mm) 500
- Page 157 and 158:
Chapter 5 tel-00623090, version 1 -
- Page 159 and 160:
Chapter 5 From figure 5.15 is possi
- Page 161 and 162:
Chapter 5 From figure 5.16 is obser
- Page 163 and 164:
Chapter 5 80 Pressure (bar) 70 60 5
- Page 165 and 166:
Chapter 5 80 10 Pmax (bar) 70 60 50
- Page 167 and 168:
Chapter 5 -5.0 ms -3.75 ms -2.5 ms
- Page 169 and 170:
Chapter 5 observation emphasis the
- Page 171 and 172:
Chapter 6 CHAPTER 6 NUMERICAL SIMUL
- Page 173 and 174:
Chapter 6 centered at the spark plu
- Page 175 and 176:
Chapter 6 H 2 O, (3) N 2 , (4) O 2
- Page 177 and 178:
Chapter 6 For all the above express
- Page 179 and 180:
Chapter 6 motions within the cylind
- Page 181 and 182:
Chapter 6 tel-00623090, version 1 -
- Page 183 and 184:
Chapter 6 Heat transfer Wei et al.,
- Page 185 and 186:
Chapter 6 The calibration coefficie
- Page 187 and 188:
Chapter 6 6.3.2.2 In-cylinder volum
- Page 189 and 190:
Chapter 6 40 Experimental 30 Numeri
- Page 191 and 192:
Chapter 6 80 70 60 Numerical Experi
- Page 193 and 194:
Chapter 6 downdraft syngas than for
- Page 195 and 196:
Chapter 6 80 23º BTDC 60 29.5º BT
- Page 197 and 198:
Chapter 6 with experimental results
- Page 199 and 200:
Conclusions CHAPTER 7 CONCLUSIONS 7
- Page 201 and 202:
Conclusions radius and time for syn
- Page 203 and 204:
Conclusions conditions, therefore s
- Page 205 and 206:
Conclusions tel-00623090, version 1
- Page 207 and 208:
References References tel-00623090,
- Page 209 and 210:
References tel-00623090, version 1
- Page 211 and 212:
References tel-00623090, version 1
- Page 213 and 214:
References tel-00623090, version 1
- Page 215 and 216:
References tel-00623090, version 1
- Page 217 and 218:
References tel-00623090, version 1
- Page 219 and 220:
References tel-00623090, version 1
- Page 221 and 222:
Appendix A - Overdetermined linear
- Page 223 and 224:
Appendix A - Overdetermined linear
- Page 225 and 226:
Appendix B- Syngas-air mixtures pro
- Page 227 and 228:
Appendix C -Rivère model Heat flux
- Page 229 and 230:
Appendix C -Rivère model The work
- Page 231 and 232:
tel-00623090, version 1 - 13 Sep 20