Etude de la combustion de gaz de synthèse issus d'un processus de ...
Etude de la combustion de gaz de synthèse issus d'un processus de ... Etude de la combustion de gaz de synthèse issus d'un processus de ...
Numerical simulation of a syngas-fuelled engine dV ⎛rc −1⎞ ⎛ ϕcosθ ⎞ = V TDC sinθ 1 dθ ⎜ 2 ⎟ + 2 2 ⎝ ⎠ ⎜ 1 − ϕ sin θ ⎟ ⎝ ⎠ (6.6) The mass fraction of each burned zone is defined as mbi , xbi , = ( i = 1,..., n) m (6.7) with the result for the total burned zone x b m = =∑ x (6.8) n b m i = 1 b, i tel-00623090, version 1 - 13 Sep 2011 The mass conservation equation is also applied to the cylinder charge, assuming zero blow-by, providing dm dm dm dm dm u b u bn , = + = + = 0 (6.9) dθ dθ dθ dθ dθ The previous relation has been derived assuming that the mass of each of the already burned zones remains constant after its combustion: dm b,i /dθ = 0 (i=1,…, n-1), resulting for the rate of change of mass of the total burned zone: n b θ = ∑ i 1 b, i θ = b, n θ (6.10) = dm d dm d dm d Also, the perfect gas state equation is applied to each zone. pV = m RT ( j = u, b − b ) (6.11) j j j j 1 n 6.1.2 Chemical composition and thermodynamic properties The unburned zone is considered to be a mixture of air and fuel, while also allowance is made for the presence of residual gas trapped in the engine cylinder. The composition and thermodynamic properties of the unburned mixture during compression and combustion are determined from the values of pressure, temperature, fuel–air equivalence ratio and residual gas mass fraction (Ferguson, 1986). After the start of combustion and until the end of expansion at EVO, the combustion products of each burned zone consist of a set of eleven chemical species: (1) CO 2 , (2) 170
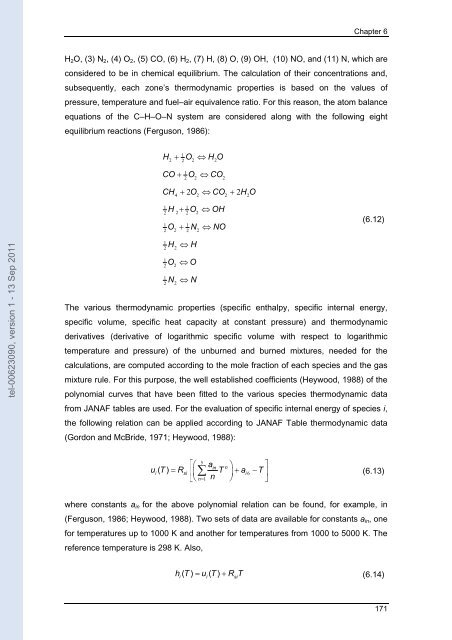
Chapter 6 H 2 O, (3) N 2 , (4) O 2 , (5) CO, (6) H 2 , (7) H, (8) O, (9) OH, (10) NO, and (11) N, which are considered to be in chemical equilibrium. The calculation of their concentrations and, subsequently, each zone’s thermodynamic properties is based on the values of pressure, temperature and fuel–air equivalence ratio. For this reason, the atom balance equations of the C–H–O–N system are considered along with the following eight equilibrium reactions (Ferguson, 1986): H + O ⇔ H O 1 2 2 2 2 CO + O ⇔CO 1 2 2 2 CH + 2O ⇔ CO + 2H O 4 2 2 2 H + O ⇔OH 1 1 2 2 2 2 O + N ⇔ NO 1 1 2 2 2 2 (6.12) tel-00623090, version 1 - 13 Sep 2011 1 2 1 2 1 2 H O N 2 2 2 ⇔ H ⇔ O ⇔ N The various thermodynamic properties (specific enthalpy, specific internal energy, specific volume, specific heat capacity at constant pressure) and thermodynamic derivatives (derivative of logarithmic specific volume with respect to logarithmic temperature and pressure) of the unburned and burned mixtures, needed for the calculations, are computed according to the mole fraction of each species and the gas mixture rule. For this purpose, the well established coefficients (Heywood, 1988) of the polynomial curves that have been fitted to the various species thermodynamic data from JANAF tables are used. For the evaluation of specific internal energy of species i, the following relation can be applied according to JANAF Table thermodynamic data (Gordon and McBride, 1971; Heywood, 1988): 5 ⎡⎛ ain n ⎞ ⎤ ui( T) = Rsi ⎢⎜ ∑ T ⎟+ ai6 −T⎥ ⎣⎝ n= 1 n ⎠ ⎦ (6.13) where constants a in for the above polynomial relation can be found, for example, in (Ferguson, 1986; Heywood, 1988). Two sets of data are available for constants a in , one for temperatures up to 1000 K and another for temperatures from 1000 to 5000 K. The reference temperature is 298 K. Also, h( T) = u ( T) + R T (6.14) i i si 171
- Page 123 and 124: Chapter 4 a minimum pressure to exp
- Page 125 and 126: Chapter 4 Notice the similar behavi
- Page 127 and 128: Chapter 4 A very good agreement bet
- Page 129 and 130: Chapter 4 ( ) Q = h T − T (4.21)
- Page 131 and 132: Chapter 4 tel-00623090, version 1 -
- Page 133 and 134: Chapter 4 are tested and discussed.
- Page 135 and 136: Chapter 4 7 500 Pressure (bar) 6 5
- Page 137 and 138: Chapter 4 Pressure (bar) 7 6 5 4 3
- Page 139 and 140: Chapter 4 4.2.3.4 Quenching distanc
- Page 141 and 142: Chapter 4 10000 Quenching distance
- Page 143 and 144: Chapter 5 CHAPTER 5 EXPERIMENTAL ST
- Page 145 and 146: Chapter 5 30 10 25 8 Pressure (bar)
- Page 147 and 148: Chapter 5 30 Piston position (mm) 2
- Page 149 and 150: Chapter 5 5.1.1.4 In-cylinder press
- Page 151 and 152: Chapter 5 estimation of various par
- Page 153 and 154: Chapter 5 TDC 1.25 ms 2.5 ms 3.75 m
- Page 155 and 156: Chapter 5 Piston position (mm) 500
- Page 157 and 158: Chapter 5 tel-00623090, version 1 -
- Page 159 and 160: Chapter 5 From figure 5.15 is possi
- Page 161 and 162: Chapter 5 From figure 5.16 is obser
- Page 163 and 164: Chapter 5 80 Pressure (bar) 70 60 5
- Page 165 and 166: Chapter 5 80 10 Pmax (bar) 70 60 50
- Page 167 and 168: Chapter 5 -5.0 ms -3.75 ms -2.5 ms
- Page 169 and 170: Chapter 5 observation emphasis the
- Page 171 and 172: Chapter 6 CHAPTER 6 NUMERICAL SIMUL
- Page 173: Chapter 6 centered at the spark plu
- Page 177 and 178: Chapter 6 For all the above express
- Page 179 and 180: Chapter 6 motions within the cylind
- Page 181 and 182: Chapter 6 tel-00623090, version 1 -
- Page 183 and 184: Chapter 6 Heat transfer Wei et al.,
- Page 185 and 186: Chapter 6 The calibration coefficie
- Page 187 and 188: Chapter 6 6.3.2.2 In-cylinder volum
- Page 189 and 190: Chapter 6 40 Experimental 30 Numeri
- Page 191 and 192: Chapter 6 80 70 60 Numerical Experi
- Page 193 and 194: Chapter 6 downdraft syngas than for
- Page 195 and 196: Chapter 6 80 23º BTDC 60 29.5º BT
- Page 197 and 198: Chapter 6 with experimental results
- Page 199 and 200: Conclusions CHAPTER 7 CONCLUSIONS 7
- Page 201 and 202: Conclusions radius and time for syn
- Page 203 and 204: Conclusions conditions, therefore s
- Page 205 and 206: Conclusions tel-00623090, version 1
- Page 207 and 208: References References tel-00623090,
- Page 209 and 210: References tel-00623090, version 1
- Page 211 and 212: References tel-00623090, version 1
- Page 213 and 214: References tel-00623090, version 1
- Page 215 and 216: References tel-00623090, version 1
- Page 217 and 218: References tel-00623090, version 1
- Page 219 and 220: References tel-00623090, version 1
- Page 221 and 222: Appendix A - Overdetermined linear
- Page 223 and 224: Appendix A - Overdetermined linear
Chapter 6<br />
H 2 O, (3) N 2 , (4) O 2 , (5) CO, (6) H 2 , (7) H, (8) O, (9) OH, (10) NO, and (11) N, which are<br />
consi<strong>de</strong>red to be in chemical equilibrium. The calcu<strong>la</strong>tion of their concentrations and,<br />
subsequently, each zone’s thermodynamic properties is based on the values of<br />
pressure, temperature and fuel–air equivalence ratio. For this reason, the atom ba<strong>la</strong>nce<br />
equations of the C–H–O–N system are consi<strong>de</strong>red along with the following eight<br />
equilibrium reactions (Ferguson, 1986):<br />
H + O ⇔ H O<br />
1<br />
2 2 2 2<br />
CO + O ⇔CO<br />
1<br />
2<br />
2 2<br />
CH + 2O ⇔ CO + 2H O<br />
4 2 2 2<br />
H + O ⇔OH<br />
1 1<br />
2 2 2 2<br />
O + N ⇔ NO<br />
1 1<br />
2 2 2 2<br />
(6.12)<br />
tel-00623090, version 1 - 13 Sep 2011<br />
1<br />
2<br />
1<br />
2<br />
1<br />
2<br />
H<br />
O<br />
N<br />
2<br />
2<br />
2<br />
⇔ H<br />
⇔ O<br />
⇔ N<br />
The various thermodynamic properties (specific enthalpy, specific internal energy,<br />
specific volume, specific heat capacity at constant pressure) and thermodynamic<br />
<strong>de</strong>rivatives (<strong>de</strong>rivative of logarithmic specific volume with respect to logarithmic<br />
temperature and pressure) of the unburned and burned mixtures, nee<strong>de</strong>d for the<br />
calcu<strong>la</strong>tions, are computed according to the mole fraction of each species and the gas<br />
mixture rule. For this purpose, the well established coefficients (Heywood, 1988) of the<br />
polynomial curves that have been fitted to the various species thermodynamic data<br />
from JANAF tables are used. For the evaluation of specific internal energy of species i,<br />
the following re<strong>la</strong>tion can be applied according to JANAF Table thermodynamic data<br />
(Gordon and McBri<strong>de</strong>, 1971; Heywood, 1988):<br />
5<br />
⎡⎛<br />
ain<br />
n ⎞ ⎤<br />
ui( T)<br />
= Rsi ⎢⎜<br />
∑ T ⎟+ ai6<br />
−T⎥<br />
⎣⎝<br />
n=<br />
1 n ⎠ ⎦<br />
(6.13)<br />
where constants a in for the above polynomial re<strong>la</strong>tion can be found, for example, in<br />
(Ferguson, 1986; Heywood, 1988). Two sets of data are avai<strong>la</strong>ble for constants a in , one<br />
for temperatures up to 1000 K and another for temperatures from 1000 to 5000 K. The<br />
reference temperature is 298 K. Also,<br />
h( T) = u ( T)<br />
+ R T<br />
(6.14)<br />
i i si<br />
171


