Etude de la combustion de gaz de synthèse issus d'un processus de ...
Etude de la combustion de gaz de synthèse issus d'un processus de ... Etude de la combustion de gaz de synthèse issus d'un processus de ...
Experimental and numerical laminar syngas combustion Heat radiation of the burned gases to the chamber walls are modeled neglecting the radiation of the particles. This assumption is reasonable due to the high purity of the tested mixtures. During combustion, heat radiation can have origin on unburned gases, which contains: H 2 , CO, CH 4 , CO 2 , N 2 and O 2 , and also on the burned gases, which mainly contains: CO 2 , H 2 O and N 2 , being irrelevant the remaining combustion products. Only molecules that have a non null dipolar moment are susceptible to emit thermal radiation (Boust, 2006). Therefore only CO 2 , H 2 O and CH 4 are considered. In practical terms, the radiation of the unburned gases heated by compression is insignificant comparatively with the burned gases, which temperature is 6-7 times higher. Thus, it is assumed that only CO 2 and H 2 O radiates significantly. tel-00623090, version 1 - 13 Sep 2011 The radiation heat transfer is modeled by the Stefan’s law considering the burned gases as a grey body with uniform temperature T g and ε the apparent grey-body emissivity calculated from the contributions of H 2 O and CO 2 . As the spectral emissivities of these species are similar, the emissivity variation term Δε is included. ε = ε + ε −Δ ε (4.25) CO2 H2O At the end of combustion, only burned gases are inside the chamber. Then, the net superficial radiative flow Q ,r received by the wall, with absorption factor α, from the burned gases is given by the Stefan’s constant. 4 4 ( ) Q = αεσ T − T (4.26) r g w When the sphere of burned gases (radius r) does not occupy the entire chamber (radius R), the sphere surface ratio gives the radiative flow. 2 4π r Qr( r) = Q 2 r (4.27) 4π R The emissivity of H 2 O and CO 2 as well as the variation term are calculated using the correlation of Leckner, (1972). This correlation reproduces the gases temperature influence, the partial pressure of each species and the length of the average radius. 4.2.2 Calculation procedure In the multi-zone model, flame propagation is seen as the consecutive consumption of unburned mixture within the zones with an equal mass distribution between the zones 126
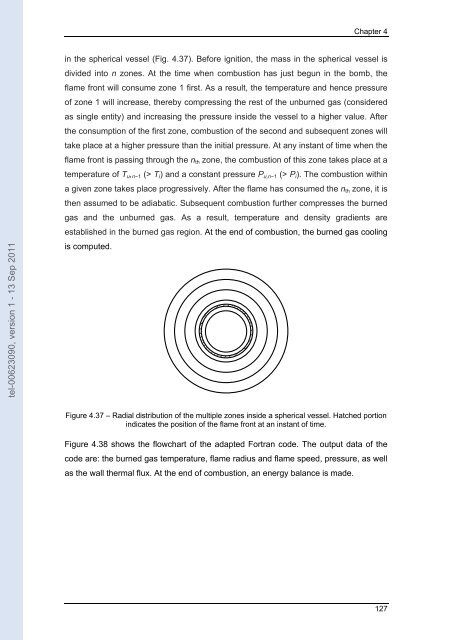
Chapter 4 tel-00623090, version 1 - 13 Sep 2011 in the spherical vessel (Fig. 4.37). Before ignition, the mass in the spherical vessel is divided into n zones. At the time when combustion has just begun in the bomb, the flame front will consume zone 1 first. As a result, the temperature and hence pressure of zone 1 will increase, thereby compressing the rest of the unburned gas (considered as single entity) and increasing the pressure inside the vessel to a higher value. After the consumption of the first zone, combustion of the second and subsequent zones will take place at a higher pressure than the initial pressure. At any instant of time when the flame front is passing through the n th zone, the combustion of this zone takes place at a temperature of T u , n−1 (> T i ) and a constant pressure P u,n−1 (> P i ). The combustion within a given zone takes place progressively. After the flame has consumed the n th zone, it is then assumed to be adiabatic. Subsequent combustion further compresses the burned gas and the unburned gas. As a result, temperature and density gradients are established in the burned gas region. At the end of combustion, the burned gas cooling is computed. Figure 4.37 – Radial distribution of the multiple zones inside a spherical vessel. Hatched portion indicates the position of the flame front at an instant of time. Figure 4.38 shows the flowchart of the adapted Fortran code. The output data of the code are: the burned gas temperature, flame radius and flame speed, pressure, as well as the wall thermal flux. At the end of combustion, an energy balance is made. 127
- Page 79 and 80: Experimental set ups and diagnostic
- Page 81 and 82: Experimental set ups and diagnostic
- Page 83 and 84: Experimental set ups and diagnostic
- Page 85 and 86: Experimental set ups and diagnostic
- Page 87 and 88: Experimental set ups and diagnostic
- Page 89 and 90: Chapter 4 CHAPTER 4 EXPERIMENTAL AN
- Page 91 and 92: Chapter 4 4.1 Laminar burning veloc
- Page 93 and 94: Chapter 4 4.1.1.1 Flame morphology
- Page 95 and 96: Chapter 4 P i = 1.0 bar, Ti = 293 K
- Page 97 and 98: Chapter 4 Figure 4.5 shows schliere
- Page 99 and 100: Chapter 4 P i = 2.0 bar, T i = 293
- Page 101 and 102: Chapter 4 Sn (m/s) 3.0 2.5 2.0 1.5
- Page 103 and 104: Chapter 4 5 ms 10 ms 15 ms 20 ms 25
- Page 105 and 106: Chapter 4 behaviour of the curves r
- Page 107 and 108: Chapter 4 1.50 Sn (m/s) 1.25 1.00 0
- Page 109 and 110: Chapter 4 0.5 0.4 φ =1.0 Su (m/s)
- Page 111 and 112: Chapter 4 variation of the normaliz
- Page 113 and 114: Chapter 4 4.1.1.6 Comparison with o
- Page 115 and 116: Chapter 4 The values of laminar bur
- Page 117 and 118: Chapter 4 Pressure (bar) 7 6 5 4 3
- Page 119 and 120: Chapter 4 0.5 0.4 φ=1.2 Su (m/s) 0
- Page 121 and 122: Chapter 4 0.3 φ=0.8 Su (m/s) 0.2 0
- Page 123 and 124: Chapter 4 a minimum pressure to exp
- Page 125 and 126: Chapter 4 Notice the similar behavi
- Page 127 and 128: Chapter 4 A very good agreement bet
- Page 129: Chapter 4 ( ) Q = h T − T (4.21)
- Page 133 and 134: Chapter 4 are tested and discussed.
- Page 135 and 136: Chapter 4 7 500 Pressure (bar) 6 5
- Page 137 and 138: Chapter 4 Pressure (bar) 7 6 5 4 3
- Page 139 and 140: Chapter 4 4.2.3.4 Quenching distanc
- Page 141 and 142: Chapter 4 10000 Quenching distance
- Page 143 and 144: Chapter 5 CHAPTER 5 EXPERIMENTAL ST
- Page 145 and 146: Chapter 5 30 10 25 8 Pressure (bar)
- Page 147 and 148: Chapter 5 30 Piston position (mm) 2
- Page 149 and 150: Chapter 5 5.1.1.4 In-cylinder press
- Page 151 and 152: Chapter 5 estimation of various par
- Page 153 and 154: Chapter 5 TDC 1.25 ms 2.5 ms 3.75 m
- Page 155 and 156: Chapter 5 Piston position (mm) 500
- Page 157 and 158: Chapter 5 tel-00623090, version 1 -
- Page 159 and 160: Chapter 5 From figure 5.15 is possi
- Page 161 and 162: Chapter 5 From figure 5.16 is obser
- Page 163 and 164: Chapter 5 80 Pressure (bar) 70 60 5
- Page 165 and 166: Chapter 5 80 10 Pmax (bar) 70 60 50
- Page 167 and 168: Chapter 5 -5.0 ms -3.75 ms -2.5 ms
- Page 169 and 170: Chapter 5 observation emphasis the
- Page 171 and 172: Chapter 6 CHAPTER 6 NUMERICAL SIMUL
- Page 173 and 174: Chapter 6 centered at the spark plu
- Page 175 and 176: Chapter 6 H 2 O, (3) N 2 , (4) O 2
- Page 177 and 178: Chapter 6 For all the above express
- Page 179 and 180: Chapter 6 motions within the cylind
Chapter 4<br />
tel-00623090, version 1 - 13 Sep 2011<br />
in the spherical vessel (Fig. 4.37). Before ignition, the mass in the spherical vessel is<br />
divi<strong>de</strong>d into n zones. At the time when <strong>combustion</strong> has just begun in the bomb, the<br />
f<strong>la</strong>me front will consume zone 1 first. As a result, the temperature and hence pressure<br />
of zone 1 will increase, thereby compressing the rest of the unburned gas (consi<strong>de</strong>red<br />
as single entity) and increasing the pressure insi<strong>de</strong> the vessel to a higher value. After<br />
the consumption of the first zone, <strong>combustion</strong> of the second and subsequent zones will<br />
take p<strong>la</strong>ce at a higher pressure than the initial pressure. At any instant of time when the<br />
f<strong>la</strong>me front is passing through the n th zone, the <strong>combustion</strong> of this zone takes p<strong>la</strong>ce at a<br />
temperature of T u , n−1 (> T i ) and a constant pressure P u,n−1 (> P i ). The <strong>combustion</strong> within<br />
a given zone takes p<strong>la</strong>ce progressively. After the f<strong>la</strong>me has consumed the n th zone, it is<br />
then assumed to be adiabatic. Subsequent <strong>combustion</strong> further compresses the burned<br />
gas and the unburned gas. As a result, temperature and <strong>de</strong>nsity gradients are<br />
established in the burned gas region. At the end of <strong>combustion</strong>, the burned gas cooling<br />
is computed.<br />
Figure 4.37 – Radial distribution of the multiple zones insi<strong>de</strong> a spherical vessel. Hatched portion<br />
indicates the position of the f<strong>la</strong>me front at an instant of time.<br />
Figure 4.38 shows the flowchart of the adapted Fortran co<strong>de</strong>. The output data of the<br />
co<strong>de</strong> are: the burned gas temperature, f<strong>la</strong>me radius and f<strong>la</strong>me speed, pressure, as well<br />
as the wall thermal flux. At the end of <strong>combustion</strong>, an energy ba<strong>la</strong>nce is ma<strong>de</strong>.<br />
127


