chapter 3 - RiuNet
chapter 3 - RiuNet
chapter 3 - RiuNet

You also want an ePaper? Increase the reach of your titles
YUMPU automatically turns print PDFs into web optimized ePapers that Google loves.
ROLE OF IONS IN THE SPERM ACTIVATION<br />
were less than 0.05 % in all the cases, and therefore a DMSO effect on<br />
motility could be discarded.<br />
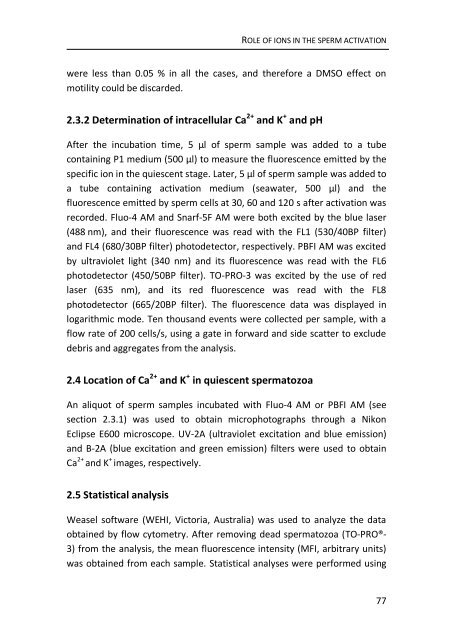
2.3.2 Determination of intracellular Ca 2+ and K + and pH<br />
After the incubation time, 5 µl of sperm sample was added to a tube<br />
containing P1 medium (500 µl) to measure the fluorescence emitted by the<br />
specific ion in the quiescent stage. Later, 5 µl of sperm sample was added to<br />
a tube containing activation medium (seawater, 500 µl) and the<br />
fluorescence emitted by sperm cells at 30, 60 and 120 s after activation was<br />
recorded. Fluo-4 AM and Snarf-5F AM were both excited by the blue laser<br />
(488 nm), and their fluorescence was read with the FL1 (530/40BP filter)<br />
and FL4 (680/30BP filter) photodetector, respectively. PBFI AM was excited<br />
by ultraviolet light (340 nm) and its fluorescence was read with the FL6<br />
photodetector (450/50BP filter). TO-PRO-3 was excited by the use of red<br />
laser (635 nm), and its red fluorescence was read with the FL8<br />
photodetector (665/20BP filter). The fluorescence data was displayed in<br />
logarithmic mode. Ten thousand events were collected per sample, with a<br />
flow rate of 200 cells/s, using a gate in forward and side scatter to exclude<br />
debris and aggregates from the analysis.<br />
2.4 Location of Ca 2+ and K + in quiescent spermatozoa<br />
An aliquot of sperm samples incubated with Fluo-4 AM or PBFI AM (see<br />
section 2.3.1) was used to obtain microphotographs through a Nikon<br />
Eclipse E600 microscope. UV-2A (ultraviolet excitation and blue emission)<br />
and B-2A (blue excitation and green emission) filters were used to obtain<br />
Ca 2+ and K + images, respectively.<br />
2.5 Statistical analysis<br />
Weasel software (WEHI, Victoria, Australia) was used to analyze the data<br />
obtained by flow cytometry. After removing dead spermatozoa (TO-PRO®-<br />
3) from the analysis, the mean fluorescence intensity (MFI, arbitrary units)<br />
was obtained from each sample. Statistical analyses were performed using<br />
77