ultrasound measurements of perirenal fat thickness to estimate the ...
ultrasound measurements of perirenal fat thickness to estimate the ...
ultrasound measurements of perirenal fat thickness to estimate the ...

Create successful ePaper yourself
Turn your PDF publications into a flip-book with our unique Google optimized e-Paper software.
W ORLD<br />
R ABBIT<br />
SCIENCE<br />
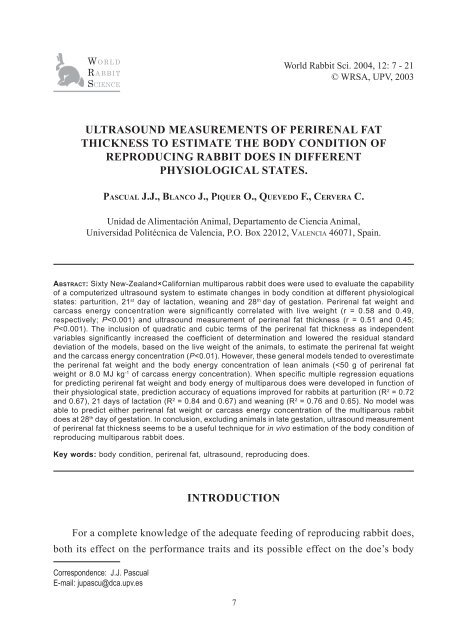
World Rabbit Sci. 2004, 12: 7 - 21<br />
© WRSA, UPV, 2003<br />
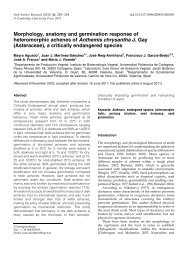
ULTRASOUND MEASUREMENTS OF PERIRENAL FAT<br />
THICKNESS TO ESTIMATE THE BODY CONDITION OF<br />
REPRODUCING RABBIT DOES IN DIFFERENT<br />
PHYSIOLOGICAL STATES.<br />
PASCUAL J.J., BLANCO J., PIQUER O., QUEVEDO F., CERVERA C.<br />
Unidad de Alimentación Animal, Departamen<strong>to</strong> de Ciencia Animal,<br />
Universidad Politécnica de Valencia, P.O. Box 22012, VALENCIA 46071, Spain.<br />
ABSTRACT: Sixty New-Zealand×Californian multiparous rabbit does were used <strong>to</strong> evaluate <strong>the</strong> capability<br />
<strong>of</strong> a computerized <strong>ultrasound</strong> system <strong>to</strong> <strong>estimate</strong> changes in body condition at different physiological<br />
states: parturition, 21 st day <strong>of</strong> lactation, weaning and 28 th day <strong>of</strong> gestation. Perirenal <strong>fat</strong> weight and<br />
carcass energy concentration were significantly correlated with live weight (r = 0.58 and 0.49,<br />
respectively; P
PASCUAL et al.<br />
condition must be considered, <strong>the</strong> latter affecting <strong>the</strong> future reproductive<br />
performance. Variables <strong>to</strong> evaluate <strong>the</strong> productivity <strong>of</strong> reproducing rabbit does are<br />
clearly defined and harmonized. However, <strong>the</strong> body condition <strong>of</strong> <strong>the</strong> animals is<br />
usually controlled by unsuitable records (e.g. following <strong>the</strong>ir live weight change) or<br />
by destructive techniques (e.g. comparative slaughter). These methods are insufficient<br />
<strong>to</strong> properly evaluate body condition evolution and study <strong>the</strong> body condition effect<br />
on <strong>the</strong> future performance <strong>of</strong> <strong>the</strong> animals.<br />
In recent years, some authors have developed several in vivo methods <strong>of</strong><br />
determining <strong>the</strong> whole body composition <strong>of</strong> rabbits: X-ray computer <strong>to</strong>mography<br />
(SZENDRÕ et al., 1992), magnetic resonance imaging <strong>to</strong>mography (KÖVER et al., 1996)<br />
and <strong>ultrasound</strong> <strong>measurements</strong> <strong>of</strong> <strong>the</strong> <strong>perirenal</strong> <strong>fat</strong> <strong>thickness</strong> (PASCUAL et al., 2000).<br />
These non-invasive and non-destructive methods allow study <strong>of</strong> <strong>the</strong> in vivo body<br />
composition changes <strong>of</strong> particular animals over time. However, some <strong>of</strong> <strong>the</strong>se<br />
techniques still have a low accuracy or are based on <strong>the</strong> use <strong>of</strong> medical equipment<br />
for humans, which is usually very expensive, located in health centres and turns out<br />
<strong>to</strong> be not very practical in spite <strong>of</strong> its high precision.<br />
In rabbits, <strong>the</strong> best predic<strong>to</strong>r <strong>of</strong> mobilization <strong>of</strong> body reserves is <strong>the</strong> change in<br />
<strong>fat</strong> deposit weight, especially <strong>perirenal</strong> <strong>fat</strong> (OUHAYOUN, 1978; BRUN and OUHAYOUN,<br />
1988; MASOERO et al., 1992). PASCUAL et al. (2000) developed an accurate and precise<br />
in vivo routine <strong>to</strong> <strong>estimate</strong> <strong>the</strong> body condition <strong>of</strong> <strong>the</strong> young reproducing does based<br />
on <strong>the</strong>ir <strong>perirenal</strong> <strong>fat</strong> <strong>thickness</strong> (PFT) measured by a portable <strong>ultrasound</strong> equipment.<br />
PFT <strong>measurements</strong> had been confirmed as a very useful technique <strong>to</strong> evaluate <strong>the</strong><br />
body condition changes in primiparous rabbit does (PASCUAL et al., 2002). However,<br />
<strong>the</strong> information about <strong>the</strong> practical use <strong>of</strong> this technique in multiparous rabbits is<br />
scarce and <strong>the</strong>re is no information about <strong>the</strong> possible effect <strong>of</strong> <strong>the</strong> physiological<br />
state <strong>of</strong> <strong>the</strong> females on <strong>the</strong> precision and accuracy <strong>of</strong> <strong>the</strong> method, which are crucial<br />
for evolution studies.<br />
Consequently, <strong>the</strong> aim <strong>of</strong> <strong>the</strong> present work was <strong>to</strong> evaluate <strong>the</strong> ability <strong>of</strong><br />
computerized <strong>ultrasound</strong> techniques <strong>to</strong> <strong>estimate</strong> <strong>the</strong> body condition <strong>of</strong> multiparous<br />
8
ULTRASOUND MEASUREMENTS OF PERIRENAL FAT THICKNESS<br />
rabbit does in different physiological states (parturition, lactation, weaning and late<br />
gestation) using currently available portable <strong>ultrasound</strong> equipment.<br />
MATERIALS AND METHODS<br />
Animals<br />
Sixty New-Zealand × Californian multiparous rabbit does from <strong>the</strong> experimental<br />
farm <strong>of</strong> <strong>the</strong> Universidad Politécnica de Valencia were used <strong>to</strong> evaluate <strong>the</strong> use <strong>of</strong> a<br />
computerized <strong>ultrasound</strong> system for estimating changes in body condition in different<br />
physiological states. Until control day, animals were fed ad libitum a standard<br />
commercial diet for rabbit does, in accordance with recent recommendations (DE<br />
BLAS and MATEOS, 1998), and were inseminated 11 days after parturition. Animals<br />
were classified in four groups in function <strong>of</strong> <strong>the</strong>ir physiological state: Parturition<br />
group (PG), constituted by 15 females at <strong>the</strong> 1 st day after parturition (mean live<br />
weight ± standard deviation: 4312 ± 444 g); Lactation group (LG), constituted by<br />
15 females at <strong>the</strong> 21 st day <strong>of</strong> lactation (4390 ± 163 g); Weaning group (WG),<br />
constituted by 15 females at 28 th day <strong>of</strong> lactation (4673 ± 512 g); Gestation group<br />
(GG), constituted by 15 females at 28 th day <strong>of</strong> gestation (4912 ± 335 g). Seven does<br />
<strong>of</strong> <strong>the</strong> WG were pregnant and 8 were non-pregnant at weaning date. Eight does <strong>of</strong><br />
gestation group were inseminated during lactation (11 day) and 7 were after weaning.<br />
Ultrasound <strong>measurements</strong><br />
Images were obtained with an <strong>ultrasound</strong> unit (JUSTVISION 200 “SSA-320A” realtime<br />
<strong>ultrasound</strong> machine; Toshiba), equipped with an electronic micro-convex<br />
transducer <strong>of</strong> multi-frequency (5.0, 6.0 and 7.0 –MHz; PVG-681S). PFT measures<br />
were directly obtained using <strong>the</strong> s<strong>of</strong>tware <strong>of</strong> <strong>the</strong> <strong>ultrasound</strong> unit.<br />
Thirty minutes before slaughter, fur was removed around <strong>the</strong> 8 th and 9 th thoracic<br />
vertebrae by shearing, <strong>to</strong> improve image retrieval and as recommended by PASCUAL<br />
et al. (2000). Animals were situated in a box (150 × 370 mm.) during <strong>ultrasound</strong><br />
measurement <strong>to</strong> improve image quality. Scanning sites for PFT <strong>measurements</strong> were<br />
9
PASCUAL et al.<br />
located by physical palpation at 8 th <strong>to</strong> 9 th thoracic vertebrae, and <strong>measurements</strong> were<br />
made on both sides <strong>of</strong> <strong>the</strong> back 3 cm from <strong>the</strong> vertebral column: right (RPFT) and<br />
left (LPFT). Ultrasound gel (Eko Gel) was applied <strong>to</strong> <strong>the</strong> scanning sites. The<br />
transducer was always placed in <strong>the</strong> same position <strong>to</strong> obtain a transversal section <strong>of</strong><br />
<strong>perirenal</strong> <strong>fat</strong>. The same technician did all scanning and interpretation <strong>of</strong> scans.<br />
Carcass <strong>measurements</strong> and analytical procedures<br />
After <strong>ultrasound</strong> measurement, all 60 rabbit does were weighed (live weight;<br />
LW) and slaughtered by sodium pen<strong>to</strong>barbital injection (250 mg per animal). Carcass<br />
<strong>measurements</strong> were made according <strong>to</strong> <strong>the</strong> criteria <strong>of</strong> BLASCO and OUHAYOUN (1996)<br />
and <strong>to</strong> a comparative slaughter technique (PARIGI BINI et al., 1992). The gut and<br />
bladder were emptied and returned <strong>to</strong> empty bodies. After 24 h <strong>of</strong> cooling, <strong>perirenal</strong><br />
<strong>fat</strong> weight (PFW) was recorded. The whole empty body was <strong>the</strong>n minced through a<br />
cutter-mincer <strong>to</strong> produce a homogeneous sample suitable for chemical analysis.<br />
The carcass protein and <strong>fat</strong> concentrations (CPC and CFC, respectively) <strong>of</strong> <strong>the</strong><br />
samples from <strong>the</strong> empty bodies <strong>of</strong> <strong>the</strong> does were determined using <strong>the</strong> method <strong>of</strong> <strong>the</strong><br />
ASSOCIATION OF OFFICIAL ANALYTICAL CHEMISTS (1991), while <strong>the</strong> carcass energy<br />
concentration (CEC) was determined by adiabatic bomb calorimeter.<br />
Statistical analysis<br />
Data were initially evaluated using <strong>the</strong> Pearson correlation coefficient (r;<br />
procedure PROC CORR). A regression method was used <strong>to</strong> fit <strong>the</strong> least square<br />
<strong>estimate</strong>s <strong>to</strong> <strong>the</strong> multiple polynomial regression model <strong>to</strong> obtain general and specific<br />
regression equations (procedure PROC STEPWISE) <strong>of</strong> <strong>the</strong> SAS (1990). Statistics<br />
from regression analysis included <strong>the</strong> coefficient <strong>of</strong> determination (R 2 ) and <strong>the</strong><br />
residual standard deviation (RSD). Independent variables were measured from <strong>the</strong><br />
carcass <strong>ultrasound</strong> images with <strong>the</strong> exception <strong>of</strong> LW at slaughter. Carcass<br />
<strong>measurements</strong> were used as dependent variables.<br />
10
ULTRASOUND MEASUREMENTS OF PERIRENAL FAT THICKNESS<br />
RESULTS AND DISCUSSION<br />
Means, standard deviation, coefficient <strong>of</strong> variation (CV), and minimum and<br />
maximum values <strong>of</strong> live weight, carcass and <strong>ultrasound</strong> <strong>measurements</strong> are presented<br />
in Table 1. There was a large variation on PFW, CFC and CEC (CV= 55, 35 and<br />
15%, respectively) <strong>of</strong> does used in <strong>the</strong> present work, indicating <strong>the</strong> suitability <strong>of</strong> <strong>the</strong><br />
population for <strong>the</strong> study <strong>of</strong> <strong>the</strong> <strong>ultrasound</strong> technique accuracy. Ultrasound PFT<br />
variables also showed a wide range (CV = 15 <strong>to</strong> 17%), as a result <strong>of</strong> <strong>perirenal</strong> <strong>fat</strong><br />
weight variations. These results were similar <strong>to</strong> those obtained by PASCUAL et al.<br />
(2000) for LW and <strong>estimate</strong>d CEC (CV = 10.7 and 15.6%; respectively), but<br />
variability was higher in this previous work for PFW and PFT (CV = 63.2 and 21.5%,<br />
respectively) because <strong>of</strong> <strong>the</strong> animals were subjected <strong>to</strong> different food restriction<br />
programs <strong>to</strong> increase variability.<br />
Table 1: Means, standard deviations and coefficients <strong>of</strong> variation for carcass and <strong>ultrasound</strong><br />
<strong>measurements</strong>.<br />
Variable Description Mean Minimum Maximum SD CV×100<br />
All rabbits (n=60)<br />
LW Live weight at slaughter (g) 4569 3510 5555 437 9.6<br />
PFW Perirenal <strong>fat</strong> weight (g) 68.37 2.60 155.00 37.76 55.2<br />
CPC Carcass protein content (g/kg) 196.7 144.4 233.2 19.8 10.1<br />
CFC Carcass <strong>fat</strong> content (g/kg) 110.0 41.5 218.6 38.2 34.8<br />
CEC Carcass energy content (MJ/kg) 9.09 6.12 12.55 1.37 15.1<br />
RPFT<br />
LPFT<br />
PFT 1<br />
Ultrasound right <strong>perirenal</strong> <strong>fat</strong><br />
<strong>thickness</strong> (mm) 8.29 5.20 11.50 1.39 16.8<br />
Ultrasound left <strong>perirenal</strong> <strong>fat</strong> <strong>thickness</strong><br />
(mm) 8.09 4.60 11.30 1.37 16.9<br />
Ultrasound mean <strong>perirenal</strong> <strong>fat</strong><br />
<strong>thickness</strong> (mm) 8.31 4.90 11.50 1.37 16.5<br />
11
PASCUAL et al.<br />
(Continue from Table 1)<br />
Variable Description Mean Minimum Maximum SD CV×100<br />
Rabbits at parturition (n=15)<br />
LW Live weight at slaughter (g) 4296 3510 4905 432 10.0<br />
PFW Perirenal <strong>fat</strong> weight (g) 66.32 10.00 132.50 35.00 52.8<br />
CPC Carcass protein content (g/kg) 191.6 164.0 228.6 18.5 9.7<br />
CFC Carcass <strong>fat</strong> content (g/kg) 124.8 45.5 218.6 48.1 38.5<br />
CEC Carcass energy content (MJ/kg) 8.92 6.82 10.50 1.14 12.8<br />
RPFT<br />
LPFT<br />
PFT 1<br />
Ultrasound right <strong>perirenal</strong> <strong>fat</strong><br />
<strong>thickness</strong> (mm) 7.33 5.20 9.00 1.15 15.7<br />
Ultrasound left <strong>perirenal</strong> <strong>fat</strong> <strong>thickness</strong><br />
(mm) 7.21 4.60 9.80 1.36 18.9<br />
Ultrasound mean <strong>perirenal</strong> <strong>fat</strong><br />
<strong>thickness</strong> (mm) 7.53 4.90 10.00 1.43 18.9<br />
Rabbits at 21 days <strong>of</strong> lactation (n=15)<br />
LW Live weight at slaughter (g) 4399 4145 4650 161 3.65<br />
PFW Perirenal <strong>fat</strong> weight (g) 53.37 16.40 134.00 30.92 57.9<br />
CPC Carcass protein content (g/kg) 199.7 169.0 233.2 20.9 10.5<br />
CFC Carcass <strong>fat</strong> content (g/kg) 94.1 41.5 144.5 28.8 30.6<br />
CEC Carcass energy content (MJ/kg) 8.84 6.12 11.33 1.27 14.3<br />
RPFT<br />
LPFT<br />
PFT 1<br />
Ultrasound right <strong>perirenal</strong> <strong>fat</strong><br />
<strong>thickness</strong> (mm) 8.14 6.90 9.20 0.70 8.57<br />
Ultrasound left <strong>perirenal</strong> <strong>fat</strong> <strong>thickness</strong><br />
(mm) 8.03 6.70 9.50 0.85 10.6<br />
Ultrasound mean <strong>perirenal</strong> <strong>fat</strong><br />
<strong>thickness</strong> (mm) 8.36 6.90 10.60 0.94 11.2<br />
12
ULTRASOUND MEASUREMENTS OF PERIRENAL FAT THICKNESS<br />
(Contiunue from Table 1)<br />
Variable Description Mean Minimum Maximum SD CV×100<br />
Rabbits at weaning (n=15)<br />
LW Live weight at slaughter (g) 4673 3865 5555 493 10.6<br />
PFW Perirenal <strong>fat</strong> weight (g) 74.33 2.60 143.20 39.88 53.7<br />
CPC Carcass protein content (g/kg) 198.6 164.5 228.6 18.80 9.5<br />
CFC Carcass <strong>fat</strong> content (g/kg) 100.5 41.5 153.8 32.7 32.5<br />
CEC Carcass energy content (MJ/kg) 9.28 6.45 11.54 1.49 16.0<br />
RPFT<br />
LPFT<br />
PFT 1<br />
Ultrasound right <strong>perirenal</strong> <strong>fat</strong><br />
<strong>thickness</strong> (mm) 9.07 7.00 11.50 1.56 17.2<br />
Ultrasound left <strong>perirenal</strong> <strong>fat</strong> <strong>thickness</strong><br />
(mm) 8.65 6.30 11.30 1.52 17.6<br />
Ultrasound mean <strong>perirenal</strong> <strong>fat</strong><br />
<strong>thickness</strong> (mm) 8.74 6.85 11.50 1.50 17.2<br />
Rabbits at 28 days <strong>of</strong> gestation (n=15)<br />
LW Live weight at slaughter (g) 4908 3975 5295 323 6.59<br />
PFW Perirenal <strong>fat</strong> weight (g) 79.45 25.70 155.0 42.70 53.7<br />
CPC Carcass protein content (g/kg) 197.0 144.4 224.7 21.8 11.1<br />
CFC Carcass <strong>fat</strong> content (g/kg) 120.5 58.6 195.7 35.1 29.1<br />
CEC Carcass energy content (MJ/kg) 9.31 7.28 12.55 1.64 17.6<br />
RPFT<br />
LPFT<br />
PFT 1<br />
Ultrasound right <strong>perirenal</strong> <strong>fat</strong><br />
<strong>thickness</strong> (mm) 8.63 5.40 11.20 1.45 16.8<br />
Ultrasound left <strong>perirenal</strong> <strong>fat</strong> <strong>thickness</strong><br />
(mm) 8.48 4.60 9.90 1.30 15.3<br />
Ultrasound mean <strong>perirenal</strong> <strong>fat</strong><br />
<strong>thickness</strong> (mm) 8.59 5.00 10.40 1.34 15.6<br />
1<br />
Mean <strong>of</strong> right and left <strong>measurements</strong>. SD: standard deviation, CV: coefficient <strong>of</strong> variation.<br />
13
PASCUAL et al.<br />
Examining <strong>the</strong> relationships between pairs <strong>of</strong> variables is <strong>of</strong>ten useful in<br />
establishing <strong>the</strong> basis for a multiple regression model. Therefore, simple correlation<br />
coefficients between LW, carcass and <strong>ultrasound</strong> <strong>measurements</strong> are given in Table<br />
2. As might be expected, LW was significantly correlated with PFW and CEC (r =<br />
0.580 and 0.490, respectively; P
ULTRASOUND MEASUREMENTS OF PERIRENAL FAT THICKNESS<br />
Table 3: Multiple regression equations based on live weight (LW, g) and <strong>ultrasound</strong><br />
<strong>measurements</strong> (PFT, mm) for predicting <strong>perirenal</strong> <strong>fat</strong> weight (PFW, g) and carcass energy<br />
concentration (CEC, MJ/kg) in reproducing rabbit does (n=60).<br />
Dependent variable Eq. Intercept<br />
b value<br />
LW PFT 2 PFT 3<br />
RSD R 2<br />
PFW<br />
1 -161*** 0.0498*** 31.0 0.34<br />
2 -151*** 0.0392*** 0.567** 28.8 0.44<br />
CEC<br />
3 2.04*** 0.0015*** 1.21 0.24<br />
4 2.08*** 0.0012** 0.0015** 1.15 0.33<br />
RSD: residual standard deviation<br />
** P
PASCUAL et al.<br />
Figure 1: Relationship between residuals after predicting value from general equations (Eq. 2 and<br />
4) based on <strong>perirenal</strong> <strong>fat</strong> <strong>thickness</strong> and actual <strong>perirenal</strong> <strong>fat</strong> weight or carcass energy concentration<br />
<strong>of</strong> <strong>the</strong> reproducing rabbit does (n = 60).<br />
From <strong>the</strong>se results, specific multiple regression equations for predicting PFW<br />
and CEC <strong>of</strong> multiparous does were developed according <strong>to</strong> <strong>the</strong>ir physiological state<br />
(Table 4). The prediction <strong>of</strong> PFW and CEC <strong>of</strong> animals were clearly improved when<br />
specific equations for parturition (R 2 = 0.72 and 0.67 for Eq. 6 and 8 respectively),<br />
21 days <strong>of</strong> lactation (R 2 = 0.84 and 0.67 for Eq. 10 and 12) and weaning time (R 2 =<br />
0.76 and 0.65 for Eq. 14 and 16) were developed. However, RSD values obtained<br />
for PFW prediction remained in some cases very high (20 g), although in o<strong>the</strong>r<br />
cases <strong>the</strong>y were similar <strong>to</strong> those obtained by PASCUAL et al. (2000) for PFW (10.2 <strong>to</strong><br />
16.5 g) and <strong>estimate</strong>d CEC prediction (0.48 <strong>to</strong> 0.63 MJ/kg). No model was able <strong>to</strong><br />
predict PFW or CEC <strong>of</strong> <strong>the</strong> does at 28th day <strong>of</strong> gestation.<br />
As shown in Figure 2, PFW values <strong>of</strong> <strong>the</strong> animals at parturition, at 21st day <strong>of</strong><br />
lactation and at weaning had more or less a linear distribution according <strong>to</strong> <strong>the</strong>ir<br />
<strong>ultrasound</strong> PFT. On <strong>the</strong> o<strong>the</strong>r hand, PFW values from <strong>the</strong> animals controlled at 28 th<br />
day <strong>of</strong> gestation were not correlated with PFT values, showing a random distribution.<br />
This result is difficult <strong>to</strong> explain from <strong>the</strong> literature, but a hypo<strong>the</strong>sis could be <strong>the</strong><br />
less homogeneous distribution <strong>of</strong> <strong>the</strong> <strong>perirenal</strong> <strong>fat</strong> <strong>of</strong> reproducing does during late<br />
gestation as a consequence <strong>of</strong> <strong>the</strong> abdominal occupation by <strong>the</strong> foetuses. This fact<br />
16
ULTRASOUND MEASUREMENTS OF PERIRENAL FAT THICKNESS<br />
Table 4: Specific multiple regression equations based on live weight (LW, g) and <strong>ultrasound</strong> <strong>measurements</strong> (PFT, mm) for predicting <strong>perirenal</strong><br />
<strong>fat</strong> weight (PFW, g) and carcass energy content (MJ/kg) in reproducing rabbit does in relation <strong>to</strong> <strong>the</strong>ir physiological state (n=15).<br />
Physiological state 1 Eq.<br />
Independen<br />
variable<br />
Intercept<br />
b value<br />
LW PFT 3 LnPFT ePFT<br />
RSD R 2<br />
Parturition 5 PFW -171** 0.0550** 26.5 0.47<br />
6 -320*** 0.0484** 89.2** 20.07 0.72<br />
7 CEC 0.293 0.0020** 0.768 0.60<br />
8 -2.58 0.0018** 1.83* 0.733 0.67<br />
21 d lactation 9 PFW -162 0.0491 31.0 0.07<br />
10 -19.7 0.1264*** 12.5 0.84<br />
11 CEC 2.02 0.0016 1.07 0.057<br />
12 6.76*** 0.0038*** 0.668 0.67<br />
Weaning 13 PFW -209** 0.0609** 27.3 0.57<br />
14 -174** 0.0510** 5.79·10-4** 21.3 0.76<br />
15 CEC 1.25 0.0017* 1.27 0.33<br />
16 -6.24* 7.20*** 0.912 0.65<br />
General (n 45)<br />
17 PFW -132** 0.0367* 0.0556*** 17.8 0.68<br />
18 CEC 2.51 0.0012* 0.0018*** 0.810 0.59<br />
1<br />
Physiological state <strong>of</strong> <strong>the</strong> reproducing does at slaughter. Any model was adjusted <strong>to</strong> 28 days <strong>of</strong> gestation data. RSD: residual standard deviation.<br />
*P
PASCUAL et al.<br />
could reduce <strong>the</strong> correlation between <strong>the</strong> PFT measured at 8-9 th thoracic vertebrae<br />
and <strong>the</strong> <strong>to</strong>tal size <strong>of</strong> <strong>the</strong> <strong>perirenal</strong> <strong>fat</strong> deposits (main principle <strong>of</strong> this technique).<br />
This effect was not observed for animals at 17 th day <strong>of</strong> gestation (gestating does in<br />
weaning group), showing a similar fit <strong>to</strong> <strong>the</strong> equation than non-pregnant does.<br />
When general equations were developed without data concerning <strong>the</strong> animals<br />
at 28th day <strong>of</strong> gestation, practice models were obtained with relatively high accuracy<br />
both for PFW (RSD = 17.8 g and R 2 = 0.68 for Eq. 17) and for CEC prediction (RSD<br />
= 0.76 MJ/kg and R 2 = 0.59 for Eq. 18), independently <strong>of</strong> <strong>the</strong> physiological state <strong>of</strong><br />
<strong>the</strong> does.<br />
Figure 2: Relationship (linear regression) between <strong>the</strong> <strong>perirenal</strong> <strong>fat</strong> <strong>thickness</strong> and <strong>the</strong> <strong>perirenal</strong> <strong>fat</strong><br />
weight <strong>of</strong> reproducing does at different physiological states (n =15).<br />
18
ULTRASOUND MEASUREMENTS OF PERIRENAL FAT THICKNESS<br />
Avoiding late gestation, <strong>ultrasound</strong> measurement <strong>of</strong> PFT seemed <strong>to</strong> give a better<br />
<strong>estimate</strong> <strong>of</strong> <strong>the</strong> body condition <strong>of</strong> multiparous rabbit does. In fact, <strong>the</strong> residuals for<br />
PFW and CEC <strong>of</strong> does were homogeneously distributed when specific models in<br />
function <strong>of</strong> <strong>the</strong> physiological state were used (Figure 3). However, a slight tendency<br />
<strong>to</strong> over<strong>estimate</strong> <strong>the</strong> PFW and <strong>the</strong> CEC <strong>of</strong> <strong>the</strong> animals with less than 50 g <strong>of</strong> PFW or<br />
8 MJ/kg <strong>of</strong> CEC was maintained. KÖVER et al. (1998) and PASCUAL et al. (2000) also<br />
observed a lower precision in <strong>the</strong> prediction <strong>of</strong> low <strong>fat</strong> weight <strong>measurements</strong><br />
attributed <strong>to</strong> <strong>the</strong>ir greater relative error. On <strong>the</strong> o<strong>the</strong>r hand, a slight underestimation<br />
<strong>of</strong> <strong>the</strong> PFW was still observed for <strong>the</strong> animals with more than 120 g <strong>of</strong> PFW, perhaps<br />
related <strong>to</strong> <strong>the</strong> diffuse nature <strong>of</strong> <strong>the</strong> <strong>perirenal</strong> <strong>fat</strong> depots, especially on high <strong>fat</strong> animals.<br />
In conclusion, <strong>ultrasound</strong> measurement <strong>of</strong> <strong>the</strong> <strong>perirenal</strong> <strong>fat</strong> <strong>thickness</strong> <strong>of</strong><br />
multiparous rabbit does seems <strong>to</strong> be an useful technique for <strong>the</strong> routine in vivo<br />
evaluation <strong>of</strong> <strong>the</strong>ir body condition. The precision <strong>of</strong> <strong>the</strong> prediction clearly improved<br />
when specific models in function <strong>of</strong> <strong>the</strong> physiological state <strong>of</strong> <strong>the</strong> animals were<br />
used, but <strong>the</strong> body condition cannot be <strong>estimate</strong>d by this technique on rabbit does in<br />
late gestation.<br />
Figure 3: Relationship between residuals after predicting value from <strong>the</strong> specific equations based<br />
on <strong>perirenal</strong> <strong>fat</strong> <strong>thickness</strong> (• weaning, 21 day <strong>of</strong> lactation and parturition) and actual <strong>perirenal</strong><br />
<strong>fat</strong> weight (Eq. 6, 10 and 14) or carcass energy concentration (Eq. 8, 12 and 16) <strong>of</strong> <strong>the</strong> reproducing<br />
rabbit does (n= 15).<br />
19
PASCUAL et al.<br />
Acknowledgements: The present work was supported by a grant from <strong>the</strong> Ministry <strong>of</strong> Science and Technology<br />
(AGL2000-0595-C03-03).<br />
REFERENCES<br />
ASSOCIATION OF OFFICIAL ANALYTICAL CHEMISTS. 1991. Official methods <strong>of</strong> analysis<br />
<strong>of</strong> <strong>the</strong> Association <strong>of</strong> Official Analytical Chemists, 16th edition. Association <strong>of</strong><br />
Official Analytical Chemists, Washing<strong>to</strong>n, DC.<br />
BLASCO A., OUHAYOUN J., 1996. Harmonization <strong>of</strong> criteria and terminology in rabbit<br />
meat research. Revised proposal. World Rabbit Sci., 4, 93-98.<br />
BRUN, J.M., OUHAYOUN, J. 1988. Growth performance and carcass traits in three<br />
strains <strong>of</strong> rabbits and <strong>the</strong>ir two-way crosses. Proceedings 4 th World Rabbit<br />
Congress, Budapest, 2: 168-176.<br />
DE BLAS, C., MATEOS, G.G. 1998. Feed formulation. In: The nutrition <strong>of</strong> <strong>the</strong> rabbit.<br />
Ed. C. de Blas and J. Wiseman, CABI Publishing, 241-254.<br />
KÖVER, GY., SØRENSEN, P., SZENDRÕ, ZS., MILISITS, G. 1996. In vivo measurement <strong>of</strong><br />
<strong>perirenal</strong> <strong>fat</strong> by magnetic resonance <strong>to</strong>mography. Proceedings 6th World Rabbit<br />
Congress, Toulouse. Vol. 3: 191-194.<br />
KÖVER, GY., SZENDRÕ, ZS. ROMVÁRI, R., JENSEN, J.F., SØRENSEN, P., MILISITS, G. 1998.<br />
In vivo measurement <strong>of</strong> body parts and <strong>fat</strong> deposition in rabbits by MRI. World<br />
Rabbit Science, 6: 191-194.<br />
MASOERO, G., BERGOGLIO, G., RICCIONI, L., DESTEFANIS G., BARGE, M.T. 1992. Near<br />
Infrared Spectroscopy applied <strong>to</strong> living rabbits <strong>to</strong> <strong>estimate</strong> body composition<br />
and carcass and meat traits. A calibration study. Journal <strong>of</strong> Applied Rabbit<br />
Research, 15: 810-818.<br />
OUHAYOUN, J., 1978. [Comparative analysis <strong>of</strong> rabbit strains differing in adult weight].<br />
Doc<strong>to</strong>ral Thesis, Academie de Montpellier.<br />
PARIGI BINI, R., XICCATO, G., CINETTO, M., DALLE-ZOTTE A. 1992. Energy and protein<br />
utilization and partition in rabbit does concurrently pregnant and lactation.<br />
Animal Production, 55:153-162.<br />
PARTRIDGE, G.C., FULLER, M.F., PULLAR, J.D. 1983. Energy and nitrogen metabolism<br />
<strong>of</strong> lactating rabbits. British Journal <strong>of</strong> Nutrition, 49: 507-516.<br />
PASCUAL J.J., CERVERA C., FERNÁNDEZ-CARMONA J. 1999. The effect <strong>of</strong> dietary <strong>fat</strong> on<br />
<strong>the</strong> performance and body composition <strong>of</strong> rabbit in <strong>the</strong> second lactation. Animal<br />
Feed Science and Technology, 86:191-203.<br />
PASCUAL J.J., CASTELLA F., CERVERA C., BLAS E., FERNÁNDEZ-CARMONA J. 2000. The<br />
use <strong>of</strong> <strong>ultrasound</strong> measurement <strong>of</strong> <strong>perirenal</strong> <strong>fat</strong> <strong>thickness</strong> <strong>to</strong> <strong>estimate</strong> changes<br />
in body condition <strong>of</strong> young female rabbits. Animal Science, 70:435-442.<br />
PASCUAL J.J., MOTTA W., CERVERA C., QUEVEDO F., BLAS E., FERNÁNDEZ-CARMONA J.<br />
2002. Effect <strong>of</strong> dietary energy source on <strong>the</strong> performance and <strong>perirenal</strong> <strong>fat</strong><br />
<strong>thickness</strong> evolution <strong>of</strong> primiparous rabbit does. Animal Science, 75: 267-273.<br />
SAS. 1990. User’s guide: statistics. Statistical Analysis Systems Institute Inc., Cary,<br />
NC.<br />
20
ULTRASOUND MEASUREMENTS OF PERIRENAL FAT THICKNESS<br />
SZENDRÕ ZS., HORN P., KÖVÉR GY., BERÉNYI E., RADNAI I., BÍRÓ-NÉMETH E. 1992. In<br />
vivo measurement <strong>of</strong> <strong>the</strong> carcass traits <strong>of</strong> meat type rabbits by X-ray computerised<br />
<strong>to</strong>mography. Journal <strong>of</strong> Applied Rabbit Research, 15: 799-809.<br />
21