- Page 1 and 2:
INVESTIGATIONS INTO HYPERLIPIDEMIA
- Page 3 and 4:
INVESTIGATIONS INTO HYPERLIPIDEMIA
- Page 5 and 6:
iv was found to be useful for the s
- Page 7 and 8:
vi ACKNOWLEDGEMENTS I would like to
- Page 9 and 10:
viii TABLE OF CONTENTS Page ABSTRAC
- Page 11 and 12:
x LIST OF FIGURES FIGURE Page 1 Cor
- Page 13 and 14:
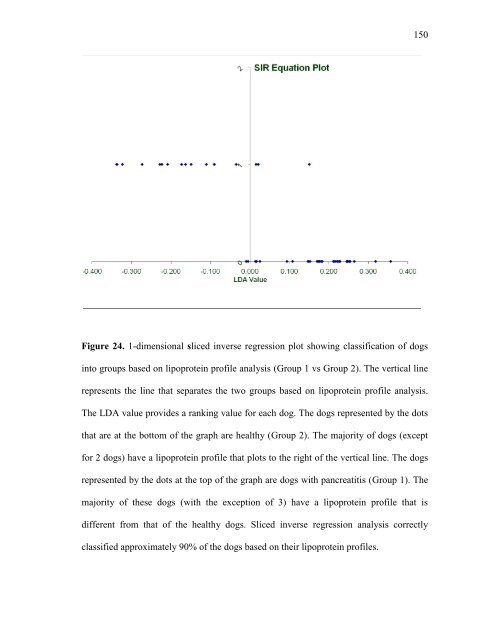
xii FIGURE Page 20 1-dimensional sl
- Page 15 and 16:
2 the results of these initial stud
- Page 17 and 18:
4 and HDL 1 concentrations and a de
- Page 19 and 20:
6 and, in smaller concentrations, L
- Page 21 and 22:
8 HDL molecules can be further subd
- Page 23 and 24:
10 reach the vasculature, they acqu
- Page 25 and 26:
12 Endocrine disease Most commonly,
- Page 27 and 28:
14 with varying frequencies in dogs
- Page 29 and 30:
16 hypercholesterolemia was found o
- Page 31 and 32:
18 Primary hyperlipidemia with hype
- Page 33 and 34:
20 Atherosclerosis Although dogs ap
- Page 35 and 36:
22 Dietary management Typically, th
- Page 37 and 38:
24 therapy when the latter fails to
- Page 39 and 40:
26 followed from the 1970s until to
- Page 41 and 42:
28 this theory, zymogen granules th
- Page 43 and 44:
30 be quite different, especially i
- Page 45 and 46:
32 Drugs As in humans, drug-induced
- Page 47 and 48:
34 Signalment Dogs of any age, bree
- Page 49 and 50:
36 erroneously direct the clinician
- Page 51 and 52:
38 of changes over time in serum Sp
- Page 53 and 54:
40 they have been shown to have a l
- Page 55 and 56:
42 revealed either a normal pancrea
- Page 57 and 58:
44 At present, a definitive diagnos
- Page 59 and 60:
46 factors should always be investi
- Page 61 and 62:
48 associated pancreatitis is much
- Page 63 and 64:
50 clear whether hyperlipidemia was
- Page 65 and 66:
52 hepatobiliary disease in both Mi
- Page 67 and 68:
54 the reference range, while Group
- Page 69 and 70:
56 ROC analysis and calculation of
- Page 71 and 72:
58 Figure 3. Serum cPLI concentrati
- Page 73 and 74:
60 There was no significant differe
- Page 75 and 76:
62 severe (typically ≥1,000 mg/dl
- Page 77 and 78:
64 gastrointestinal signs or suspec
- Page 79 and 80:
66 CHAPTER III SERUM TRIGLYCERIDE C
- Page 81 and 82:
68 logical assumption that a defect
- Page 83 and 84:
70 pancreatitis. For the same reaso
- Page 85 and 86:
72 Spec cPL concentrations were mea
- Page 87 and 88:
74 were significantly more likely t
- Page 89 and 90:
76 Figure 5. Comparison of serum tr
- Page 91 and 92:
78 Figure 7. Comparison of serum tr
- Page 93:
80 pancreatitis as it cannot be pre
- Page 96 and 97:
83 Although serum cholesterol conce
- Page 98 and 99:
85 Footnotes a Spec cPL ® , IDEXX
- Page 100 and 101:
87 several subfractions, with diffe
- Page 102 and 103:
89 Miniature Schnauzers (Group 2) T
- Page 104 and 105:
91 Assays Serum triglyceride (refer
- Page 106 and 107:
93 Figure 8. Custom-built fluoresce
- Page 108 and 109:
95 range HDL 1 has not been accurat
- Page 110 and 111:
97 mg/dL) were significantly higher
- Page 112 and 113: 99 Figure 10: Serum cholesterol con
- Page 114 and 115: 101 (Eigenvalues=0.5455; P=0.00017;
- Page 116 and 117: 103 Figure 12: Representative lipop
- Page 118 and 119: 105 Figures 14A and 14B: Representa
- Page 120 and 121: 107 Specifically, 97% of non-hypert
- Page 122 and 123: 109 The fraction of TRLs was a sign
- Page 124 and 125: 111 Schnauzers without hyperlipidem
- Page 126 and 127: 113 Footnotes a Roche/Hitachi MODUL
- Page 128 and 129: 115 The biochemical, metabolic, and
- Page 130 and 131: 117 Study design Each one of the do
- Page 132 and 133: 119 Questionnaires and consent form
- Page 134 and 135: 121 a target intensity of 30%, and
- Page 136 and 137: 123 might affect lipid metabolism (
- Page 138 and 139: 125 Figure 16. Serum triglyceride c
- Page 140 and 141: 127 Figure 18. Serum Spec cPL conce
- Page 142 and 143: 129 Figure 19. 1-dimensional sliced
- Page 144 and 145: 131 Dogs that did not respond to th
- Page 146 and 147: 133 Hypertriglyceridemia has been l
- Page 148 and 149: 135 degrees. One possible explanati
- Page 150 and 151: 137 Footnotes a Royal Canin Gastroi
- Page 152 and 153: 139 concentrations and lipoprotein
- Page 154 and 155: 141 inclusion criteria for the stud
- Page 156 and 157: 143 light source j , located in a d
- Page 159 and 160: 146 Serum triglyceride and choleste
- Page 161: 148 Figure 22. Serum triglyceride c
- Page 165 and 166: 152 Discussion The purpose of the p
- Page 167 and 168: 154 fraction of these dogs (about 3
- Page 169 and 170: 156 of lipoproteins might also have
- Page 171 and 172: 158 Footnotes a Roche/Hitachi MODUL
- Page 173 and 174: 160 the etiology of pancreatitis, b
- Page 175 and 176: 162 times (P=0.0343) for a serum cP
- Page 177 and 178: 164 peaks than dogs of other breeds
- Page 179 and 180: 166 19.3; 95% CI, 2.0-184.0; P=0.00
- Page 181 and 182: 168 4) Specific lipoprotein classes
- Page 183 and 184: 170 REFERENCES 1949;8:96-97. 1. Lew
- Page 185 and 186: 172 17. Whitney MS, Boon GD, Rebar
- Page 187 and 188: 174 33. Ford RB. Clinical managemen
- Page 189 and 190: 176 50. Nelson RW, Turnwald GH, Wil
- Page 191 and 192: 178 66. Williams DA, Steiner JM. Ca
- Page 193 and 194: 180 82. Yilmaz Z, Senturk S. Charac
- Page 195 and 196: 182 97. Fojo SS, Stalenhoef AF, Mar
- Page 197 and 198: 184 111. Lam CW, Yuen YP, Cheng WF,
- Page 199 and 200: 186 127. Crispin SM. Ocular manifes
- Page 201 and 202: 188 144. Lindsay S, Entenmann C, Ch
- Page 203 and 204: 190 161. Steiner JM. Canine pancrea
- Page 205 and 206: 192 176. Steiner JM, Teague SR, Wil
- Page 207 and 208: 194 191. Steiner JM. Diagnosis of p
- Page 209 and 210: 196 208. Talukdar R, Vege S. Recent
- Page 211 and 212: 198 224. Koch K, Drewelow B, Liebe
- Page 213 and 214:
200 241. Petrov MS, van Santvoort H
- Page 215 and 216:
202 258. Ewald N, Hardt PD, Kloer H
- Page 217 and 218:
204 274. Otvos JD, Jeyarajah EJ, Be
- Page 219 and 220:
206 289. Carpentier YA, Scruel O. C