Extraction and Spectrophotometric Determination of Diclofenac in ...
Extraction and Spectrophotometric Determination of Diclofenac in ...
Extraction and Spectrophotometric Determination of Diclofenac in ...

Create successful ePaper yourself
Turn your PDF publications into a flip-book with our unique Google optimized e-Paper software.
356 Journal <strong>of</strong> the Ch<strong>in</strong>ese Chemical Society, 2008, 55, 356-361<br />
<strong>Extraction</strong> <strong>and</strong> <strong>Spectrophotometric</strong> <strong>Determ<strong>in</strong>ation</strong> <strong>of</strong> Dicl<strong>of</strong>enac <strong>in</strong><br />
Pharmaceuticals<br />
Zh.O.Kormosh, a * I. P. Hunka a <strong>and</strong> Ya. R. Bazel b,c<br />
a Volyn State University, Voliav., 13, 43025 Lutsk, Ukra<strong>in</strong>e<br />
b Uzhgorod National University, Pidgirna str., 46, 88000 Uzhgorod, Ukra<strong>in</strong>e<br />
c P.J. Safarik University, Moyzesova str., 11, 04154 Kosice, Slovakia<br />
A new simple, rapid <strong>and</strong> sensitive spectrophotometric method has been developed for the determ<strong>in</strong>ation<br />
<strong>of</strong> dicl<strong>of</strong>enac sodium (Dicl) <strong>in</strong> pharmaceutical preparations. This method is based on the reaction <strong>of</strong><br />
dicl<strong>of</strong>enac sodium with an analytical reagent 1,3,3-trimethyl-5-thiocyanato-2-[3-(1,3,3-trimethyl-3-<br />
H-<strong>in</strong>dol-2-ylidene)-propenyl]-<strong>in</strong>dolium cloride (TIC) at pH 8.0-11.0 <strong>and</strong> the extraction <strong>of</strong> ion associate<br />
colored complex. Optimal conditions for the complex formation between Dicl <strong>and</strong> TIC were studied. This<br />
ion associate complex (1:1) was detected <strong>and</strong> extracted with toluene <strong>and</strong> an absorption maximum at 566.2<br />
nm aga<strong>in</strong>st a blank reagent. The calibration graph was l<strong>in</strong>ear from 0.9-11.0 µg/mL <strong>of</strong> dicl<strong>of</strong>enac <strong>and</strong> the<br />
detection limit was 0.86 µg/mL.<br />
Keywords: Dicl<strong>of</strong>enac; Ion associates; <strong>Determ<strong>in</strong>ation</strong>; Spectrophotometry.<br />
INTRODUCTION<br />
The determ<strong>in</strong>ation <strong>of</strong> small amounts <strong>of</strong> dicl<strong>of</strong>enac <strong>in</strong><br />
pharmaceutical preparations is very important for medical<br />
<strong>and</strong> pharmaceutical needs where it is used for the treatment<br />
<strong>of</strong> various diseases. Therefore it is crucial to develop a simple,<br />
selective <strong>and</strong> cost-effective method <strong>of</strong> determ<strong>in</strong><strong>in</strong>g the<br />
microamounts <strong>of</strong> dicl<strong>of</strong>enac <strong>in</strong> different pharmaceutical<br />
formulations.<br />
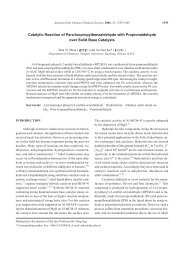
Dicl<strong>of</strong>enac [2-(2,6-dichloroam<strong>in</strong>o)phenyl]acetic acid<br />
is a non-steroidal anti-<strong>in</strong>flammatory drug. It is usually<br />
found as a sodium or potassium salt (Fig. 1(a)). It is used<br />
for the treatment <strong>of</strong> rheumatoid arthritis, ankyllos<strong>in</strong>g spondylitis,<br />
osteoarthritis <strong>and</strong> sport <strong>in</strong>juries. 1<br />
Several types <strong>of</strong> analytical procedures have been proposed<br />
for the analysis <strong>of</strong> dicl<strong>of</strong>enac <strong>in</strong> pharmaceutical formulation.<br />
These procedures <strong>in</strong>clude potentiometry, 2–4 fluorimetry,<br />
5–7 HPLC, 8 gravimetry, 9 UV spectrophotometry<br />
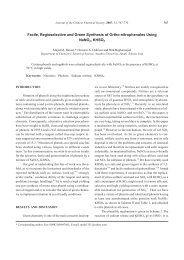
Fig. 1. Structures <strong>of</strong> dicl<strong>of</strong>enac sodium or potassium<br />
salt (a) <strong>and</strong> TIC (b).<br />
<strong>and</strong> partial least squares regression (PLS) 10–13 <strong>and</strong> other<br />
methods. Some <strong>of</strong> these procedures are cumbersome <strong>and</strong><br />
too costly for rout<strong>in</strong>e analysis.<br />
The spectrophotometric method provides sensitivity,<br />
precision <strong>and</strong> accuracy <strong>of</strong> analysis, thus it <strong>of</strong>fers practical<br />
<strong>and</strong> economical advantages over other techniques. There<br />
are methodologies developed for the spectrophotometric<br />
determ<strong>in</strong>ation <strong>of</strong> dicl<strong>of</strong>enac. 14–17 Some <strong>of</strong> them describe<br />
the spectrophotometric determ<strong>in</strong>ation <strong>of</strong> dicl<strong>of</strong>enac after<br />
the extraction <strong>of</strong> a created complex. 15,17,18<br />
There are numerous publications 16,19 dedicated to the<br />
determ<strong>in</strong>ation <strong>of</strong> small amounts <strong>of</strong> pharmaceutical compounds<br />
with the help <strong>of</strong> base color<strong>in</strong>g agents. Base dyes are<br />
<strong>of</strong>ten used as reagents for the extractive spectrophotometric<br />
determ<strong>in</strong>ation <strong>of</strong> many <strong>in</strong>organic <strong>and</strong> organic substances.<br />
20–22 The merits <strong>of</strong> a base color<strong>in</strong>g agent <strong>in</strong>clude<br />
high molar absorptive values <strong>and</strong> stability <strong>in</strong> solution over<br />
a wide pH range. But some <strong>of</strong> the systems still lack a def<strong>in</strong>itive<br />
study, therefore trigger<strong>in</strong>g further <strong>in</strong>terest <strong>in</strong> detailed<br />
study <strong>of</strong> conditions <strong>and</strong> peculiarities <strong>of</strong> creation <strong>and</strong> extraction<br />
<strong>of</strong> ionic associates with new color<strong>in</strong>g agents. This<br />
trend <strong>of</strong> analytical chemistry is <strong>of</strong> current <strong>in</strong>terest <strong>and</strong> holds<br />
much promise.<br />
In this work we describe a new analytical form by us<strong>in</strong>g<br />
1,3,3-trimethyl-5-thiocyanato-2-[3-(1,3,3-trimeth-<br />
* Correspond<strong>in</strong>g author. Tel: +38-03322-48427; Fax: +38-03322-41007; E-mail: kormosh@univer.lutsk.ua
<strong>Spectrophotometric</strong> <strong>Determ<strong>in</strong>ation</strong> <strong>of</strong> Dicl<strong>of</strong>enac J. Ch<strong>in</strong>. Chem. Soc., Vol. 55, No. 2, 2008 357<br />
yl-3-H-<strong>in</strong>dol-2-ylidene)-propenyl]-<strong>in</strong>dolium cloride (TIC)<br />
(Fig. 1(b)) for the spectrophotometric determ<strong>in</strong>ation <strong>of</strong><br />
dicl<strong>of</strong>enac <strong>in</strong> different pharmaceutical form.<br />
EXPERIMENTAL<br />
Materials<br />
All chemicals were <strong>of</strong> analytical-reagent grade. Distilled<br />
water was used to prepare all solutions <strong>and</strong> <strong>in</strong> all experiments.<br />
Universal buffer solution (pH = 9.6) was prepared by<br />
mix<strong>in</strong>g 100 mL <strong>of</strong> a mixture <strong>of</strong> 0.04 mol/L H 3 BO 3 ,0.04<br />
mol/L CH 3 COOH, 0.04 mol/L H 3 PO 4 <strong>and</strong>75mL0.20<br />
mol/L NaOH.<br />
TIC was used as a 1 × 10 -3 mol/L solution.<br />
Dicl<strong>of</strong>enac sodium (Sigma-Aldrich): a freshly prepared<br />
1 × 10 -3 mol/L aqueous solution was used as a st<strong>and</strong>ard<br />
solution for analytical purposes. It was st<strong>and</strong>ardized<br />
us<strong>in</strong>g the method proposed by the Ukra<strong>in</strong>ian State Pharmacopoeia.<br />
1<br />
The follow<strong>in</strong>g commercial dosage forms were analyzed<br />
with TIC: capsules, labeled to conta<strong>in</strong> 75 mg <strong>of</strong> dicl<strong>of</strong>enac<br />
(sodium salt) per tablets, <strong>in</strong>jectable ampoules, 75 mg<br />
<strong>of</strong> dicl<strong>of</strong>enac (sodium salt) per ampoule. O<strong>in</strong>tment, 10% <strong>of</strong><br />
dicl<strong>of</strong>enac (sodium salt). The work<strong>in</strong>g st<strong>and</strong>ard 1 × 10 -3<br />
mol/L solutions were prepared by dilution the stock solution<br />
from capsules, <strong>in</strong>jections <strong>and</strong> o<strong>in</strong>tments with buffer<br />
solution.<br />
Instruments<br />
A SF-2000 spectrophotometer (LOMO, Russia) was<br />
used to obta<strong>in</strong> spectra, with 0.3 cm matched glass cells used<br />
to perform analyses. All pH measurements were made with<br />
an I-160 Model pH meter (AKVILON, Russia).<br />
All experiments were performed at room temperature,ma<strong>in</strong>ta<strong>in</strong>edat25±1°C.<br />
Procedure for the determ<strong>in</strong>ation <strong>of</strong> dicl<strong>of</strong>enac sodium<br />
<strong>in</strong> pharmaceutical preparations<br />
An aliquot <strong>of</strong> st<strong>and</strong>ard dicl<strong>of</strong>enac sodium solution<br />
0-0.2 × 10 -3 mol/L was transferred <strong>in</strong>to a 10 mL funnel, <strong>and</strong><br />
0.5 mL <strong>of</strong> universal buffer solution <strong>of</strong> pH 9.6 <strong>and</strong> 0.5 mL <strong>of</strong><br />
1×10 -3 mol/L TIC were added. The solution was mixed<br />
well <strong>and</strong> diluted to 5 mL with distilled water. Toluene (5<br />
mL) was added to the funnel <strong>and</strong> was shaken for exactly 1<br />
m<strong>in</strong>. The absorbance <strong>of</strong> the separated toluene layer was<br />
measured at 566.2 nm aga<strong>in</strong>st that <strong>of</strong> the blank test. The<br />
amount <strong>of</strong> dicl<strong>of</strong>enac sodium <strong>in</strong> the capsules, ampoules <strong>and</strong><br />
o<strong>in</strong>tment present was calculated from a calibration graph.<br />
Two capsules were weighed <strong>and</strong> powdered. The<br />
quantity <strong>of</strong> powder equivalent to 150 mg <strong>of</strong> dicl<strong>of</strong>enac sodium<br />
was mixed with 1 mL <strong>of</strong> ethanol <strong>and</strong> then 20 mL <strong>of</strong><br />
universal buffer solution <strong>of</strong> pH 9.6. This was filtered <strong>in</strong>to a<br />
50 mL glass, the powder washed three times with 7 mL <strong>of</strong><br />
distilled water, filtered, <strong>and</strong> the comb<strong>in</strong>ed filtrate mixed<br />
well. The solution was transferred <strong>in</strong>to a 50 mL calibrated<br />
flask <strong>and</strong> brought to volume with distilled water. The concentration<br />
<strong>of</strong> dicl<strong>of</strong>enac sodium solution was 1 × 10 -2<br />
mol/L. The work<strong>in</strong>g 1 × 10 -3 mol/L <strong>and</strong> 1 × 10 -4 mol/L solutions<br />
were prepared by the dilution <strong>of</strong> the stock solution<br />
with 20 mL <strong>of</strong> buffer solution. 0.3, 0.6, 0.9 mL aliquots <strong>of</strong> 1<br />
×10 -4 mol/L solution were assayed as described above.<br />
The contents <strong>of</strong> five ampoules were mixed. 12.7 mL<br />
<strong>of</strong> this solution were transferred <strong>in</strong>to a 100 mL calibration<br />
flask <strong>and</strong> 20 mL <strong>of</strong> universal buffer solution <strong>of</strong> pH 9.6 were<br />
added. The concentration <strong>of</strong> dicl<strong>of</strong>enac sodium was 1 ×<br />
10 -2 mol/L. The work<strong>in</strong>g 1 × 10 -3 mol/L <strong>and</strong> 1 × 10 -4 mol/L<br />
solutions were prepared by dilution <strong>of</strong> the stock solution<br />
with 20 mL <strong>of</strong> buffer solution. The same aliquots were assayed<br />
as described above.<br />
10% <strong>of</strong> o<strong>in</strong>tment was weighed <strong>and</strong> mixed well. The<br />
quantity <strong>of</strong> o<strong>in</strong>tment <strong>of</strong> dicl<strong>of</strong>enac sodium was mixed <strong>in</strong> 20<br />
mL <strong>of</strong> universal buffer solution <strong>of</strong> pH 9.6. The concentration<br />
<strong>of</strong> dicl<strong>of</strong>enac sodium was 1 × 10 -3 mol/L. The work<strong>in</strong>g<br />
1×10 -4 mol/L solution was prepared by the dilution <strong>of</strong> the<br />
stock solution with 20 mL <strong>of</strong> buffer solution. The same<br />
aliquots were assayed as described above.<br />
RESULTS AND DISCUSSION<br />
Absorption spectra<br />
Absorption spectra were recorded under optimal<br />
complexation <strong>and</strong> extraction conditions. The absorption<br />
spectra from the dye <strong>and</strong> from the ion associate <strong>of</strong> dicl<strong>of</strong>enac<br />
are not different <strong>in</strong> practice. Changes <strong>in</strong> the position<br />
<strong>of</strong> the maximum help to expla<strong>in</strong> the solvatochromatic effect<br />
observed, which provides evidence <strong>of</strong> the formation <strong>of</strong><br />
complex compounds <strong>of</strong> the ion associate type. It was determ<strong>in</strong>ed<br />
by different methods 23 that the molar ratio Dicl - :<br />
TIC + <strong>in</strong> the formed ion associate (IA) is 1:1. This means<br />
that the ion associate conta<strong>in</strong> s<strong>in</strong>gly charged dicl<strong>of</strong>enac <strong>and</strong><br />
dye cations. Therefore, the reaction mechanism can be<br />
expressed by the follow<strong>in</strong>g equations:<br />
Dicl - Na + (aq) Dicl - (aq) +Na + (aq)<br />
R + Cl - (aq) R + (aq) +Cl - (aq)<br />
Dicl - (aq) +R + (aq) + k S (org) [Dicl × R] × k S (org)
358 J. Ch<strong>in</strong>. Chem. Soc., Vol. 55, No. 2, 2008 Kormosh et al.<br />
where Dicl - is the dicl<strong>of</strong>enac anion, R + is the TIC, S is the<br />
organic solvent, aq is the aqueous phase, <strong>and</strong> org is the organic<br />
phase.<br />
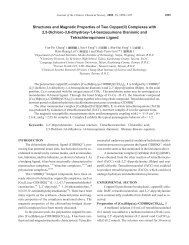
The absorption spectra <strong>of</strong> the extracted IA colored<br />
complex <strong>of</strong> dicl<strong>of</strong>enac with TIC <strong>in</strong> toluene were measured<br />
over 400-750 nm. The complex shows the maximum absorbance<br />
at 566.2 nm (Fig. 2) which can therefore be used<br />
for analytical purposes. This wavelength was used for all<br />
subsequent measurements. The maximum production <strong>and</strong><br />
extraction <strong>of</strong> complex was atta<strong>in</strong>ed after 1 m<strong>in</strong>.<br />
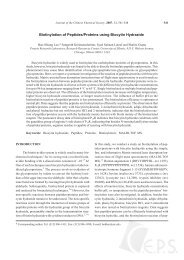
Effect <strong>of</strong> pH<br />
One needs to create the conditions for the IA components<br />
to form <strong>and</strong> extract the IA.<br />
To establish the optimum pH range, dicl<strong>of</strong>enac sodium<br />
was mixed with TIC <strong>in</strong> aqueous solution with pH values<br />
from 2.0 to 11.0, <strong>and</strong> the IA extract absorbance measured.<br />
Fig. 3 shows that the absorbance <strong>in</strong>creases <strong>and</strong><br />
reaches a maximum plateau at 8.0-11.0 pH range. Hence, a<br />
pH <strong>of</strong> 9.6 was used <strong>in</strong> all the subsequent experimental<br />
work. As the shape <strong>of</strong> the absorption curve <strong>and</strong> the position<br />
<strong>of</strong> the absorption maximum do not vary with pH, it was assumed<br />
that only one type <strong>of</strong> complex formed <strong>in</strong> this pH<br />
range.<br />
Effect <strong>of</strong> TIC concentration<br />
The dye concentration has a significant effect on the<br />
formation <strong>and</strong> extraction <strong>of</strong> the dicl<strong>of</strong>enac ion pair.<br />
To establish the optimum TIC content, the solution<br />
absorbance was plotted as a function <strong>of</strong> TIC concentration.<br />
The absorbance <strong>of</strong> the system <strong>in</strong>creased <strong>in</strong> the concentration<br />
range <strong>of</strong> (0.0-1.6) 10 -4 mol/L <strong>and</strong> was practically<br />
constant <strong>in</strong> the (1.0-1.6) 10 -4 mol/L range. Thereafter, 1.0<br />
10 -4 mol/L TIC solution was used as the optimum concentration.<br />
Effects <strong>of</strong> salt<strong>in</strong>g-out agent<br />
Salt<strong>in</strong>g-out agents are known to improve extraction<br />
by organic solvents. 24 The <strong>in</strong>fluence <strong>of</strong> such salt<strong>in</strong>g-out<br />
agents as Na 2 SO 4 ,MgSO 4 ,(NH 4 ) 2 SO 4 on the IA complex<br />
formation was studied. The results show that all these compounds<br />
have no salt<strong>in</strong>g-out properties <strong>in</strong> the <strong>in</strong>vestigated<br />
system.<br />
Effects <strong>of</strong> organic solvents miscible with the aqueous<br />
phase<br />
The publications on the determ<strong>in</strong>ation <strong>of</strong> small amounts<br />
<strong>of</strong> different <strong>in</strong>organic compounds with the help <strong>of</strong> base color<strong>in</strong>g<br />
agents 22,25 show that <strong>in</strong> some cases an addition <strong>of</strong> the<br />
organic solvent that dissolves <strong>in</strong> the aqueous phase <strong>in</strong>creases<br />
the analytical signal <strong>of</strong> the created ion-association<br />
complex <strong>in</strong> the system <strong>and</strong> at the same time lowers the signal<br />
<strong>of</strong> blank reagent. This phenomenon is very important<br />
because it promotes the sensitivity <strong>of</strong> the system.<br />
The addition <strong>of</strong> donor solvents to the aqueous phase<br />
leads to a considerable improvement <strong>in</strong> the extraction <strong>of</strong><br />
Fig. 2. Absorption spectra <strong>of</strong> the solution Dicl (1), TIC<br />
<strong>in</strong> OH - form (2), TIC <strong>in</strong> the ion form (3) <strong>and</strong> <strong>of</strong><br />
the extracted Dicl × TIC IA colored complexes<br />
<strong>in</strong> toluene (4).<br />
Fig. 3. The effect <strong>of</strong> pH on IA colored complex formation<br />
<strong>and</strong> extraction. Dicl<strong>of</strong>enac concentration;<br />
4 10 -5 mol/L; 1 10 -4 mol/L <strong>of</strong> TIC.
<strong>Spectrophotometric</strong> <strong>Determ<strong>in</strong>ation</strong> <strong>of</strong> Dicl<strong>of</strong>enac J. Ch<strong>in</strong>. Chem. Soc., Vol. 55, No. 2, 2008 359<br />
dicl<strong>of</strong>enac ion pairs (synergistic effect) <strong>and</strong> to the simultaneous<br />
suppression <strong>of</strong> the extraction <strong>of</strong> simple salts <strong>of</strong> dyes<br />
(antagonistic effect).<br />
Donor solvents may conditionally be divided <strong>in</strong>to<br />
groups by their water toluene distribution constants: 26,27<br />
the donor solvents that readily extracted <strong>in</strong>to toluene (K d ><br />
0.01) (acetone, ethanol, pyrid<strong>in</strong>e, dioxane, <strong>and</strong> other solvents<br />
that hardly cross <strong>in</strong>to the toluene phase (K d < 0.01)<br />
(DMFA, DMSO, HMPA etc.). In practice, the effect <strong>of</strong> the<br />
concentration should also be taken <strong>in</strong>to account. However,<br />
<strong>in</strong> our case, this division expla<strong>in</strong>s the antagonistic effect<br />
observed <strong>in</strong> the extraction <strong>of</strong> simple salts <strong>of</strong> dyes reasonably<br />
well.<br />
We tested this division <strong>in</strong> our system for the determ<strong>in</strong>ation<br />
<strong>of</strong> the organic ion <strong>of</strong> dicl<strong>of</strong>enac. For this test DMFA,<br />
DMSO, acetone, 1,4-dioxane were used.<br />
Assum<strong>in</strong>g that dye solvates are formed <strong>in</strong> the aqueous<br />
phase accord<strong>in</strong>g to the equation<br />
R + ×Dicl - + kS [R + ×Dicl - ]×S k ,<br />
where R + is a dye cation, <strong>and</strong> S is the molecule <strong>of</strong> a donor<br />
solvent, <strong>and</strong> tak<strong>in</strong>g <strong>in</strong>to account the fact that the unsolvated<br />
species <strong>of</strong> the dye predom<strong>in</strong>antly go <strong>in</strong>to the organic phase,<br />
we can write the distribution ratio (D) for a simple dye salt<br />
as follows:<br />
Table 1. The ma<strong>in</strong> characteristics <strong>of</strong> extracted IA <strong>of</strong> Dicl with<br />
TIC (A k absorbance <strong>of</strong> IA, A 0 absorbance <strong>of</strong> blank test,<br />
R efficiency <strong>of</strong> IA extraction)<br />
Organic solvent , nm 10 -4 À k /A o R(%)<br />
butyl acetate<br />
benzene<br />
toluene<br />
558.1<br />
566.2<br />
566.2<br />
2.2<br />
6.0<br />
7.7<br />
1.4<br />
7.0<br />
9.5<br />
83.0<br />
97.8<br />
98.9<br />
Effects <strong>of</strong> organic solvents<br />
We <strong>in</strong>vestigated the <strong>in</strong>fluence <strong>of</strong> the nature <strong>of</strong> extragents<br />
on the formation <strong>and</strong> extraction <strong>of</strong> the ion associates<br />
<strong>of</strong> dicl<strong>of</strong>enac with TIC.<br />
Such organic solvents as toluene, benzene, butylacetate,<br />
chlor<strong>of</strong>orm were exam<strong>in</strong>ed for the extraction <strong>of</strong> the IA<br />
complex. The best results were obta<strong>in</strong>ed for benzene <strong>and</strong><br />
toluene. Toluene was chosen over benzene because the latter<br />
is a known carc<strong>in</strong>ogen. Table 1 shows the ma<strong>in</strong> spectrophotometric<br />
characteristics <strong>of</strong> these systems.<br />
L<strong>in</strong>earity<br />
A calibration curve was obta<strong>in</strong>ed under optimum conditions<br />
(pH 9.6, dicl<strong>of</strong>enac concentration <strong>of</strong> 2 × 10 -5 mol/L,<br />
1×10 -4 mol/L TIC solution). The absorbance response is<br />
l<strong>in</strong>ear <strong>in</strong> relation to the calculated concentration <strong>of</strong> dicl<strong>of</strong>enac<br />
sodium over the range <strong>of</strong> 0.9-11.0 µg/mL. The cali-<br />
D =[R×Dicl] org /([R × Dicl] aq +[RL k × Dicl] aq ).<br />
After simple transformations (at [Dicl - ] = const), we<br />
obta<strong>in</strong>ed the l<strong>in</strong>ear equation<br />
log(K d /D-1) = log K s +klog [S],<br />
which allowed us to calculate K s (solvation constants <strong>of</strong> IA)<br />
for different donor solvents.<br />
The logarithm <strong>of</strong> salvations constants (log K s )are<br />
1.18 for DMFA, 1.79 for DMSO, 1.12 for acetone but only<br />
0.42 for 1,4-dioxane.<br />
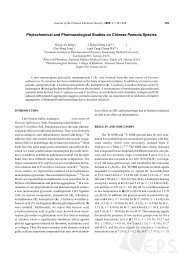
Fig. 4 shows that the addition to aqueous phase <strong>of</strong> the<br />
DMSO, DMFA, acetone, 1,4-dioxane don’t <strong>in</strong>crease the<br />
analytical signal. At the same time, one should take <strong>in</strong>to account<br />
that when the concentrations <strong>of</strong> these solvents <strong>in</strong> the<br />
aqueous phase are higher than 0.07-0.15 vol. %, they suppress<br />
the extraction <strong>of</strong> not only simple dye salts but dicl<strong>of</strong>enac<br />
ion pairs as well.<br />
Fig. 4. Variation <strong>in</strong> absorbance <strong>of</strong> the Dicl × TIC ion<br />
associate complex <strong>in</strong> the presence <strong>of</strong> acetone<br />
(1), DMSO (2), DMFA (3) <strong>and</strong> 1,4-dioxane (4)<br />
<strong>in</strong> aqueous phase. pH 9.6; dicl<strong>of</strong>enac concentration<br />
4 10 -5 mol/L; 1 10 -4 mol/L <strong>of</strong> TIC<br />
(absorbance was recorded at 566.2 nm ).
360 J. Ch<strong>in</strong>. Chem. Soc., Vol. 55, No. 2, 2008 Kormosh et al.<br />
Table 2. Comparison <strong>of</strong> ma<strong>in</strong> chemistry-analytical parameters <strong>of</strong> different spectrophotometric methods for the determ<strong>in</strong>ation <strong>of</strong><br />
dicl<strong>of</strong>enac sodium<br />
Analytical<br />
reagent<br />
Copper acetate<br />
[17]<br />
Methylene<br />
Violet [19]<br />
Methylene<br />
Blue [18]<br />
Proposed<br />
method<br />
pH range , nm 10 -4 Sensitivity,<br />
S<strong>and</strong>ell<br />
g/mL<br />
Range Beer’s<br />
law<br />
Detection<br />
limit,<br />
g/mL<br />
Disadvantages<br />
1.00 Some important parameters<br />
72.00 Low sensitivity<br />
0.37 Selectivity was not studied<br />
5.3 680 – 0.010 1.0-25.0<br />
mg mL -1 are unknown<br />
7.4-8.0 540 3.1 – 1.0-8.0<br />
mg mL -1<br />
9.2-9.4 653 5.7 0.006 0.8-6.4<br />
mg mL -1<br />
8.0-11.0 566.2 7.7 1.08 0.9-11.0 0.86 –<br />
g/mL g/mL<br />
Table 3. <strong>Determ<strong>in</strong>ation</strong> <strong>of</strong> dicl<strong>of</strong>enac sodium <strong>in</strong> different dosage<br />
forms (n = 5, average)<br />
Sample<br />
Labeled amount<br />
(mg)<br />
Amount found (mg)<br />
Dicloberl Retard 100.00 capsule -1 99.68 0.33<br />
Dicloberl 75.00 ampoule -1 74.77 0.42<br />
Dicloran ® CP 100.00 tablet -1 99.33 0.68<br />
Sodium Dicl<strong>of</strong>enac 25.00 capsule -1 24.75 0.40<br />
Nacl<strong>of</strong>en 75.00 ampoule -1 74.91 0.22<br />
Nacl<strong>of</strong>en 75.0 capsule -1 75.16 0.38<br />
Dicl<strong>of</strong>enac retard 75.0 capsule -1 74.81 0.22<br />
bration equation for the representative curve is: A 0.03058<br />
×10 -4 + 0.05496C, where A <strong>and</strong> C correspond to the absorbance<br />
<strong>and</strong> the calculated concentration <strong>of</strong> dicl<strong>of</strong>enac sodium<br />
(g/mL), respectively. The molar absorptivity coefficients<br />
for different solvents were shown <strong>in</strong> Table 1, the<br />
detection limit <strong>of</strong> 0.86 µg/mL.<br />
Table 2 shows that the method reported here has<br />
higher sensitivity than other similar methods, <strong>in</strong> which copper<br />
acetate, 17 methylene violet 19 <strong>and</strong> methylene blue 18 are<br />
employed as analytical reagents.<br />
Application<br />
Some pharmaceutical dosage forms were analyzed by<br />
the proposed method. Table 3 shows the results <strong>of</strong> dicl<strong>of</strong>enac<br />
sodium determ<strong>in</strong>ation <strong>in</strong> pharmaceutical preparations<br />
by the spectrophotometric method with the reagent<br />
TIC.<br />
CONCLUSIONS<br />
On the basis <strong>of</strong> obta<strong>in</strong>ed data, we found a new analytical<br />
form <strong>and</strong> developed a new methodology for determ<strong>in</strong><strong>in</strong>g<br />
micro amounts <strong>of</strong> dicl<strong>of</strong>enac <strong>in</strong> pharmaceutical formulations<br />
us<strong>in</strong>g the base color<strong>in</strong>g agent TIC. The technique<br />
has good metrological characteristics, high sensitivity, <strong>and</strong><br />
is simple to use.<br />
ACKNOWLEDGMENTS<br />
This work has been supported by the M<strong>in</strong>istry <strong>of</strong> Education<br />
<strong>and</strong> Science <strong>of</strong> Ukra<strong>in</strong>e <strong>and</strong> International Visegrad<br />
Fund (Grant 997015), the Scientific Grant Agency <strong>of</strong> the<br />
M<strong>in</strong>istry <strong>of</strong> Education <strong>of</strong> the Slovak Republic <strong>and</strong> the Slovak<br />
Academy <strong>of</strong> Sciences (Grant VEGA No 1/4450/07)<br />
<strong>and</strong> Slovak Research <strong>and</strong> Development Agency (Project<br />
APVV SK-UA-0002-07).<br />
Received June 7, 2007.<br />
REFERENCES<br />
1. The Ukra<strong>in</strong>ian State Pharmacopoeia: Kharkiv, 2004, 672.<br />
2. Shamsipur, M.; Jalali, S.; Ershad, F. J. Pharm. Biomed.<br />
Anal. 2005, 37, 943.<br />
3. Sant<strong>in</strong>i, A. O.; Pezza, H. R.; Pezza, L. Talanta 2006, 68, 636.<br />
4. Hassan, S. S. M.; Mahmoud, W. H.; Elmosallany, M. A. F.;<br />
Almazzooqi, M. H. J. Pharm. Biomed. Anal 2005, 39, 315.<br />
5. Arancibia, J. A.; Boldr<strong>in</strong>i, M. A.; Esc<strong>and</strong>ar, G. M. Talanta<br />
2000, 52, 261.<br />
6. Damiani, P. C.; Bearzotti, M.; Cabezón, M. A.; Olivieri, A.<br />
C. J. Pharm. Biomed. Anal 1999, 20, 587.<br />
7. Carreira, L. A.; Rizk, M.; El-Shabrawy, Y.; Zakhari, N. A.;<br />
Toubar, S. S. J. Pharm. Biomed. Anal 1995, 13, 1331.<br />
8. Arcelloni, C.; Lanzi, R.; Pederc<strong>in</strong>i, S.; Molteny, G. at all. J.<br />
Chromatog. B 2001, 763, 195.<br />
9. Tub<strong>in</strong>o, R. L.; de Souza, M. J. AOAC Intern. 2005, 88, 1684.<br />
10. Sena, M. M.; Chaudhry, Z. F.; Coll<strong>in</strong>s, C. H.; Poppi, R. J. J.<br />
Pharm. Biom. Anal. 2004, 36, 743.<br />
11. Ghasemi, J.; Niazi, A.; Ghobadi, S. J. Ch<strong>in</strong>. Chem. Soc.<br />
2005, 52, 1049.<br />
12. Mazurek, S.; Szostak, R. J. Pharm. Biom. Anal. 2006, 40,
<strong>Spectrophotometric</strong> <strong>Determ<strong>in</strong>ation</strong> <strong>of</strong> Dicl<strong>of</strong>enac J. Ch<strong>in</strong>. Chem. Soc., Vol. 55, No. 2, 2008 361<br />
1235.<br />
13. Ghasemi, J.; Niazi, A.; Chobadi, S. J. Ch<strong>in</strong>. Chem. Soc.<br />
2005, 52, 1049.<br />
14.Mat<strong>in</strong>,A.A.;Farajzadeh,M.A.;Joyuban,A. IL Farmaco<br />
2005, 60, 855.<br />
15. Agatonovi-Kuštr<strong>in</strong>, S.; ivanovi, Lj.; Zeevi, M.;<br />
Radulovi,D. J. Pharm. Biom. Anal 1997, 16, 147.<br />
16. Garca, M. S.; Albero, M. I.; Sánchez-Pedreo, C.; Mol<strong>in</strong>a,<br />
J. J. Pharm. Biom. Anal 1998, 17, 267.<br />
17. de Souza, R. L.; Tub<strong>in</strong>o, M. J. Braz. Chem. Soc. 2005, 16,<br />
1068.<br />
18. Botello, J. C.; Pérez Caballero, G. Talanta 1995, 42, 105.<br />
19. Sastry, C. S. P.; Tipirneni, A. S. R. Prasad.; Suryanarayana,<br />
M. V. Analyst 1989, 114.<br />
20. Balogh, I. S.; Maga, I. M. Talanta 2000, 53, 543.<br />
21. Shkumbatiuk, R.; Bazel, Ya. R.; Andruch, V. Anal. Bioanal.<br />
Chem. 2005, 382, 1431.<br />
22. Bazel, Ya. R.; Studenyak, Ya. I.; Tolmachev, A. A. J. Anal.<br />
Chem. 1997, 52, 536.<br />
23. Bulatov, M. I.; Kal<strong>in</strong>k<strong>in</strong>, I. P. Practicheskoye rukovodstvo<br />
po photometricheskim metodam analiza (Practical textbook<br />
<strong>of</strong> photometric methods analises). Chemistry:<br />
Lyen<strong>in</strong>grad, 1986.<br />
24. Morrison, G. H.; Freiser, H. Solvent <strong>Extraction</strong> <strong>in</strong> Analytical<br />
Chemistry; MIR: Lyen<strong>in</strong>grad, 1960.<br />
25. Kormosh, Zh.; Bazel, Ya. R.; Balog. J ACH-Models Chem.<br />
1999, 136, 421.<br />
26. Andruch, V.; Balogh, I. S.; Florian, K.; Matherny, M. Anal.<br />
Sci. 2000, 16, 973.<br />
27. Korenman, Ya. I. Koeffitsienty Raspredeleniya Organicheskikh<br />
Soed<strong>in</strong>enii (Distribution Ratios <strong>of</strong> Organic Compouds);<br />
Voronezh. Gos. Univ.: Voronezh, 1992.