Derivative and Derivative Ratio Spectrophotometric Analysis of ...
Derivative and Derivative Ratio Spectrophotometric Analysis of ...
Derivative and Derivative Ratio Spectrophotometric Analysis of ...

Create successful ePaper yourself
Turn your PDF publications into a flip-book with our unique Google optimized e-Paper software.
Journal <strong>of</strong> the Chinese Chemical Society, 2008, 55, 971-978 971<br />
<strong>Derivative</strong> <strong>and</strong> <strong>Derivative</strong> <strong>Ratio</strong> <strong>Spectrophotometric</strong> <strong>Analysis</strong> <strong>of</strong><br />
Antihypertensive Ternary Mixture <strong>of</strong> Amiloride Hydrochloride,<br />
Hydrochlorothiazide <strong>and</strong> Timolol Maleate<br />
Mohamed H. Abdel-Hay, Azza A. Gazy, Ekram M. Hassan <strong>and</strong> Tarek S. Belal*<br />
Pharmaceutical Analytical Chemistry Department, Faculty <strong>of</strong> Pharmacy, University <strong>of</strong> Alex<strong>and</strong>ria,<br />
Elmessalah 21521, Alex<strong>and</strong>ria, Egypt<br />
Two simple, rapid <strong>and</strong> reliable spectrophotometric methods are described for the resolution <strong>of</strong> the<br />
three-component mixture <strong>of</strong> amiloride hydrochloride (AMD), hydrochlorothiazide (HCT) <strong>and</strong> timolol<br />
maleate (TIM). The first method involves the use <strong>of</strong> derivative spectrophotometry with the zero-crossing<br />
technique where AMD was easily determined using its 0 D<strong>and</strong> 1 D( = 6) amplitudes at 365 <strong>and</strong> 385 nm,<br />
respectively, while HCT <strong>and</strong> TIM were determined by measuring the 3 D( = 6) amplitude at 265 nm <strong>and</strong><br />
the 1 D( = 8) amplitude at 315.4 nm, respectively. The second method involves the application <strong>of</strong> the ratio-spectra<br />
zero-crossing first <strong>and</strong> second derivative spectrophotometry where two points have been used<br />
for the quantification <strong>of</strong> each compound. For the determination <strong>of</strong> AMD, HCT was used as divisor <strong>and</strong> the<br />
1 DD ( =4)<strong>and</strong> 2 DD ( = 6) values at 299.4 <strong>and</strong> 311 nm, respectively, were plotted against AMD concentration;<br />
while - by using TIM as divisor - the 2 DD ( = 6) amplitudes at 264.2 <strong>and</strong> 290 nm were found<br />
to be proportional to HCT concentration. TIM was assayed in the mixture using its 1 DD ( =6)amplitudes<br />
at 289.8 nm (Divisor was AMD) <strong>and</strong> 314.8 nm (Divisor was HCT). Synthetic mixtures <strong>of</strong> different<br />
proportions <strong>and</strong> laboratory-made tablets were assayed by the proposed methods <strong>and</strong> the results revealed<br />
good accuracy <strong>and</strong> repeatability <strong>of</strong> the developed methods.<br />
Keywords: Amiloride hydrochloride; Hydrochlorothiazide; Timolol maleate; <strong>Derivative</strong><br />
spectrophotometry; <strong>Derivative</strong> ratio spectrophotometry.<br />
INTRODUCTION<br />
Direct UV-spectrophotometric measurement is subjected<br />
to interference from co-formulated drugs, excipients<br />
<strong>and</strong>/or degradation products. <strong>Derivative</strong> spectrophotometry<br />
is an analytical technique <strong>of</strong> great utility for extracting<br />
quantitative information from spectra <strong>of</strong> unresolved b<strong>and</strong>s.<br />
The zero-crossing method 1,2 has led to significant developments<br />
in the analysis <strong>of</strong> pharmaceutical compounds in<br />
multi-component mixtures. 3,4<br />
In 1990, Salinas et al. 5 developed the ratio spectra derivative<br />
spectrophotometry for the resolution <strong>of</strong> binary<br />
mixtures. In 1992, Berzas et al. 6 developed a method <strong>and</strong><br />
discussed the theory for resolving ternary mixtures based<br />
on the use <strong>of</strong> first derivative <strong>of</strong> the ratio spectra <strong>of</strong> mixtures,<br />
followed by measurements at the zero crossing wavelengths<br />
<strong>of</strong> the first derivative <strong>of</strong> ratio spectra <strong>of</strong> single components.<br />
The ratio spectra zero crossing first derivative<br />
spectrophotometry was applied for the resolution <strong>of</strong> several<br />
ternary mixtures. 7,8 Also, higher derivative orders such<br />
as the 3 DD were applied for the determination <strong>of</strong> several<br />
ternary mixtures. 9,10<br />
Amiloride hydrochloride (AMD), chemically known<br />
as 3,5-diamino-N-carbamimidoyl-6-chloropyrazine-2-<br />
carboxamide hydrochloride dihydrate, is a weak diuretic<br />
which appears to act mainly on the distal renal tubules. It is<br />
described as potassium sparing since it increases the excretion<br />
<strong>of</strong> sodium <strong>and</strong> reduces the excretion <strong>of</strong> potassium. Hydrochlorothiazide<br />
(HCT), 6-chloro-3,4-dihydro-2H-1,2,4-<br />
benzothiadiazine-7-sulphonamide-1,1-dioxide, is a moderately<br />
potent diuretic. It exerts its effect by reducing the reabsorption<br />
<strong>of</strong> electrolytes from the renal tubules, thereby<br />
increasing the excretion <strong>of</strong> sodium <strong>and</strong> chloride ions, <strong>and</strong><br />
consequently <strong>of</strong> water. Timolol maleate (TIM), (2S)-1-<br />
[(1,1-dimethylethyl)amino]-3-[[4-(morpholin-4-yl)-1,2,5-<br />
thiadiazol-3-yl]oxy]propan-2-ol (Z)-butenedioate, is a<br />
non-cardioselective -blocker used in the management <strong>of</strong><br />
several cardio-vascular disorders. 11 Drug combinations <strong>of</strong><br />
hydrochlorothiazide with -adrenergic blocking agents are<br />
* Corresponding author. Tel: +20-3-4871317; Fax: +20-3-4871351; E-mail: tbelaleg@yahoo.com
972 J. Chin. Chem. Soc., Vol. 55, No. 5, 2008 Abdel-Hay et al.<br />
usually employed for the management <strong>of</strong> hypertension.<br />
Amiloride is useful for the prevention <strong>of</strong> hypokalemia induced<br />
by hydrochlorothiazide especially during prolonged<br />
treatment. 11<br />
The three drugs are <strong>of</strong>ficial in both: the BP 12 <strong>and</strong> the<br />
USP. 13 Also binary mixtures <strong>of</strong> HCT with either AMD or<br />
TIM are <strong>of</strong>ficial <strong>and</strong> are assayed by HPLC methods. 13 Binary<br />
<strong>and</strong> ternary mixtures containing AMD <strong>and</strong> HCT have<br />
been analyzed by several reported methods such as capillary<br />
zone electrophoresis, 14 spectrophotometry, 15 derivative<br />
spectrophotometry, 16 differential pulse polarography<br />
with partial least squares, 17 derivative ratio spectrophotometry,<br />
18 <strong>and</strong> HPLC. 18-20 HCT <strong>and</strong> TIM have been simultaneously<br />
assayed in their binary mixture using several spectrophotometric<br />
methods including flow-injection, 21 orthogonal<br />
function 22 <strong>and</strong> derivative <strong>and</strong> derivative-ratio<br />
spectrophotometry. 23<br />
The combination <strong>of</strong> the three studied drugs has been<br />
recently assayed using several chemometric methods 24 including<br />
classical least squares (CLS), partial least squares<br />
(PLS) <strong>and</strong> principal component regression (PCR).<br />
This work describes the application <strong>of</strong> the zero crossing<br />
derivative <strong>and</strong> the ratio spectra zero crossing first<br />
( 1 DD) <strong>and</strong> second ( 2 DD) derivative spectrophotometry for<br />
the resolution <strong>of</strong> AMD-HCT-TIM ternary mixture. The<br />
proposed methods are rapid, simple, accurate <strong>and</strong> do not require<br />
solving equations or working with additional sophisticated<br />
s<strong>of</strong>tware. In addition, the methods are direct <strong>and</strong> do<br />
not need separation or pretreatment.<br />
EXPERIMENTAL<br />
Apparatus<br />
All spectrophotometric measurements were performed<br />
using a Perkin-Elmer, Lambda EZ201 UV-VIS<br />
spectrophotometer with matched 1-cm quartz cuvettes. The<br />
instrument is connected to a Panasonic impact dot matrix<br />
printer KX-P3626.<br />
Materials<br />
All chemicals <strong>and</strong> solvents used throughout the study<br />
were <strong>of</strong> analytical grade. Authentic samples <strong>of</strong> AMD, HCT<br />
<strong>and</strong> TIM were kindly donated by Pharco Pharmaceuticals<br />
Co., Alex<strong>and</strong>ria, Egypt <strong>and</strong> were used as received.<br />
Laboratory-made tablets containing 25 mg hydrochlorothiazide,<br />
10 mg timolol maleate <strong>and</strong> 2.5 mg amiloride<br />
hydrochloride per tablet were prepared as documented<br />
in several drug indexes 25,26 for Moducren (Merck Sharp &<br />
Dohme).<br />
Preparation <strong>of</strong> Stock Solutions<br />
Stock solutions <strong>of</strong> AMD 200 g/mL, HCT 400 g/mL<br />
<strong>and</strong> TIM 400 g/mL were prepared in methanol <strong>and</strong> stored<br />
refrigerated at 4 C.<br />
Calibration Graphs<br />
<strong>Derivative</strong> Method<br />
The working st<strong>and</strong>ard solutions were prepared by dilution<br />
<strong>of</strong> the stock solutions <strong>of</strong> AMD, HCT <strong>and</strong> TIM with<br />
0.1 M sodium hydroxide solution to reach the concentration<br />
ranges mentioned in Table 1. The absorbance, 1 D<strong>and</strong><br />
3 D spectra were recorded against 0.1 M sodium hydroxide<br />
solution. The absolute values <strong>of</strong> the A max <strong>and</strong> 1 D( =6)<br />
amplitudes at 365 <strong>and</strong> 385 nm, respectively (for AMD), the<br />
3 D( = 6) amplitudes at 265 nm (for HCT) <strong>and</strong> the 1 D(<br />
= 8) amplitudes at 315.4 nm (for TIM) were plotted against<br />
the corresponding concentrations.<br />
<strong>Derivative</strong> <strong>Ratio</strong> Method<br />
The working st<strong>and</strong>ard solutions were prepared by dilution<br />
<strong>of</strong> AMD, HCT <strong>and</strong> TIM stock solutions with 0.1 M<br />
sodium hydroxide solution to reach the concentration ranges<br />
mentioned in Table 1. The absorption spectra were recorded<br />
against 0.1 M sodium hydroxide solution <strong>and</strong> stored.<br />
The stored spectra were divided (amplitude at each wavelength)<br />
by the spectrum <strong>of</strong> a st<strong>and</strong>ard solution <strong>of</strong> 3 g/mL<br />
HCT(forAMD)<strong>and</strong>4g/mL TIM (for HCT). The first <strong>and</strong><br />
the second derivatives <strong>of</strong> the ratio spectra were obtained.<br />
The absolute values <strong>of</strong> the 1 D( =4)<strong>and</strong> 2 D( =6)amplitudes<br />
at 299.4 <strong>and</strong> 311 nm, respectively (for AMD) <strong>and</strong><br />
the 2 D( = 6) amplitudes at 264.2 <strong>and</strong> 290 nm (for HCT)<br />
were plotted against the corresponding concentrations.<br />
For the determination <strong>of</strong> TIM, the stored spectra were<br />
divided (amplitude at each wavelength) by the spectrum <strong>of</strong><br />
a st<strong>and</strong>ard solution <strong>of</strong> either 2 g/mL AMD or 3 g/mL<br />
HCT, the first derivative <strong>of</strong> the ratio spectra were obtained<br />
<strong>and</strong> the absolute values <strong>of</strong> the 1 D( = 6) amplitudes at<br />
289.8 <strong>and</strong> 314.8 nm, respectively, were plotted against the<br />
corresponding concentrations.<br />
Determination <strong>of</strong> AMD-HCT-TIM in Tablets<br />
A total <strong>of</strong> 20 tablets (Laboratory-made tablets containing25mgHCT,10mgTIM<strong>and</strong>2.5mgAMDpertablet<br />
in addition to lactose, starch, talc <strong>and</strong> magnesium stearate<br />
as tablet fillers) were massed <strong>and</strong> finely powdered. To an<br />
accurately weighed quantity <strong>of</strong> the powder equivalent to<br />
the average weight per tablet, 60 mL methanol were added,<br />
stirred for 10 minutes then filtered into a 100-mL volumetric<br />
flask. The residue was washed with two 10 mL portions<br />
<strong>of</strong> methanol <strong>and</strong> washings were added to the filtrate <strong>and</strong> di-
<strong>Analysis</strong> <strong>of</strong> Amiloride, Hydrochlorothiazide <strong>and</strong> Timolol J. Chin. Chem. Soc., Vol. 55, No. 5, 2008 973<br />
Table 1. Analytical parameters for the determination <strong>of</strong> AMD, HCT <strong>and</strong> TIM by the proposed methods<br />
Linearity Regression Equation<br />
a<br />
b<br />
Compound Wavelength (nm) Range Intercept Slope Corr. S a S b<br />
(g/mL) (a) (b) Coeff. (r)<br />
AMD<br />
S y/x<br />
c<br />
LOD d<br />
(g/mL)<br />
LOQ e<br />
(g/mL)<br />
A 365 3-15 0.003 0.0640 0.99991 0.0043 4.93 10 -4 0.0042 0.22 0.67<br />
Zero-Crossing <strong>Derivative</strong>:<br />
D 385 1-15 0.004 0.1129 0.99992 0.0054 8.08 10 -4 0.0051 0.16 0.49<br />
<strong>Derivative</strong> <strong>Ratio</strong>:<br />
DD 299.4 (HCT) * 1-15 -0.050 2.7905 0.99995 0.1049 0.0192 0.0857 0.12 0.36<br />
2 DD 311 (HCT) * 1-15 -0.034 2.4549 0.99997 0.0715 0.0131 0.0584 0.10 0.30<br />
HCT<br />
TIM<br />
Zero-Crossing <strong>Derivative</strong>:<br />
D 265 2-25 -0.004 0.0866 0.99992 0.0083 6.23 10 -4 0.0079 0.32 0.97<br />
<strong>Derivative</strong> <strong>Ratio</strong>:<br />
DD 264.2 (TIM) * 2-25 -0.039 1.3633 0.99995 0.1016 0.0093 0.0830 0.25 0.76<br />
2 DD 290 (TIM) * 2-25 -0.051 1.2986 0.99996 0.0884 0.0081 0.0721 0.23 0.70<br />
Zero-Crossing <strong>Derivative</strong>:<br />
1 D 315.4 3-20 -0.002 0.0394 0.99992 0.0038 2.83 10 -4 0.0036 0.32 0.97<br />
<strong>Derivative</strong> <strong>Ratio</strong>:<br />
1 DD 289.8 (AMD) * 1-20 -0.053 2.2286 0.99997 0.1353 0.0124 0.1104 0.20 0.61<br />
1 DD 314.8 (HCT) * 1-20 0.045 1.8875 0.99999 0.0581 0.0053 0.0474 0.10 0.30<br />
* The compound used as divisor<br />
a St<strong>and</strong>ard deviation <strong>of</strong> the intercept<br />
b St<strong>and</strong>ard deviation <strong>of</strong> the slope<br />
c St<strong>and</strong>ard deviation <strong>of</strong> residuals<br />
d Limit <strong>of</strong> detection<br />
e Limit <strong>of</strong> quantification<br />
luted to volume with methanol. Aliquots <strong>of</strong> the tablet solution<br />
(prepared in methanol) were diluted with 0.1 M sodium<br />
hydroxide solution to obtain final concentrations<br />
within the ranges mentioned in Table (1) <strong>and</strong> then treated as<br />
under the procedures for derivative <strong>and</strong> derivative-ratio<br />
methods.<br />
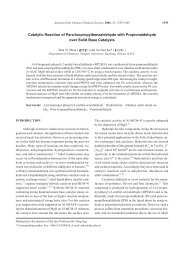
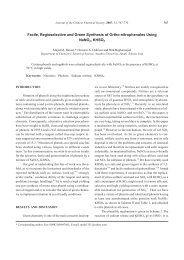
hydroxide solution are shown in Fig. 1. They exhibited<br />
broad b<strong>and</strong>s <strong>of</strong> UV absorption with maxima at 365, 272 <strong>and</strong><br />
RESULTS AND DISCUSSION<br />
Both acidic (0.1 M hydrochloric acid solution) <strong>and</strong> alkaline<br />
(0.1 M sodium hydroxide solution) media were tried<br />
for the resolution <strong>of</strong> the ternary mixture <strong>and</strong> the best results<br />
for analytical purposes (best zero crossings resolving the<br />
mixture) were obtained using 0.1 M sodium hydroxide solution<br />
as a medium for both derivative <strong>and</strong> derivative ratio<br />
measurements. Solutions were stable in 0.1 M sodium hydroxide<br />
medium at ambient temperature for several hours<br />
<strong>and</strong> therefore the amplitudes <strong>of</strong> the peaks used for quantitative<br />
measurement remained unchanged.<br />
<strong>Derivative</strong> Method<br />
The absorption (zero-order) UV spectra <strong>of</strong> AMD,<br />
HCT <strong>and</strong> TIM over the range: 215-420 nm in 0.1 M sodium<br />
Fig. 1. Absorption spectra <strong>of</strong> 4 g/mL AMD (——),<br />
10 g/mL HCT (– – –) <strong>and</strong> 8 g/mL TIM (…) in<br />
0.1 M sodium hydroxide solution.
974 J. Chin. Chem. Soc., Vol. 55, No. 5, 2008 Abdel-Hay et al.<br />
295 nm for AMD, HCT <strong>and</strong> TIM, respectively.<br />
Although being the minor component in this mixture,<br />
AMD could be easily determined because <strong>of</strong> its peak at 365<br />
nm at which the other two components show no interference<br />
(Fig. 1), therefore, conventional A max method was applied<br />
for the determination <strong>of</strong> AMD in this ternary mixture.<br />
To improve the sensitivity <strong>of</strong> AMD determination in the<br />
mixture, the measurement <strong>of</strong> the first ( 1 D) derivative signal<br />
at 385 nm ( = 6) was carried out where the other two<br />
components give zero readings.<br />
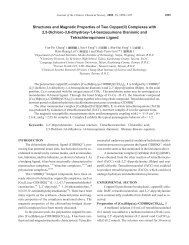
For the determination <strong>of</strong> HCT, the first ( 1 D) <strong>and</strong> the<br />
second ( 2 D) derivative orders did not solve the problem <strong>of</strong><br />
the extensive spectral overlap, while the 3 D spectrum ( =<br />
6) enabled the determination <strong>of</strong> HCT at 265 nm where<br />
AMD <strong>and</strong> TIM exhibited no interference. Fig. 2 shows the<br />
3 D spectra <strong>of</strong> several serial concentrations <strong>of</strong> HCT.<br />
TIM suffered in this mixture from being the least absorbing<br />
component (A (1%,1 cm) = 645, 530 <strong>and</strong> 210 for<br />
AMD, HCT <strong>and</strong> TIM, respectively, at their maxima mentioned<br />
above) as well as from the extensive spectral overlap.<br />
Several trials were made in order to find an iso-differential<br />
point suitable for the selective determination <strong>of</strong> TIM,<br />
<strong>and</strong> it was successfully determined through its 1 D spectrum<br />
at 315.4 nm <strong>and</strong> = 8 nm (zero crossing for both AMD<br />
<strong>and</strong> HCT).<br />
Fig. 2. Third derivative spectra ( = 6 nm) <strong>of</strong> 4, 8, 12,<br />
16 <strong>and</strong> 20 g/mL HCT (——), 2 g/mL AMD<br />
(…) <strong>and</strong> 8 g/mL TIM (– – –) in 0.1 M sodium<br />
hydroxide solution.<br />
<strong>Derivative</strong> <strong>Ratio</strong> Method<br />
The absorption spectra <strong>of</strong> AMD, HCT <strong>and</strong> TIM in 0.1<br />
M sodium hydroxide solution are strongly overlapped over<br />
the range <strong>of</strong> 215-350 nm (Fig. 1). This spectral overlapping<br />
was sufficient enough to demonstrate the resolving power<br />
<strong>of</strong> the derivative ratio technique. This approach represents<br />
the integration <strong>and</strong> simultaneous use <strong>of</strong> the traditional zerocrossing<br />
technique <strong>and</strong> the Salinas method. 5 One <strong>of</strong> the advantages<br />
<strong>of</strong> using higher derivatives is the possibility <strong>of</strong> selecting<br />
more suitable wavelengths from a larger range <strong>of</strong><br />
possibilities; therefore, both the 1 DD <strong>and</strong> 2 DD modes were<br />
applied for the resolution <strong>of</strong> this mixture.<br />
The influence <strong>of</strong> the different parameters was studied<br />
to optimize the signal <strong>of</strong> the derivative ratio spectra; i.e.,<br />
to give good selectivity <strong>and</strong> higher sensitivity in the determination.<br />
Medium scan speed (200 nm/min.) was chosen<br />
throughout the work.<br />
A study was carried out to test for the effect <strong>of</strong> the divisor<br />
concentration on the calibration graphs. The divisor<br />
concentration can be modified <strong>and</strong> different calibration<br />
graphs are then obtained. When the concentration <strong>of</strong> divisor<br />
is increased or decreased, the resulting derivative values<br />
are proportionately decreased or increased, respectively,<br />
although the maxima <strong>and</strong> minima remain at the same<br />
wavelengths. For all subsequent measurements, spectra <strong>of</strong><br />
2 g/mL AMD, 3 g/mL HCT <strong>and</strong> 4 g/mL TIM were used<br />
as st<strong>and</strong>ard divisors. These assured the best compromise in<br />
terms <strong>of</strong> sensitivity, repeatability <strong>and</strong> signal to noise ratio.<br />
The influence <strong>of</strong> for plotting the first <strong>and</strong> second<br />
derivatives <strong>of</strong> the ratio spectra was tested to obtain the optimum<br />
wavelength interval. The value affects both shape<br />
<strong>and</strong> position <strong>of</strong> peaks <strong>of</strong> the analyzed compound as well as<br />
the position <strong>of</strong> the zero-crossing points <strong>of</strong> the other compound<br />
in the mixture. In some cases, this effect is dramatic<br />
in that only a single value can be successful while others<br />
give poor resolution; therefore, we can say that the effect<br />
<strong>of</strong> divisor concentration is mainly a matter <strong>of</strong> sensitivity,<br />
while the effect <strong>of</strong> is mainly a matter <strong>of</strong> resolution. In<br />
the mixture under analysis, = 6 nm was the optimum for<br />
all determinations except for the measurement <strong>of</strong> AMD at<br />
1 DD 299.4 where = 4 nm was applied.<br />
For each compound, 2 points can be successfully<br />
used for its specific determination where the other compounds<br />
show no interference. The ratio spectra <strong>of</strong> different<br />
AMD st<strong>and</strong>ards at increasing concentrations in 0.1 M sodium<br />
hydroxide solution were obtained by dividing each<br />
with the spectrum <strong>of</strong> 3 g/mL HCT in the same solvent. The
<strong>Analysis</strong> <strong>of</strong> Amiloride, Hydrochlorothiazide <strong>and</strong> Timolol J. Chin. Chem. Soc., Vol. 55, No. 5, 2008 975<br />
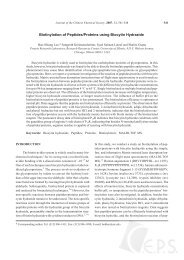
first ( = 4) derivative was plotted from the smoothed ratio<br />
spectra. As illustrated in Fig. 3, AMD can be determined<br />
by measuring the 1 DD amplitude at 299.4 nm where there is<br />
no contribution from TIM. Similarly, the second ( =6)<br />
derivative was plotted from the smoothed ratio spectra <strong>and</strong><br />
AMD can be determined by measuring the 2 DD amplitude<br />
at 311 nm. For the determination <strong>of</strong> HCT, a similar procedure<br />
was followed. The ratio spectra <strong>of</strong> different st<strong>and</strong>ards<br />
<strong>of</strong> HCT were obtained by dividing each with the spectrum<br />
<strong>of</strong> 4 g/mL TIM in sodium hydroxide solution then smoothing.<br />
The first derivative spectra didn’t provide suitable zerocrossings<br />
for HCT determination, while the second derivative<br />
( = 6) permitted its determination at 264.2 <strong>and</strong> 290<br />
nm where the corresponding values <strong>of</strong> AMD were equal to<br />
zero (Fig. 4).<br />
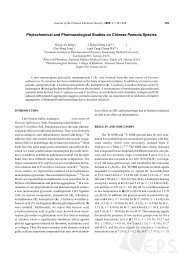
For the determination <strong>of</strong> TIM, two pathways could be<br />
followed. The first pathway involved measuring the first<br />
derivative amplitudes ( = 6) <strong>of</strong> the smoothed ratio spectra<br />
at 289.8 nm (zero-crossing point for HCT), using 2 g/<br />
mL AMD in 0.1 M sodium hydroxide solution as divisor.<br />
The first derivative curves <strong>of</strong> TIM are illustrated in Fig. 5.<br />
The second pathway for the determination <strong>of</strong> TIM involved<br />
the use <strong>of</strong> 3 g/mL HCT in 0.1 M sodium hydroxide solution<br />
as divisor. The resultant ratio spectra were smoothed<br />
then differentiated with respect to wavelength at =6<br />
nm. The first derivative amplitude at 314.8 nm, which corresponds<br />
to a zero-crossing <strong>of</strong> AMD, is proportional to<br />
TIM concentration.<br />
Statistical <strong>Analysis</strong> <strong>of</strong> Results<br />
Concentration Ranges <strong>and</strong> Calibration Graphs<br />
A critical evaluation <strong>of</strong> the proposed derivative <strong>and</strong><br />
derivative-ratio methods was performed by statistical anal-<br />
Fig. 4. Second derivative <strong>of</strong> ratio spectra ( =6nm)<br />
<strong>of</strong> 4, 8, 12 <strong>and</strong> 16 g/mL HCT <strong>and</strong> 3 g/mL<br />
AMD in 0.1 M sodium hydroxide solution.<br />
Fig. 3. First derivative <strong>of</strong> ratio spectra ( =4nm)<strong>of</strong><br />
2, 4, 6 <strong>and</strong> 8 g/mL AMD <strong>and</strong> 5 g/mL TIM in<br />
0.1 M sodium hydroxide solution.<br />
Fig. 5. First derivative <strong>of</strong> ratio spectra ( =6nm)<strong>of</strong><br />
4, 8, 12 <strong>and</strong> 16 g/mL TIM <strong>and</strong> 8 g/mL HCT<br />
in 0.1 M sodium hydroxide solution.
976 J. Chin. Chem. Soc., Vol. 55, No. 5, 2008 Abdel-Hay et al.<br />
Table 2. Precision <strong>and</strong> accuracy for the determination <strong>of</strong> AMD/HCT/TIM synthetic mixtures by zero-crossing<br />
derivative spectrophotometry<br />
Nominal Value<br />
(X SD) a (g/mL) RSD (%) b E r (%) c<br />
(g/mL) AMD AMD AMD<br />
HCT TIM HCT TIM HCT TIM<br />
AMD HCT TIM A 1 365 D 1 385 A365 D 1 385 A365 D 385<br />
8 8 8 8.02 0.04 7.99 0.03 07.94 0.06 8.02 0.07 0.50 0.38 0.76 0.87 0.25 -0.13 -0.75 0.25<br />
2 20 8 —— 2.00 0.02 19.81 0.16 8.14 0.05 — 1.00 0.81 0.61 — 0.00 -0.95 1.75<br />
2 20 4 —— 2.01 0.02 19.73 0.13 4.08 0.03 — 1.00 0.66 0.74 — 0.50 -1.35 2.00<br />
8 4 4 7.99 0.04 8.03 0.04 03.96 0.05 3.99 0.03 0.50 0.50 1.26 0.75 -0.13 0.38 -1.00 -0.25<br />
4 4 8 4.00 0.03 3.99 0.02 04.05 0.02 8.02 0.08 0.75 0.50 0.49 1.00 0.00 -0.25 1.25 0.25<br />
a Mean SD for three determinations<br />
b % relative st<strong>and</strong>ard deviation<br />
c % relative error<br />
N.B. In some mixtures, AMD was determined using the 1 D mode only because its content was 2 g/mL which was<br />
lower than the linearity range <strong>of</strong> the A max method.<br />
Table 3. Precision <strong>and</strong> accuracy for the determination <strong>of</strong> AMD/HCT/TIM synthetic mixtures<br />
by derivative ratio spectrophotometry<br />
Nominal Value<br />
(g/mL)<br />
AMD HCT TIM<br />
(X SD) a for AMD<br />
(g/mL)<br />
RSD (%) b<br />
E r (%) c<br />
1 DD 299.4 2 DD 311 1 DD 299.4 2 DD 311 1 DD 299.4 2 DD 311<br />
8 8 8 7.97 0.04 8.02 0.06 0.50 0.75 -0.38- 0.25<br />
2 20 8 2.02 0.02 1.99 0.02 0.99 1.01 1.00 -0.50-<br />
2 20 4 1.99 0.02 1.99 0.02 1.01 1.01 -0.50- -0.50-<br />
8 4 4 8.02 0.07 7.90 0.05 0.87 0.63 0.25 -1.25-<br />
4 4 8 4.03 0.04 4.00 0.04 0.99 1.00 0.75 0.00<br />
Nominal Value<br />
(g/mL)<br />
AMD HCT TIM<br />
(X SD) a for HCT<br />
(g/mL)<br />
RSD (%) b<br />
E r (%) c<br />
2 DD 264.2 2 DD 290 2 DD 264.2 2 DD 290 2 DD 264.2 2 DD 290<br />
8 8 8 8.01 0.05 8.08 0.07 0.62 0.87 0.13 1.00<br />
2 20 8 19.93 0.13 19.81 0.14 0.65 0.71 -0.35- -0.95-<br />
2 20 4 20.01 0.14 19.93 0.11 0.70 0.55 0.05 -0.35-<br />
8 4 4 3.97 0.03 3.98 0.03 0.76 0.75 -0.75- -0.50-<br />
4 4 8 3.98 0.03 4.01 0.03 0.75 0.75 -0.50- 0.25<br />
Nominal Value<br />
(g/mL)<br />
AMD HCT TIM<br />
(X SD) a for TIM<br />
(g/mL)<br />
RSD (%) b<br />
E r (%) c<br />
1 DD 289.8 1 DD 314.8 1 DD 289.8 1 DD 314.8 1 DD 289.8 1 DD 314.8<br />
8 8 8 8.03 0.07 7.95 0.05 0.87 0.63 0.38 -0.63-<br />
2 20 8 7.94 0.07 8.01 0.07 0.88 0.87 -0.75- 0.13<br />
2 20 4 4.04 0.05 4.03 0.04 1.24 0.99 1.00 0.75<br />
8 4 4 3.96 0.03 3.95 0.04 0.76 1.01 -1.00- -1.25-<br />
4 4 8 7.97 0.07 8.00 0.06 0.88 0.75 -0.38- 0.00<br />
a Mean SD for three determinations<br />
b % relative st<strong>and</strong>ard deviation<br />
c % relative error
<strong>Analysis</strong> <strong>of</strong> Amiloride, Hydrochlorothiazide <strong>and</strong> Timolol J. Chin. Chem. Soc., Vol. 55, No. 5, 2008 977<br />
ysis <strong>of</strong> the experimental data. The linearity ranges <strong>and</strong> regression<br />
equations calculated with the methods described<br />
above are assembled in Table 1, together with other statistical<br />
data. The linearity <strong>of</strong> the calibration graphs <strong>and</strong> the adherence<br />
<strong>of</strong> the system to Beer’s law were validated by the<br />
high values <strong>of</strong> the correlation coefficients <strong>and</strong> the small intercepts.<br />
Other important statistical parameters such as the<br />
st<strong>and</strong>ard error <strong>of</strong> the estimate (S y/x ), the st<strong>and</strong>ard deviation<br />
<strong>of</strong> the slope (S b ) <strong>and</strong> the intercept (S a ) are also given in<br />
Table 1.<br />
Detection <strong>and</strong> Quantification Limits<br />
In accordance with the recommendations <strong>of</strong> ICH, 27<br />
the limit <strong>of</strong> detection, LOD = 3.3 /s, where is the st<strong>and</strong>ard<br />
deviation <strong>of</strong> the intercept <strong>of</strong> the regression line <strong>and</strong> s is<br />
the sensitivity, namely the slope <strong>of</strong> the calibration graph.<br />
On the other h<strong>and</strong>, the limit <strong>of</strong> quantification, LOQ, is defined<br />
as 10 /s. Detection <strong>and</strong> quantification limits <strong>of</strong> the<br />
three drugs using the proposed methods were calculated<br />
<strong>and</strong> are presented in Table 1. The LOD values were verified<br />
<strong>and</strong> they were found experimentally detectable.<br />
Precision <strong>and</strong> Accuracy<br />
The applicability <strong>of</strong> the developed methods was tested<br />
by the analysis <strong>of</strong> AMD, HCT <strong>and</strong> TIM in several synthetic<br />
mixtures <strong>of</strong> different proportions. Good accuracy, expressed<br />
as percentage relative error (E r %), <strong>and</strong> high precision, expressed<br />
as percentage relative st<strong>and</strong>ard deviation (RSD%),<br />
were obtained. The results, summarized in Tables 2 <strong>and</strong> 3,<br />
show that the E r (%) <strong>and</strong> RSD(%) values do not exceed 2%<br />
which demonstrates the accuracy <strong>and</strong> repeatability <strong>of</strong> the<br />
developed methods.<br />
Assay <strong>of</strong> Tablets<br />
Due to the unavailability <strong>of</strong> the commercial tablets in<br />
the Egyptian market, laboratory-made tablets were pre-<br />
Table 4. Assay <strong>of</strong> AMD, HCT <strong>and</strong> TIM in tablets using the proposed methods<br />
<strong>Derivative</strong> <strong>Ratio</strong><br />
AMD A 1 365 D 385 1 DD 2 299.4 DD 311<br />
% Recovery SD* 99.68 1.44 100.13 1.01 99.60 1.67 100.79 1.39<br />
RSD (%) 1.45 1.01 1.68 1.38<br />
E r (%) -0.32 0.13 -0.40 0.79<br />
ANOVA (single factor): F = 0.767 (Critical F = 3.239)<br />
HCT<br />
3 D 265<br />
<strong>Derivative</strong> <strong>Ratio</strong><br />
DD 2 264.2 DD 290<br />
% Recovery SD* 99.58 1.43 100.48 0.78 99.27 0.83<br />
RSD (%) 1.44 0.78 0.84<br />
E r (%) -0.42 0.48 -0.73<br />
ANOVA (single factor): F = 1.762 (Critical F = 3.885)<br />
TIM<br />
1 D 315.4<br />
<strong>Derivative</strong> <strong>Ratio</strong><br />
DD 1 289.8 DD 314.8<br />
% Recovery SD* 101.30 0.76 99.75 0.97 100.93 1.16<br />
RSD (%) 0.75 0.97 1.15<br />
E r (%) 1.30 -0.25 0.93<br />
ANOVA (single factor): F = 3.437 (Critical F = 3.885)<br />
ANOVA (Two-factor with replication)<br />
Source <strong>of</strong> Variation SS df MS F P-value F (critical)<br />
Component 05.873 02 2.937 2.216 0.124 3.259<br />
Methods 01.542 02 0.771 0.582 0.564 3.259<br />
Interaction 12.503 04 3.126 2.358 0.072 2.634<br />
Within 47.716 36 1.325<br />
Total 67.634 44<br />
* Mean % recovery SD for five determinations.
978 J. Chin. Chem. Soc., Vol. 55, No. 5, 2008 Abdel-Hay et al.<br />
pared <strong>and</strong> analyzed by the proposed derivative <strong>and</strong> derivative-ratio<br />
spectrophotometric methods. No interference<br />
from commonly encountered tablet excipients such as talc,<br />
starch, lactose <strong>and</strong> magnesium stearate was observed in the<br />
analyses. The results, shown in Table 4, agree with nominal<br />
content showing reasonable precision <strong>and</strong> accuracy. This is<br />
evident from the low RSD(%) <strong>and</strong> E r (%) values. For each<br />
component, the results obtained by the proposed methods<br />
were statistically compared using the single factor analysis<br />
<strong>of</strong> variance (One-way ANOVA) test. 28 The calculated F-<br />
value did not exceed the critical value for any <strong>of</strong> the three<br />
drugs, indicating that there is no significant difference between<br />
the proposed methods.<br />
Furthermore, the two factor (two-way) ANOVA test 28<br />
was applied for the overall comparison concerning the two<br />
factors: the analyzed component <strong>and</strong> the applied method,<br />
using the percentage recoveries <strong>of</strong> the analytes from tablets<br />
as the statistical population. As shown in Table 4, the obtained<br />
F-values did not exceed the critical values for either<br />
the component or the method factors.<br />
CONCLUSION<br />
<strong>Derivative</strong> <strong>and</strong> derivative-ratio spectrophotometry<br />
were successfully adopted for the simultaneous quantification<br />
<strong>of</strong> a ternary mixture <strong>of</strong> amiloride hydrochloride, hydrochlorothiazide<br />
<strong>and</strong> timolol maleate. Compared with the<br />
previously published chemometric methods, 24 the proposed<br />
methods are simple, direct <strong>and</strong> do not require any additional<br />
s<strong>of</strong>tware programs. Also, they are accurate, precise<br />
<strong>and</strong> time saving <strong>and</strong> therefore they can be considered alternative<br />
tools for the routine analysis <strong>of</strong> commercial tablets<br />
containing the three drugs with minimum sample preparation.<br />
Received November 9, 2007.<br />
REFERENCES<br />
1. O’Haver, T.-C.; Green, G.-L. Anal. Chem. 1976, 48(2), 312.<br />
2. O’Haver, T.-C. Anal. Chem. 1979, 51, 91A.<br />
3. Morelli, B. Talanta 1994, 41(4), 479.<br />
4. Morelli, B. Fresenius J. Anal. Chem. 1996, 354, 97.<br />
5. Salinas, F.; Berzas Nevado, J.-J.; Espinosa Mansilla, A.<br />
Talanta 1990, 37(3), 347.<br />
6. Berzas Nevado, J.-J.; Guiberteau Cabanillas, C.; Salinas, F.<br />
Talanta 1992, 39(5), 547.<br />
7. El-Yazbi, F.-A.; Kovar, K.-A. Sci. Pharm. 1998, 66, 325.<br />
8. El-Yazbi, F.-A.; Abdine, H.-H.; Shaalan, R.-A.; Korany,<br />
E.-A. Spectrosc. Lett. 1998, 31(7), 1403.<br />
9. Morelli, B. Anal. Lett. 1994, 27(14), 2751.<br />
10. Morelli, B. J. Pharm. Biomed. Anal. 1995, 13(3), 219.<br />
11. Sweetman, S.-C. Martindale-The Complete Drug Reference,34<br />
th ed.; The Pharmaceutical Press: London, 2005.<br />
12. The British Pharmacopoeia. Her Majesty’s Stationery Office:<br />
London, 2003.<br />
13. The United States Pharmacopeia,28 th ed.; The National Formulary,<br />
23 rd ed.; United States Pharmacopoeial Convention,<br />
Inc.: Washington, D.C., 2005.<br />
14. Maguregui, M.-I.; Jiménez, R.-M.; Alonso, R.-M. J. Chromatogr.<br />
Sci. 1998, 36(10), 516.<br />
15. Erk, N.; Onur, F. Anal. Lett. 1997, 30(8), 1503.<br />
16. Prasad, C.-V.-N.; Parihar, C.; Sunil, K.; Parimoo, P. J.<br />
Pharm. Biomed. Anal. 1998, 17(4-5), 877.<br />
17. Martin, M.-E.; Hern<strong>and</strong>ez, M.-E.; Jimenez, A.-I.; Arias,<br />
J.-J.; Jimenez, F. Anal. Chim. Acta 1999, 381(2-3), 247.<br />
18. Kartal, M.; Erk, N. J. Pharm. Biomed. Anal. 1999, 19(3-4),<br />
477.<br />
19. Zecevic, M.; Zivanovic, L.-J.; Agatonovic-Kustrin, S.;<br />
Ivanovic, D.; Maksimovic, M. J. Pharm. Biomed. Anal.<br />
2000, 22(1), 1.<br />
20. Zecevic, M.; Zivanovic, L.; Agatonovic-Kustrin, S.; Minic,<br />
D. J. Pharm. Biomed. Anal. 2001, 24(5-6), 1019.<br />
21. Bigley, F.-P.; Grob, R.-L.; Brenner, G.-S. Anal. Chim. Acta<br />
1986, 181, 241.<br />
22. Zhu, D. Yaowu Fenxi Zazhi 1987, 7(2), 83.<br />
23. Hassan, E.-M.; Gazy, A.-A.; Abdel-Hay, M.-H.; Belal, T.-S.<br />
Bull. Fac. Pharm. Cairo Univ. 2006, 44(2), 185.<br />
24. Ferraro, M.-C.-F.; Castellano, P.-M.; Kaufman, T.-S. J.<br />
Pharm. Biomed. Anal. 2004, 34(2), 305.<br />
25. European Drug Index, 4 th ed.; Muller, N.-F.; Dessing, R.-P.,<br />
Eds.; European Society <strong>of</strong> Clinical Pharmacy: Deutscher<br />
Apotheker Verlag Stuttgart, 1997; p 826.<br />
26. Medicines Compendium; Datapharm Communications Ltd:<br />
London, 2002; p 1290.<br />
27. Guidance for Industry; Q2B Validation <strong>of</strong> Analytical Procedures:<br />
Methodology; International Conference on Harmonization<br />
(ICH), November 1996, please visit at http://www.<br />
fda.gov/eder/guidance/1320fnl.pdf.<br />
28. Miller, J.-N.; Miller, J.-C. Statistics <strong>and</strong> Chemometrics for<br />
Analytical Chemistry, 4 th ed.; Prentice Hall: Harlow, 2000;<br />
pp 57-64, 77-78, 184-187.