Ionospheric Research at SANSA using Ionosondes, HF Doppler ...
Ionospheric Research at SANSA using Ionosondes, HF Doppler ...
Ionospheric Research at SANSA using Ionosondes, HF Doppler ...

You also want an ePaper? Increase the reach of your titles
YUMPU automatically turns print PDFs into web optimized ePapers that Google loves.
<strong>Ionospheric</strong> Monitoring: Africa<br />
Workshop<br />
24-25 January 2013<br />
<strong>Ionospheric</strong> <strong>Research</strong> <strong>at</strong><br />
<strong>SANSA</strong> <strong>using</strong> <strong>Ionosondes</strong>, <strong>HF</strong><br />
<strong>Doppler</strong> Radar and GPS<br />
Zama T K<strong>at</strong>amzi, Lee-Anne McKinnell, John Bosco<br />
Habarulema, Nicholas Ssessanga and Vumile<br />
Tyalimpi
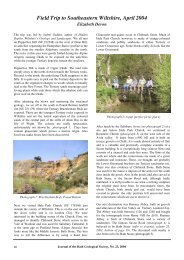
L<strong>at</strong>itude [degrees]<br />
Instruments - <strong>Ionosondes</strong><br />
-18<br />
-20<br />
-22<br />
Madimbo<br />
-24<br />
-26<br />
-28<br />
-30<br />
Louisvale<br />
• Frequency range: 0.1 – 30 MHz<br />
• Sampling period: 15 minutes<br />
• Currently only three radars are<br />
working<br />
• Measures only bottomside<br />
ionosphere<br />
-32<br />
-34<br />
-36<br />
Grahamstown<br />
Hermanus<br />
15 20 25 30 35<br />
Longitude [degrees]
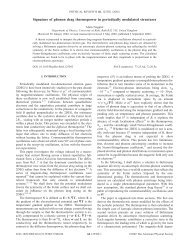
Instruments – <strong>HF</strong> <strong>Doppler</strong> Radar<br />
• Three transmitter:<br />
CPN, WCT, ARN<br />
• 1 receiver: HER<br />
• Oper<strong>at</strong>ing freq:<br />
3.594 MHz ± 4 Hz<br />
• Sampling freq:<br />
315.1 Hz<br />
– 16384 d<strong>at</strong>a<br />
samples per<br />
minute<br />
• Oper<strong>at</strong>ion: since<br />
May 2010<br />
93 km<br />
87 km<br />
94 km<br />
System developed <strong>at</strong> the Institute of Atmospheric Physics, Czech Republic;<br />
Chum et al (2010) in JGR, 115, A11322
Spectrogram
Instruments – GPS Receivers<br />
• About 60 GPS receivers in South Africa<br />
• D<strong>at</strong>a access through the N<strong>at</strong>ional Geosp<strong>at</strong>ial Inform<strong>at</strong>ion’s Trignet server
<strong>Ionospheric</strong> wave structures<br />
• Quasi periodic (wave-like) perturb<strong>at</strong>ions, e.g. traveling ionospheric<br />
disturbances (TIDs) in ionospheric measurement a common fe<strong>at</strong>ure, even<br />
during geomagnetically quiet conditions<br />
• Important questions rel<strong>at</strong>es to sources and energy transport<strong>at</strong>ion<br />
• Questions can be answered by extensive observ<strong>at</strong>ions and characteris<strong>at</strong>ions<br />
• Characteris<strong>at</strong>ion will ultim<strong>at</strong>ely be good for space we<strong>at</strong>her applic<strong>at</strong>ions, such<br />
as gre<strong>at</strong>er accuracy in predictions of useful frequencies.<br />
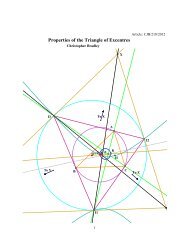
• Continuous wavelet transform used to obtain temporal vari<strong>at</strong>ion of period of<br />
wave structures Morlet wavelet
fof2 [MHz]<br />
Period [hours]<br />
foF2 [MHz]<br />
period [hours]<br />
TIDs with <strong>Ionosondes</strong><br />
4<br />
3<br />
2<br />
GRHM 31-Mar-2001<br />
6<br />
4<br />
2<br />
4<br />
3<br />
2<br />
1<br />
GRHM 18-Aug-2011<br />
1.2<br />
1<br />
0.8<br />
0.6<br />
0.4<br />
0.2<br />
4 6 8 10 12 14 16 18 20<br />
4 6 8 10 12 14 16 18 20<br />
15<br />
10<br />
5<br />
0<br />
4<br />
3<br />
2<br />
GRHM<br />
31-Mar-2001<br />
2 4 6 8 10 12 14 16 18 20 22 24<br />
Time [UT]<br />
4 6 8 10 12 14 16 18 20<br />
8<br />
6<br />
6<br />
4<br />
4<br />
2<br />
2<br />
4<br />
3<br />
2<br />
1<br />
GRHM<br />
18-Aug-2011<br />
2 6 8 10 12 14 16 18 20 22 24<br />
4 6 8 10 12 14 16 18 20<br />
Time [UT]<br />
1.2<br />
1<br />
0.8<br />
0.6<br />
0.4<br />
0.2<br />
10<br />
7<br />
8<br />
6<br />
6 8 10 12 14<br />
6<br />
5<br />
10 12 14
St<strong>at</strong>istics for year 2001<br />
Grahamstown Hermanus Louisvale Madimbo Total %<br />
Total d<strong>at</strong>a 240 ---------- 85 146 471 ----<br />
Total wave activity 30 ---------- 3 16 39 8<br />
Summer (Dec-Feb) 5 ---------- 1 0 6 15<br />
Autumn (Mar-May) 6 ---------- 1 4 11 28<br />
Winter (Jun-Aug) 14 ---------- 0 11 25 64<br />
Spring (Sep-Nov) 5 ---------- 1 1 7 18<br />
Average Periods Grahamstown Hermanus Louisvale Madimbo<br />
Summer 2.0 – 3.0 ---------- 2.5 – 3.5 ----------<br />
Autumn 2.5 – 3.5 ---------- 2.5 – 3.0 3.0 – 3.5<br />
Winter 2.5 – 3.0 ---------- ----------- 2.5 – 3.5<br />
Spring 2.0 – 3.0 ---------- 2.5 – 3.0 2.5 – 3.0<br />
• Only large scale waves detected (i.e periods > 1 hr)<br />
• Most wave activity in winter and longer periods in autumn
St<strong>at</strong>istics for year 2011<br />
Days Grahamstown Hermanus Louisvale Madimbo Total %<br />
Total d<strong>at</strong>a 179 175 145 134 633 ---<br />
Total wave activity 26 21 09 15 71 11<br />
Summer (Dec-Feb) 5 3 0 2 10 14<br />
Autumn (Mar-May) 9 8 2 3 22 31<br />
Winter (Jun-Aug) 12 8 7 9 36 51<br />
Spring (Sep-Nov) 0 2 0 1 3 4<br />
Average Periods Grahamstown Hermanus Louisvale Madimbo<br />
Summer 2.0 – 3.5 2.5 – 3.5 --------- 3.0 – 3.5<br />
Autumn 3.0 – 3.5 3.0 – 3.5 3.0 2.5 – 3.0<br />
Winter 2.5 – 3.0 2.5 – 3.0 2.5 – 3.0 2.5 – 3.0<br />
Spring ----------- 3.0 – 4.0 ----------- 3.0 – 4.0<br />
Wave activity<br />
slightly gre<strong>at</strong>er<br />
<strong>at</strong> lower solar<br />
activity<br />
• Only large scale waves detected (i.e periods > 1 hr)<br />
• Most wave activity in winter and longer periods in spring
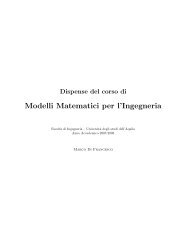
foF2 [MHz]<br />
period [hours]<br />
• Distortion of results due to autom<strong>at</strong>ic scaling manual editing of d<strong>at</strong>a<br />
needed<br />
• Sampling period limits observ<strong>at</strong>ions of large scale wave structures<br />
• Propag<strong>at</strong>ion characteristics challenging<br />
4<br />
3<br />
2<br />
1<br />
Limit<strong>at</strong>ions<br />
Gre<strong>at</strong> distances between ionosonde st<strong>at</strong>ions (distances between roughly<br />
680 km and 1755 km)<br />
scarcity of observ<strong>at</strong>ions of same structure (same period, same day) in<br />
multi st<strong>at</strong>ions<br />
GRHM 30-Mar-2011<br />
4 6 8 10 12 14 16 18 20<br />
2.5<br />
2<br />
1.5<br />
1<br />
0.5<br />
12<br />
8<br />
4<br />
0<br />
0 2 4 6 8 10 12 14 16 18 20 22 24<br />
time [UT]
TIDs with GPS: SADM-GPS technique<br />
• To first approxim<strong>at</strong>ion, assume wave structures are represented as plane solitary<br />
travelling wave<br />
where A is the wave amplitude, k x , k y are the x and y projections of the wave vector k, Ω,<br />
and are the angular disturbance frequency and initial disturbance phase respectively<br />
• The azimuthal propag<strong>at</strong>ion direction of the phase wave front and TID’s<br />
horizontal phase velocity, v h (t) can be computed <strong>using</strong>:<br />
Where I’ x (t), I’ y (t) and I’ t (t) are the sp<strong>at</strong>ial<br />
and time deriv<strong>at</strong>ives, u x (t), u y (t) are the<br />
propag<strong>at</strong>ion velocities of the phase front<br />
along the x and y axes (assumed in east and<br />
north directions) in the frame of reference,<br />
and w x (t), w y (t), are the x and y projections<br />
of the sub-ionospheric intersection velocity.<br />
Afraimovich et al, 2003, JASTP, 65, 1245-1262
where A H , A K and A P are the TEC perturb<strong>at</strong>ions of 3 GPS receivers respectively, x P ,<br />
y P , and x K and y K are the coordin<strong>at</strong>e distances of the receivers in a Cartesian system
Preliminary results<br />
• KRUG – HRAO-PRET: 26 September 2011
TIDs with <strong>HF</strong> <strong>Doppler</strong><br />
• Propag<strong>at</strong>ion of medium scale TIDs:<br />
– Wavelengths less than 1000 km<br />
– Periods between 15 and 1 hour<br />
– Average horizontal speeds of ~ 150 m/s
Propag<strong>at</strong>ion Characteris<strong>at</strong>ion<br />
• Time delays obtained by cross-correl<strong>at</strong>ing a pair of traces:<br />
• Periods obtained from wavelet analysis<br />
• Horizontal wavelengths and velocities calcul<strong>at</strong>ed from distances between<br />
transmitters and time delays of traces<br />
– Unrealistic velocities and wavelengths results, need more work.<br />
dt/[min] dx/[km] vx/[m/s] dy/[km] vy/[m/s] dd/[km] v/[m/s] T/[min] λ/[km]<br />
Wor-Cpt: -1.5167 -44.95 +493.93 -16.28 +178.88 +47.80 +525.32 +39.89 +1257.38<br />
Wor-Arn: +0.8500 39.54 +775.27 -53.23 -1043.82 +66.31 +1300.23 +41.53 +3240.14<br />
Cpt-Arn: +2.4667 +84.16 +568.68 -36.96 -249.71 +91.92 +621.09 +36.16 +1347.67
Electron density irregularities during<br />
storm conditions<br />
• Magnetic storm is an extreme event of space we<strong>at</strong>her which drive/gener<strong>at</strong>e<br />
ionospheric irregularities/disturbances, which in turn might cause signal<br />
scintill<strong>at</strong>ion<br />
• Magnetic storms cause significant devi<strong>at</strong>ions of electron densities from their<br />
normal behaviour by modifying the thermospheric composition<br />
• The ionospheric response to the storm is mainly positive and neg<strong>at</strong>ive<br />
referring to the increase and decrease in electron density respectively<br />
• Magnetic storm of interest: 06-12 November 2004
Storm indic<strong>at</strong>ors: 6-12 Nov 2004<br />
• Red arrows: Approxim<strong>at</strong>e times of sudden storm commencements (SSC)<br />
• SSC: abrupt increase/decrease in the H component
Loc<strong>at</strong>ion of Instruments Used<br />
• GPS/IGS: NKLG, MBAR, MALI, SBOK, SUTH<br />
• Ionosonde: MDBO, GRTN<br />
• magnetometers: BNG, AAE
Equ<strong>at</strong>orial and midl<strong>at</strong>itude regions<br />
• TEC peaks over NKLG occurred <strong>at</strong> ~ 12:00 and 18:00 UT for 08 and 10 Nov 2004<br />
respectively indic<strong>at</strong>ion th<strong>at</strong> driving mechanism could have been oriented in<br />
the westward direction
• Taking into account time delay of the occurrence of<br />
the wavelike structure, propag<strong>at</strong>ion velocity was<br />
computed as ~ 407 m/s and 440 m/s for MALI-MBAR<br />
and MBAR-NKLG observ<strong>at</strong>ion TID<br />
• Observed structure with estim<strong>at</strong>ed average max<br />
amplitude of 6 and 7 TECU (7-11 Nov 2004): partly<br />
responsible for shift in TEC enhancement
• Intense joule and particle he<strong>at</strong>ing cause by storm lead to wind driven motion of the<br />
<strong>at</strong>mosphere around the auroral oval<br />
• Strong upwelling transports N2 rich (O2 depleted) air from lower thermosphere to the F-<br />
region<br />
• Neutral winds then redistribute the N2 rich air over the high and part of the midl<strong>at</strong>itude<br />
which l<strong>at</strong>er causes a reduction in electron density
Africa <strong>Ionospheric</strong> Map (AIM)<br />
• <strong>Ionospheric</strong> map: essentially a computer program th<strong>at</strong> shows<br />
sp<strong>at</strong>ial and temporal represent<strong>at</strong>ion of ionospheric parameters,<br />
e.g. electron density, etc<br />
• D<strong>at</strong>a sources/input: ionosonde network, South African Bottomside<br />
<strong>Ionospheric</strong> Model (SABIM), Intern<strong>at</strong>ional Reference Ionosphere<br />
(IRI) Model<br />
• Best fit between d<strong>at</strong>a and models used to produce the interface<br />
map over Africa
Interface of the map<br />
A<br />
B<br />
C<br />
D<br />
E
Results: foF2 Map
Results: M3000F2 determin<strong>at</strong>ion
Results: TEC Map
Future Work<br />
• Install<strong>at</strong>ion of more<br />
ionosonde over Africa is<br />
needed<br />
• Include GPS d<strong>at</strong>a<br />
• Accessibility of real time<br />
d<strong>at</strong>a<br />
– Occult<strong>at</strong>ion d<strong>at</strong>a, for<br />
horizontal sp<strong>at</strong>ial<br />
distribution of<br />
ionosphere<br />
Original Ionosonde st<strong>at</strong>ions
Thank You