c - usaid
c - usaid
c - usaid

Create successful ePaper yourself
Turn your PDF publications into a flip-book with our unique Google optimized e-Paper software.
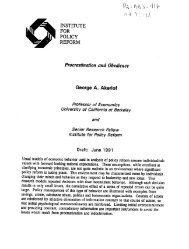
53<br />
1986 1991 1996 2001<br />
Total natural fartility 9.54 9.66 9.87 10.03<br />
r a t e ( T N F 111<br />
Index of marreige (C ) 0.835 0.830 0.825 0.820<br />
Index of conI ra- (C 3<br />
C"<br />
0.7158 0.6125 0 .5305 0.4528<br />
opt ion<br />
Index of induced(C a 0.9818 0.9772 0. 725 0.9664<br />
abortion<br />
Index of post- (C] 0.6237 0.6315 0.6450 0.6559<br />
partum infocundab<br />
i Li ty<br />
We mentioned in suction 3 that, by considering the number of<br />
births to women in two broad ago-groups, nameLy 15-29 and 30-49,<br />
and by referring to thesa as B and B 2, it i s possble to locate<br />
graphically where the point (61 ,B is likely to lie. Thia can<br />
now<br />
be i L L s t rated by referring to the same graph that wa drew in<br />
Figure 3.1. We find that values of B and B 2 according to the<br />
four patterns in 1991 are as shown below:-<br />
Pattern B E<br />
1 2<br />
I 2,986 1,199<br />
II 2,889 1,233<br />
III 2,859 1,243<br />
IV 2,939 1,198<br />
The points (B I B 2 corresponding to these values lie on the<br />
segment marked CT on the TFR-targ.t line (or in an area adjacent<br />
to it) in fig. 3.1. It is clear that the CBR-target line will<br />
have to be pushed to the right to achieve consistency with these<br />
estimates.<br />
Simi Lar graphs can be drawn for other years as well.