4. Structure of Dark Matter halos Obviously, we cannot observe the ...
4. Structure of Dark Matter halos Obviously, we cannot observe the ...
4. Structure of Dark Matter halos Obviously, we cannot observe the ...

Create successful ePaper yourself
Turn your PDF publications into a flip-book with our unique Google optimized e-Paper software.
6-4-10see http://www.strw.leidenuniv.nl/˜ franx/college/galaxies10 10-c04-1<br />
<strong>4.</strong> <strong>Structure</strong> <strong>of</strong> <strong>Dark</strong> <strong>Matter</strong> <strong>halos</strong><br />
<strong>Obviously</strong>, <strong>we</strong> <strong>cannot</strong> <strong>observe</strong> <strong>the</strong> dark matter <strong>halos</strong><br />
directly - but <strong>we</strong> can measure <strong>the</strong> total density pr<strong>of</strong>iles<br />
<strong>of</strong> clusters, and <strong>we</strong> can check in our simulations what<br />
<strong>we</strong> expect for dark matter <strong>halos</strong>.<br />
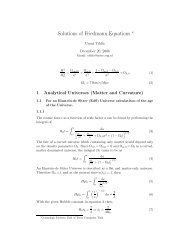
<strong>4.</strong>1 Theory <strong>of</strong> halo collapse<br />
We define a halo as a region in which <strong>the</strong> density is<br />
larger than 200 times <strong>the</strong> critical density ρcr. This definition<br />
serves <strong>we</strong>ll to describe <strong>the</strong> collapsed part <strong>of</strong> <strong>the</strong><br />
halo.<br />
Hence <strong>the</strong> mass M is given by<br />
M = 4π<br />
3 r3 200200ρcr<br />
Since <strong>the</strong> critical density is given by<br />
<strong>we</strong> find<br />
ρcr(z) = 3H2 (z)<br />
8πG<br />
M = 100r3 200H 2 (z)<br />
G<br />
Hence <strong>the</strong> halo mass and <strong>the</strong> size are uniquely related -<br />
and <strong>the</strong> relation changes as a function <strong>of</strong> redshift.<br />
The virial velocity <strong>of</strong> <strong>the</strong> halo is <strong>the</strong> circular velocity at<br />
<strong>the</strong> virial radius<br />
V 2<br />
200 = GM<br />
r200<br />
6-4-10see http://www.strw.leidenuniv.nl/˜ franx/college/galaxies10 10-c04-2<br />
Hence <strong>the</strong> halo mass, virial radius, and virial velocity<br />
are related by<br />
M =<br />
V 3<br />
200<br />
10GH(z)<br />
r200 = V200<br />
10H(z)<br />
The Hubble constant H(z) increases with lookback<br />
time. Hence at higher redshift, <strong>the</strong> size <strong>of</strong> a halo <strong>of</strong> a<br />
given mass is smaller than <strong>the</strong> size <strong>of</strong> a halo with <strong>the</strong><br />
same mass at low redshift. Halos are more compact<br />
and denser at high redshift, which is exactly what <strong>we</strong><br />
expect, as <strong>the</strong> density <strong>of</strong> <strong>the</strong> universe is higher at high<br />
redshift (by (1 + z) 3 ).<br />
Simulations show that <strong>the</strong> density pr<strong>of</strong>iles <strong>of</strong> <strong>halos</strong> are<br />
<strong>we</strong>ll approximated by a Navarro Frenk White pr<strong>of</strong>ile<br />
(1997):<br />
ρ(r) =<br />
ρs<br />
(r/rs)(1 + r/rs) 2<br />
where ρs and rs are scaling parameters. Hence at very<br />
small radii (r < rs), ρ ∝ r −1 , and at large radii (r ><br />
rs) ρ ∝ r −3 . At rs, <strong>the</strong> slope <strong>of</strong> <strong>the</strong> density pr<strong>of</strong>ile<br />
bends over.<br />
We define a concentration parameter c by c = r200/rs.<br />
It is easy to show that<br />
ρs = 200<br />
3 ρcr(z)<br />
c3 ln(1 + c) − c/(1 + c)<br />
Hence <strong>the</strong> pr<strong>of</strong>ile <strong>of</strong> <strong>the</strong> halo is completely determined<br />
by <strong>the</strong> mass M (or equivalently, <strong>the</strong> radius r200), and<br />
<strong>the</strong> concentration paramater c.
6-4-10see http://www.strw.leidenuniv.nl/˜ franx/college/galaxies10 10-c04-3<br />
Simulations show that <strong>the</strong> concentration index is strongly<br />
correlated with <strong>the</strong> mass and <strong>the</strong> redshift. Approximately<br />
c ∝<br />
−1/9 M<br />
(1 + z) −1<br />
M∗<br />
where M∗ is <strong>the</strong> charateristic halo mass at a given<br />
mass (similar to <strong>the</strong> Schechter L∗ for <strong>the</strong> luminosity<br />
function <strong>of</strong> galaxies, and z is <strong>the</strong> redshift <strong>of</strong> <strong>the</strong> halo.<br />
Hence low mass <strong>halos</strong> have higher concentration.<br />
The figures below shows <strong>the</strong> fits to <strong>halos</strong> from simulations<br />
6-4-10see http://www.strw.leidenuniv.nl/˜ franx/college/galaxies10 10-c04-4
6-4-10see http://www.strw.leidenuniv.nl/˜ franx/college/galaxies10 10-c04-5<br />
<strong>4.</strong>2 Comparison to observations<br />
The easiest test to make, is to compare <strong>the</strong> density<br />
pr<strong>of</strong>iles <strong>of</strong> clusters to those <strong>of</strong> <strong>the</strong> simulations (<strong>the</strong><br />
NFW pr<strong>of</strong>iles, and variants).<br />
Below <strong>we</strong> show <strong>the</strong> comparison <strong>of</strong> mass pr<strong>of</strong>iles derived<br />
from X-ray data to those <strong>of</strong> NFW pr<strong>of</strong>iles:<br />
It is remarkable how good <strong>the</strong> fit is, and <strong>the</strong> concentration<br />
index is <strong>we</strong>ll within <strong>the</strong> limits expected for <strong>the</strong><br />
clusters.<br />
Ano<strong>the</strong>r (simpler) way to do this, is by looking at <strong>the</strong><br />
distribution <strong>of</strong> <strong>the</strong> galaxies within <strong>the</strong> clusters. Again,<br />
a good fit is found:<br />
6-4-10see http://www.strw.leidenuniv.nl/˜ franx/college/galaxies10 10-c04-6
6-4-10see http://www.strw.leidenuniv.nl/˜ franx/college/galaxies10 10-c04-7<br />
Halo <strong>Structure</strong> <strong>of</strong> galaxies<br />
For galaxies, it is much harder to measure <strong>the</strong> dark<br />
matter halo structure. Gas velocity curves do not extend<br />
far enough. Just as an exercise, estimate <strong>the</strong> virial<br />
radius <strong>of</strong> a galaxy like our own Milky Way. Just assume<br />
that V200 = 150km/s. For r200 <strong>we</strong> would derive<br />
150/(10 ∗ 70) Mpc = 210 kpc, very much beyond <strong>the</strong><br />
sizes <strong>of</strong> (gas) disks.<br />
Hence <strong>we</strong> need different tracers to estimate <strong>the</strong> masses<br />
and mass pr<strong>of</strong>iles. Options are:<br />
• 1. kinematics <strong>of</strong> satellite galaxies<br />
• 2. kinematics <strong>of</strong> very distant stars<br />
• 3. deflection <strong>of</strong> light<br />
Below <strong>we</strong> show some examples.<br />
1) Satellites. The SDSS project has measured a large<br />
number <strong>of</strong> velocities <strong>of</strong> galaxies. Some <strong>of</strong> <strong>the</strong>se galaxies<br />
are close toge<strong>the</strong>r on <strong>the</strong> sky, and sometimes, <strong>the</strong>se<br />
galaxies are bound. Usually, a galaxy has only 1 satellite<br />
galaxy with a measured velocity. To still allow <strong>the</strong><br />
measurement <strong>of</strong> a signal, <strong>we</strong> combine all <strong>the</strong> satellite<br />
galaxy-main galaxy pair. We restrict <strong>the</strong> main galaxies<br />
to those galaxies with similar luminosity.<br />
By careful analysis, <strong>the</strong> velocity dispersion <strong>of</strong> <strong>the</strong> satellite<br />
system can be measured. Prada et al (2003) found<br />
this results:<br />
6-4-10see http://www.strw.leidenuniv.nl/˜ franx/college/galaxies10 10-c04-8<br />
The results are very nicely described by an NFW pr<strong>of</strong>ile.<br />
2. Kinematics <strong>of</strong> very distant stars. This method is<br />
most easily applied to our own galaxy (but studies <strong>of</strong><br />
external galaxies are coming !). A very recent example<br />
is shown below (Xue et al. 2008):
6-4-10see http://www.strw.leidenuniv.nl/˜ franx/college/galaxies10 10-c04-9<br />
The authors <strong>we</strong>re able to measure <strong>the</strong> velocity dispersion<br />
to 60kpc. This is a record - but still much smaller<br />
than <strong>the</strong> virial radius r200 which is at <strong>the</strong> level <strong>of</strong> 200<br />
kpc.<br />
3. Gravitational deflection <strong>of</strong> light. This method relies<br />
on <strong>the</strong> bending <strong>of</strong> light through gravity. A beautiful<br />
example is when <strong>the</strong> galaxy produces an Einstein ring<br />
<strong>of</strong> a source behind it.<br />
6-4-10see http://www.strw.leidenuniv.nl/˜ franx/college/galaxies10 10-c04-10<br />
In this case, two galaxies are located nearly precisely<br />
behind ano<strong>the</strong>r. The mass inside <strong>the</strong> ring is <strong>we</strong>ll determined.<br />
Ho<strong>we</strong>ver, this method does not extend to<br />
very large radii - one would have to analyze <strong>the</strong> <strong>we</strong>aker<br />
deflections. This is possible, but much harder.<br />
Problems with dark matter <strong>halos</strong> and real<br />
galaxies<br />
Generally, two problems exist: some galaxies may have<br />
ra<strong>the</strong>r large central cores (larger than expected in <strong>the</strong><br />
NFW pr<strong>of</strong>iles), and <strong>the</strong> dark matter <strong>halos</strong> in <strong>the</strong> simulations<br />
have too many “sub-<strong>halos</strong>”.<br />
• Cores<br />
Low surface brightness galaxies have rotation curves<br />
which rise slowly. This is unexpected for galaxies with<br />
NFW <strong>halos</strong>. Naray et al 2007 (arxiv: 0712.0860) show<br />
this result:
6-4-10see http://www.strw.leidenuniv.nl/˜ franx/college/galaxies10 10-c04-11<br />
Fits with NFW pr<strong>of</strong>iles are hard. The rise <strong>of</strong> <strong>the</strong> rotation<br />
curve is too slow:<br />
Ho<strong>we</strong>ver, it is possible that o<strong>the</strong>r processes play a role.<br />
For example, rotation may not dominate <strong>the</strong> gas kinematics.<br />
6-4-10see http://www.strw.leidenuniv.nl/˜ franx/college/galaxies10 10-c04-12<br />
• Substructure<br />
The <strong>halos</strong> from simulations look smooth - but are not<br />
as smooth as might be. Many show sub<strong>halos</strong>. An example<br />
is : (e.g., Springel et al. 2008, arxiv 0809.0898)
6-4-10see http://www.strw.leidenuniv.nl/˜ franx/college/galaxies10 10-c04-13 6-4-10see http://www.strw.leidenuniv.nl/˜ franx/college/galaxies10 10-c04-14<br />
The mass fraction in sub<strong>halos</strong> as a function <strong>of</strong> radius is<br />
given by <strong>the</strong> following plot
6-4-10see http://www.strw.leidenuniv.nl/˜ franx/college/galaxies10 10-c04-15<br />
In our own Milky Way, <strong>the</strong> number <strong>of</strong> satellites appears<br />
much smaller than predicted by <strong>the</strong> models:<br />
The solution for this problem is not clear. Are <strong>we</strong> missing<br />
a lot <strong>of</strong> satellites ? Or do <strong>we</strong> underestimate <strong>the</strong>ir<br />
mass ? Or is <strong>the</strong> dark matter model wrong ?<br />
Problem sets<br />
1) Derive <strong>the</strong> enclosed mass M(< r) for <strong>the</strong> NFW<br />
pr<strong>of</strong>ile ρ(r) = ρs/[(r/rs)(1 + r/r2) 2 ]. Use r/(1 + r) 2<br />
= 1/(r + 1) − 1/(1 + r) 2<br />
2) Derive <strong>the</strong> circular velocity as a function <strong>of</strong> radius<br />
6-4-10see http://www.strw.leidenuniv.nl/˜ franx/college/galaxies10 10-c04-16<br />
for <strong>the</strong> NFW pr<strong>of</strong>ile<br />
3) Approximate <strong>the</strong> rotation curve <strong>of</strong> UGC 4325 by a<br />
straight line, through (0 arcsec, 0 km/s) and (60 arcsec,<br />
110 km/s). What is <strong>the</strong> best fitting NFW model ?<br />
This would be <strong>the</strong> model for which<br />
χ 2 = � (Vobs − Vmodel) 2 dr is minimized.<br />
What is <strong>the</strong> average rms residual ? [(Vobs − Vmodel)] ?<br />
4) We can see from <strong>the</strong> figure from Springel et al. that<br />
about 30-40 % <strong>of</strong> <strong>the</strong> mass <strong>of</strong> a halo is in sub<strong>halos</strong>.<br />
This appears quite different from <strong>the</strong> situation in clusters,<br />
where <strong>the</strong> light is dominated by <strong>the</strong> ensemble <strong>of</strong><br />
regular cluster galaxies, and NOT by <strong>the</strong> brightest cluster<br />
galaxy. Can you think <strong>of</strong> an explanation ?