ÇUKUROVA UNIVERSITY INSTITUTE OF NATURAL AND APPLIED ...
ÇUKUROVA UNIVERSITY INSTITUTE OF NATURAL AND APPLIED ...
ÇUKUROVA UNIVERSITY INSTITUTE OF NATURAL AND APPLIED ...

You also want an ePaper? Increase the reach of your titles
YUMPU automatically turns print PDFs into web optimized ePapers that Google loves.
4. MODELING <strong>OF</strong> PROPOSED DVR Mustafa İNCİ<br />
L , C and<br />
f<br />
f<br />
R<br />
f<br />
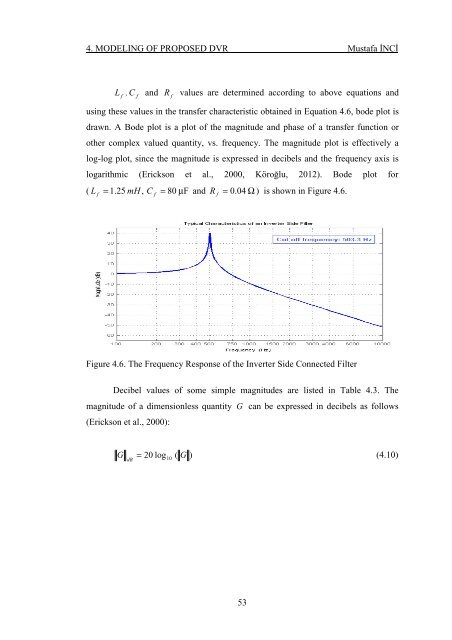
values are determined according to above equations and<br />
using these values in the transfer characteristic obtained in Equation 4.6, bode plot is<br />
drawn. A Bode plot is a plot of the magnitude and phase of a transfer function or<br />
other complex valued quantity, vs. frequency. The magnitude plot is effectively a<br />
log-log plot, since the magnitude is expressed in decibels and the frequency axis is<br />
logarithmic (Erickson et al., 2000, Köroğlu, 2012). Bode plot for<br />
( L f<br />
= 1.25<br />
mH , C = 80 µ F and R = 0.04 Ω ) is shown in Figure 4.6.<br />
f<br />
f<br />
Figure 4.6. The Frequency Response of the Inverter Side Connected Filter<br />
Decibel values of some simple magnitudes are listed in Table 4.3. The<br />
magnitude of a dimensionless quantity G can be expressed in decibels as follows<br />
(Erickson et al., 2000):<br />
G dB<br />
= 20 log10 ( G )<br />
(4.10)<br />
53