Sleep Deprivation in the Rat: III. Total Sleep Deprivation - iSites
Sleep Deprivation in the Rat: III. Total Sleep Deprivation - iSites
Sleep Deprivation in the Rat: III. Total Sleep Deprivation - iSites

You also want an ePaper? Increase the reach of your titles
YUMPU automatically turns print PDFs into web optimized ePapers that Google loves.
<strong>Sleep</strong><br />
12(1):13-21, Raven Press, Ltd., New York<br />
© 1989 Association of Professional <strong>Sleep</strong> Societies<br />
<strong>Sleep</strong> <strong>Deprivation</strong> <strong>in</strong> <strong>the</strong> <strong>Rat</strong>:<br />
<strong>III</strong>. <strong>Total</strong> <strong>Sleep</strong> <strong>Deprivation</strong><br />
Carol A. Everson, Bernard M. Bergmann, and Allan Rechtschaffen<br />
<strong>Sleep</strong> Research Laboratory, Departments of Psychiatry and Behavioral Sciences, University<br />
of Chicago, Chicago, Ill<strong>in</strong>ois, U.S.A.<br />
Summary: Ten rats were subjected to total sleep deprivation (TSD) by <strong>the</strong> disk<br />
apparatus. All TSD rats died or were sacrificed when death seemed imm<strong>in</strong>ent<br />
with<strong>in</strong> 11-32 days. No anatomical cause of death was identified. All TSD rats<br />
showed a debilitated appearance, lesions on <strong>the</strong>ir tails and paws, and weight<br />
loss <strong>in</strong> spite of <strong>in</strong>creased food <strong>in</strong>take. Their yoked control (TSC) rats rema<strong>in</strong>ed<br />
healthy. S<strong>in</strong>ce dehydration was ruled out and several measures <strong>in</strong>dicated accelerated<br />
use ra<strong>the</strong>r than failure to absorb nutrients, <strong>the</strong> food-weight changes<br />
<strong>in</strong> TSD rats were attributed to <strong>in</strong>creased energy expenditure (EE). The measurement<br />
of EE, based upon caloric value of food, weight, and wastes, <strong>in</strong>dicated<br />
that all TSD rats <strong>in</strong>creased EE, with mean levels reach<strong>in</strong>g more than<br />
twice basel<strong>in</strong>e values. Key Words: <strong>Total</strong> sleep deprivation-Debilitation-Sk<strong>in</strong><br />
lesions-Food and weight-Energy expenditure.<br />
In a previous study with <strong>the</strong> disk apparatus (1), total sleep deprivation (TSD) produced<br />
death, diverse pathology, and weight loss <strong>in</strong> spite of <strong>in</strong>creased food <strong>in</strong>take. The<br />
present TSD study was undertaken to replicate those results and to obta<strong>in</strong> additional<br />
data, which might help expla<strong>in</strong> <strong>the</strong>m.<br />
METHOD<br />
Procedures and nomenclature were described <strong>in</strong> Part II <strong>in</strong> this series (2). Of 12 TSD<br />
runs started, two were discarded because <strong>the</strong> TSD rats were sacrificed after 4 and 7<br />
days when death seemed imm<strong>in</strong>ent, apparently due to histologically verified pneumococcal<br />
<strong>in</strong>fections. Because such <strong>in</strong>fections sometimes occur <strong>in</strong> normal rats after surgery<br />
and no o<strong>the</strong>r sleep-deprived rats showed similar <strong>in</strong>fections, <strong>the</strong> contribution of TSD to<br />
<strong>the</strong> pathology was not clear. Of <strong>the</strong> rema<strong>in</strong><strong>in</strong>g 10 runs, n<strong>in</strong>e were with <strong>in</strong>tracardiac<br />
cannulas.<br />
RESULTS AND DISCUSSION<br />
<strong>Sleep</strong> data<br />
In <strong>the</strong> 10 TSD rats, mean basel<strong>in</strong>e sleep quotas, as a percentage of total time, were:<br />
total sleep (TS) 53.4 ± 4.6 SD; paradoxical sleep (PS) 5.9 ± 0.4; non-rapid eye move-<br />
Accepted for publication August 1988.<br />
Address correspondence and repr<strong>in</strong>t requests to Dr. A. Rechtschaffen at <strong>the</strong> <strong>Sleep</strong> Research Laboratory,<br />
5743 S. Drexel Avenue, Chicago, IL 60637, U.S.A.<br />
13
14 C. A. EVERSON ET AL.<br />
ment (NREM) 47.5 ± 4.5; high EEG amplitude sleep (HS) 43.3 ± 4.5; low-amplitude<br />
sleep (LS) 4.2 ± 0.5. Percentages of basel<strong>in</strong>e values obta<strong>in</strong>ed dur<strong>in</strong>g deprivation were:<br />
TS 8.7 ± 1.9; PS 4.4 ± 1.7; NREM 9.2 ± 2.1; HS 4.9 ± 1.6; LS 54.7 ± 18.2. For yoked<br />
controls for TSD (TSC) rats, <strong>the</strong> basel<strong>in</strong>e percentages were: TS 52.8 ± 3.1; PS 5.7 ±<br />
0.8; NREM 47.1 ± 2.7; HS 42.8 ± 2.8; LS 4.3 ± 0.4. Percentages of basel<strong>in</strong>e obta<strong>in</strong>ed<br />
dur<strong>in</strong>g <strong>the</strong> experimental period were: TS 72.4 ± 10.4; PS 53.4 ± 12.0; NREM 74.7 ±<br />
10.4; HS 71.3 ± 11.6; LS 110.4 ± 14.0. Thus, except for LS-which constitutes a small<br />
percentage of sleep dur<strong>in</strong>g basel<strong>in</strong>e-TSD rats were severely deprived of all sleep<br />
stages, whereas TSC rats were only moderately deprived. On several outcome variables,<br />
TSC rats showed smaller changes from basel<strong>in</strong>e than TSD rats, but <strong>in</strong> <strong>the</strong> same<br />
direction. Ma<strong>in</strong>tenance of deprivation required disk rotation for a mean of 20.4 ± 4.6%<br />
of total time. Surpris<strong>in</strong>gly, rotation rate rema<strong>in</strong>ed fairly stable throughout deprivation.<br />
Means and standard deviations of percent rotation times for successive quarters of <strong>the</strong><br />
deprivation period were 21.2 ± 5.7,20.9 ± 3.9,21.6 ± 4.5, and 18.1 ± 4.1.<br />
Functional sleep loss <strong>in</strong> TSD rats is probably underestimated by <strong>the</strong> above data. Of<br />
<strong>the</strong> NREM sleep ofTSD rats dur<strong>in</strong>g deprivation, 52% was LS. This was not surpris<strong>in</strong>g<br />
s<strong>in</strong>ce LS frequently precedes or follows wakefulness (3), and TSD rats were awakened<br />
frequently. However, it is doubtful that LS serves critical functions as o<strong>the</strong>r sleep<br />
stages may. LS does not rebound from TSD (4). Also, <strong>the</strong> Pearson correlation between<br />
LS and survival time <strong>in</strong> TSD rats was r = - 0.65 (p < 0.10). In contrast, <strong>the</strong> correlation<br />
between survival time and amount of <strong>in</strong>cidental PS dur<strong>in</strong>g deprivation, was positive<br />
(r = 0.40, NS). Functionally relevant TS deprivation was probably closer to 95%. After<br />
-3 days of TSD, <strong>the</strong> deprived rats started to have sleep-onset PS periods, which<br />
<strong>in</strong>creased as sleep deprivation progressed. TSD rats were permitted a 2-3-m<strong>in</strong> period of<br />
sleep every few days to help <strong>in</strong> <strong>the</strong> adjustment of sleep detection criteria. Dur<strong>in</strong>g <strong>the</strong>se<br />
sleep samples, <strong>the</strong> average median latency from start of HS to start of PS was 41.9 ±<br />
19.9 s. Dur<strong>in</strong>g <strong>the</strong> last 2 days of basel<strong>in</strong>e, <strong>the</strong> average median latency was 8.78 ± 2.49<br />
m<strong>in</strong>. (In calculat<strong>in</strong>g latency, <strong>in</strong>trusions of 30 s or less of wakefulness were not counted<br />
as disrupt<strong>in</strong>g sleep cont<strong>in</strong>uity.)<br />
Survival results<br />
Of <strong>the</strong> 10 TSD rats, seven were sacrificed when death seemed imm<strong>in</strong>ent, and one<br />
died after 11 days of deprivation. A n<strong>in</strong>th TSD rat was orig<strong>in</strong>ally <strong>in</strong>tended for studies to<br />
evaluate recovery when sleep was permitted. In contrast to three o<strong>the</strong>r TSD rats that<br />
showed substantial recovery when deprivation was stopped (5) (Part IX of this series),<br />
this rat was un<strong>in</strong>tentionally allowed to pass beyond an apparent "po<strong>in</strong>t of no return. "<br />
Although <strong>the</strong> deprivation procedure was stopped (after 22 days), <strong>the</strong> rats showed only<br />
sporadic sleep and died 64 h later. Therefore, this rat was counted as a "TSD death"<br />
with survival time of 22 days-<strong>the</strong> po<strong>in</strong>t at which it probably would have been sacrificed<br />
had that been our orig<strong>in</strong>al <strong>in</strong>tention. The tenth TSD rat died accidentally dur<strong>in</strong>g a<br />
blood draw<strong>in</strong>g procedure after 14 days of deprivation. This rat was not <strong>in</strong>cluded <strong>in</strong><br />
calculations of survival time. However, for data analyzed by quarters of survival, and<br />
based upon <strong>the</strong> energy and appearance data of o<strong>the</strong>r TSD rats, this rat was judged to<br />
have completed three-fourths of <strong>the</strong> deprivation protocol. To ma<strong>in</strong>ta<strong>in</strong> a balanced statistical<br />
design, fourth quarter values for this rat were extrapolated by repeat<strong>in</strong>g third<br />
quarter values.<br />
Survival times for <strong>the</strong> n<strong>in</strong>e "term<strong>in</strong>al" TSD rats were 11, 16, 18,20, 21,22, 24,24,<br />
and 32 days (x = 20.9 ± 5.9), which was with<strong>in</strong> one SD of mean survival of 15.6 ± 9.8<br />
<strong>Sleep</strong>, Vol, 12, No.1, 1989
SLEEP DEPRIVATION: <strong>III</strong>. TOTAL DEPRIVATION 15<br />
days observed <strong>in</strong> our previous TSD study (1). At sacrifice or death, <strong>the</strong> n<strong>in</strong>e rats<br />
showed <strong>the</strong> follow<strong>in</strong>g signs: All appeared extremely debilitated; formally rated rats had<br />
rat<strong>in</strong>gs of 5.5 or 6.0 on <strong>the</strong> 1-6 appearance rat<strong>in</strong>g scale. Dur<strong>in</strong>g <strong>the</strong>ir last 24 h, seven rats<br />
showed temperature decl<strong>in</strong>es to more than 3 SDs below <strong>the</strong>ir <strong>in</strong>dividual basel<strong>in</strong>e means;<br />
<strong>the</strong> o<strong>the</strong>r two rats showed decl<strong>in</strong>es of more than 2 SDs. All showed marked decl<strong>in</strong>es<br />
from peak food <strong>in</strong>take (x = -34.6 ± 26.7%). All showed edema of <strong>the</strong> paws, rated as<br />
severe <strong>in</strong> four rats, moderate <strong>in</strong> three, and mild <strong>in</strong> two. Seven rats showed motor<br />
weakness and/or ataxia. Only two rats showed a notable decl<strong>in</strong>e <strong>in</strong> wak<strong>in</strong>g EEG amplitude.<br />
However, <strong>the</strong> number of disk rotations required to ma<strong>in</strong>ta<strong>in</strong> sleep deprivation<br />
<strong>in</strong> near-term<strong>in</strong>al TSD rats frequently decl<strong>in</strong>ed, which may partially reflect an <strong>in</strong>ability<br />
to generate high-amplitude EEG activity. No TSC rat ever showed any of <strong>the</strong> above<br />
signs or <strong>in</strong>dication that it could not have cont<strong>in</strong>ued to live under <strong>the</strong> same conditions.<br />
Appearance<br />
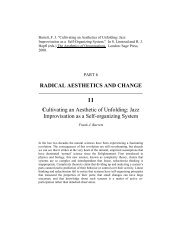
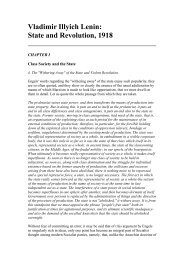
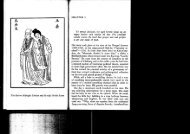
The appearance of TSC rats decl<strong>in</strong>ed only slightly dur<strong>in</strong>g deprivation, whereas <strong>the</strong><br />
appearance of TSD rats decl<strong>in</strong>ed sharply (Fig. O. Only seven of <strong>the</strong> 10 runs were<br />
photographed and rated, but TSD rats <strong>in</strong> <strong>the</strong> o<strong>the</strong>r three runs clearly showed <strong>the</strong> same<br />
debilitated appearance. The group x time <strong>in</strong>teraction <strong>in</strong> photograph rat<strong>in</strong>gs (F!,!3! =<br />
108.3) was significant at p < 0.001. TSD rats looked scrawny. Fur changed <strong>in</strong> color<br />
from creamy white to brownish yellow, looked disheveled, and stuck toge<strong>the</strong>r <strong>in</strong><br />
clumps as if it were oily; patches of sk<strong>in</strong> were visible between <strong>the</strong> clumps. Ulcerative<br />
and keratotic lesions, which will be described <strong>in</strong> more detail <strong>in</strong> Part VI of this series (6),<br />
developed on <strong>the</strong> tails and plantar surfaces. It is unlikely that <strong>the</strong> debilitated appearance<br />
resulted from failure to groom. Based on extrapolations from extensive videotap<strong>in</strong>g at<br />
regular <strong>in</strong>tervals dur<strong>in</strong>g <strong>the</strong> experimental period, two TSD rats were estimated to groom<br />
an average of3.62 and 3.83 h daily, whereas <strong>the</strong>ir respective controls averaged 2.51 and<br />
2.37 h. Whe<strong>the</strong>r groom<strong>in</strong>g was less careful or effective <strong>in</strong> TSD rats could not be<br />
determ<strong>in</strong>ed. The debilitated appearance is not <strong>in</strong>tr<strong>in</strong>sic to dy<strong>in</strong>g <strong>in</strong> <strong>the</strong> rat; six fooddeprived<br />
(FD) rats that died after a mean of 16.7 days had smooth, normally colored fur<br />
and showed no sk<strong>in</strong> lesions. They looked like healthy younger rats; mean appearance<br />
rat<strong>in</strong>g of four FD rats photographed just prior to death was 1.4 ± 0.25.<br />
Necropsy and histology<br />
With only <strong>in</strong>cidental exceptions, <strong>the</strong> <strong>in</strong>ternal organs ofTSC rats appeared normal. All<br />
TSD rats showed enlarged adrenals and an absence of observable body fat; connective<br />
1<br />
FIG. 1. Mean appearance rat<strong>in</strong>gs of<br />
TSD (-) and TSC (---) rats dur<strong>in</strong>g basel<strong>in</strong>e<br />
and successive quarters of experiment;<br />
1 <strong>in</strong>dicates completely healthy appearance,<br />
and 6 <strong>in</strong>dicates extremely debilitated<br />
appearance. Error bars <strong>in</strong>dicate<br />
standard errors of <strong>the</strong> mean.<br />
2<br />
3<br />
4<br />
5<br />
----~ ---..%...----I... ___ ~<br />
Basel<strong>in</strong>e<br />
2 3 4<br />
Quarters of Experi ment<br />
<strong>Sleep</strong>, Vol. 12, No. 1, 1989
16 C. A. EVERSON ET AL.<br />
tissue was frequently reduced to translucent membranes. O<strong>the</strong>rwise, <strong>the</strong>re was no<br />
observable pathology common to all TSD rats. Nei<strong>the</strong>r was <strong>the</strong>re any observable anatomical<br />
abnormality that could account for imm<strong>in</strong>ent or actual death. Pathological<br />
signs present <strong>in</strong> more than two rats <strong>in</strong>cluded putative "secondary" adrenals (at least<br />
five rats-but also seen <strong>in</strong> two TSC rats) and a blend<strong>in</strong>g of mesenteric nodes <strong>in</strong>to a<br />
cont<strong>in</strong>uous undifferentiated strand (eight rats). In several rats, <strong>the</strong>re was a brownish or<br />
maroonish cast <strong>in</strong> <strong>the</strong> color of <strong>the</strong> mesenteric mass, <strong>in</strong>gu<strong>in</strong>al nodes, and adrenal and<br />
thymus glands. No rats showed large crater-like or hemorrhag<strong>in</strong>g ulcers of <strong>the</strong> stomach<br />
l<strong>in</strong><strong>in</strong>g such as have been reported <strong>in</strong> stressed rats (e.g., refs. 7 and 8) or observed <strong>in</strong> all<br />
six of our FD rats; six TSD and one TSC rat did show p<strong>in</strong>po<strong>in</strong>t erosions of <strong>the</strong> stomach<br />
l<strong>in</strong><strong>in</strong>g.<br />
Histologic exam<strong>in</strong>ation by Dr. Lester Wold (Mayo Cl<strong>in</strong>ic, Rochester, MN) was limited<br />
to <strong>the</strong> lungs, s<strong>in</strong>ce <strong>the</strong>se would be vulnerable to water exposure. None of <strong>the</strong> eight<br />
TSD rats evaluated showed signs of pneumococcal <strong>in</strong>fection. O<strong>the</strong>r histology was not<br />
done, s<strong>in</strong>ce exam<strong>in</strong>ation of organ and bra<strong>in</strong> tissues (9) of rats <strong>in</strong> our orig<strong>in</strong>al TSD study<br />
(1) revealed no systematic differences between TSD and TSC rats or any microscopically<br />
identifiable lesions or abnormalities to account for <strong>the</strong> death and debilitation of<br />
TSD rats.<br />
Weights of spleen, liver, lungs, and bra<strong>in</strong> were not significantly different for TSD and<br />
TSC rats. In six pairs evaluated, hearts were heavier <strong>in</strong> TSD rats (x = 1.64 ± 0.22 g)<br />
than <strong>in</strong> TSC rats (x = 1.33 ± 0.25 g) (p < 0.05, paired t test). In n<strong>in</strong>e pairs evaluated,<br />
kidneys were heavier <strong>in</strong> TSD rats (x = 1.66 ± 0.22 g) than <strong>in</strong> TSC rats (x = 1.47 ± 0.16<br />
g) (p < 0.02); comb<strong>in</strong>ed adrenals (<strong>in</strong>clud<strong>in</strong>g putative secondary adrenals) were heavier<br />
<strong>in</strong> TSD rats (x = 0.097 ± 0.021 g) than <strong>in</strong> TSC rats (x = 0.061 ± 0.017 g) (p < 0.002).<br />
The <strong>in</strong>creased adrenal weights <strong>in</strong> TSD rats may have resulted from term<strong>in</strong>al stress. In<br />
two pairs that were sacrificed after deprivation effects (debilitated appearance, sk<strong>in</strong><br />
lesions, <strong>in</strong>creased energy expenditure) were clearly manifest, but well before <strong>the</strong> TSD<br />
rats appeared term<strong>in</strong>al, adrenal weights were similar <strong>in</strong> <strong>the</strong> TSC and TSD rats.<br />
Ion balance, hematology, and ur<strong>in</strong>e measures<br />
Serum potassium and sodium levels, which were evaluated at about 5-day <strong>in</strong>tervals<br />
<strong>in</strong> eight runs, rema<strong>in</strong>ed close to basel<strong>in</strong>e levels for both TSD and TSC rats throughout<br />
<strong>the</strong> deprivation period. Hematological evaluations were made at 5-day <strong>in</strong>tervals <strong>in</strong> eight<br />
runs. White cell counts <strong>in</strong>creased similarly and significantly for TSD and TSC rats,<br />
reach<strong>in</strong>g mean levels of 17.16 x 1Q3/f.L1 for TSD rats and 15.76 x 10³/f.LI for TSC rats.<br />
However, nei<strong>the</strong>r <strong>the</strong> group difference nor <strong>the</strong> group x time <strong>in</strong>teractions approached<br />
significance, and <strong>the</strong> fourth quarter means were with<strong>in</strong> normal limits for rats (10). Red<br />
cell counts rema<strong>in</strong>ed near basel<strong>in</strong>e for TSC rats, but, beg<strong>in</strong>n<strong>in</strong>g dur<strong>in</strong>g <strong>the</strong> third quarter,<br />
<strong>the</strong>y decl<strong>in</strong>ed for TSD rats, reach<strong>in</strong>g a mean fourth quarter level of 5.28 x 10 6 /f.L1. The<br />
group x time <strong>in</strong>teraction (F 1 ,59 = 4.9) was significant at p < 0.04. There were no<br />
significant group x time <strong>in</strong>teractions <strong>in</strong> any of <strong>the</strong> o<strong>the</strong>r blood parameters noted below.<br />
In TSD rats, <strong>the</strong>re were <strong>in</strong>creases of less than 5% <strong>in</strong> mean red cell volume and reticulocyte<br />
count, and less than 2% <strong>in</strong> hemoglob<strong>in</strong> per cell. On <strong>the</strong> o<strong>the</strong>r hand, hemoglob<strong>in</strong><br />
and hematocrit decreased by -10-15% dur<strong>in</strong>g <strong>the</strong> third and fourth quarters. This pattern<br />
suggests a macrocytic, ra<strong>the</strong>r than an iron deficiency anemia.<br />
There were no significant or substantial differences between <strong>the</strong> eight TSD and TSC<br />
rats (evaluated at 2-day <strong>in</strong>tervals) <strong>in</strong> <strong>the</strong> follow<strong>in</strong>g ur<strong>in</strong>e parameters: urobil<strong>in</strong>ogen,<br />
<strong>Sleep</strong>, Vol. 12, No.1, 1989
SLEEP DEPRIVATION: <strong>III</strong>. TOTAL DEPRIVATION<br />
I7<br />
nitrite, bilirub<strong>in</strong>, glucose, ketone, specific gravity, pH, prote<strong>in</strong>, and greater than trace<br />
amounts of blood.<br />
Food, weight, and energy expenditure<br />
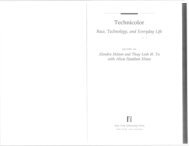
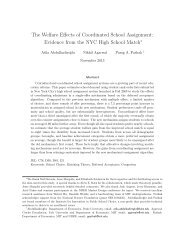
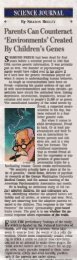
All TSD rats <strong>in</strong>creased food <strong>in</strong>take dur<strong>in</strong>g sleep deprivation (Fig. 2). The group x<br />
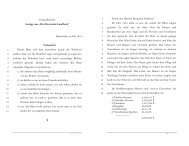
time <strong>in</strong>teraction (FI.374 = 21.60) was significant p < 0.001. Never<strong>the</strong>less, all TSD rats<br />
progressively lost weight (Fig. 3). The group x time <strong>in</strong>teraction (FI,374 = 54.3) was<br />
significant at p < 0.001. Mean percentage weight loss from basel<strong>in</strong>e to last deprivation<br />
day <strong>in</strong> <strong>the</strong> n<strong>in</strong>e term<strong>in</strong>al TSD rats was 17.3 ± 6.3% versus 8.0 ± 5.7% <strong>in</strong> <strong>the</strong>ir yoked<br />
controls.<br />
Weight loss alone could not account for <strong>the</strong> TSD deaths. Six FD rats were subjected<br />
to disk rotation cont<strong>in</strong>uously for 30 m<strong>in</strong> every 2 h. This schedule approximated <strong>the</strong><br />
energy demands imposed by rotation on <strong>the</strong> TSD rats, but permitted <strong>the</strong> FD rats to<br />
sleep dur<strong>in</strong>g <strong>the</strong> long nonrotation periods. FD rats survived until <strong>the</strong>y had lost a mean<br />
of 46.4 ± 5.5% body weight, more than double <strong>the</strong> weight loss of TSD rats. Mean<br />
survival was 16.7 ± 2.8 days. Of <strong>the</strong> six FD rats, four survived longer than two of <strong>the</strong><br />
of <strong>the</strong> n<strong>in</strong>e term<strong>in</strong>al TSD rats. <strong>Sleep</strong> cannot rank far beh<strong>in</strong>d food <strong>in</strong> survival value.<br />
TSC rats rema<strong>in</strong>ed near basel<strong>in</strong>e <strong>in</strong> water <strong>in</strong>take (amount removed from water bottles),<br />
whereas TSD rats <strong>in</strong>creased mean water <strong>in</strong>take by 14.1% dur<strong>in</strong>g sleep deprivation,<br />
with <strong>the</strong> greatest <strong>in</strong>crease observed dur<strong>in</strong>g <strong>the</strong> first quarter. Although <strong>the</strong> group x<br />
time <strong>in</strong>teraction (FI 374 = 6.2) was significant at p < 0.02, water <strong>in</strong>take varied markedly<br />
among and with<strong>in</strong> TSD rats, and <strong>the</strong> mean <strong>in</strong>crease was less than expected from <strong>the</strong><br />
food <strong>in</strong>crease (11,12). However, <strong>the</strong> water <strong>in</strong>take data are complicated by o<strong>the</strong>r factors:<br />
dr<strong>in</strong>k<strong>in</strong>g water from <strong>the</strong> pan, groom<strong>in</strong>g wet fur, <strong>in</strong>creased metabolic water, and a<br />
reduced water need result<strong>in</strong>g from lower body mass. Never<strong>the</strong>less, <strong>the</strong>re were ample<br />
data to <strong>in</strong>dicate that <strong>the</strong> TSD rats did not suffer from dehydration. Normal serum ion<br />
concentrations and ur<strong>in</strong>e specific gravity were ma<strong>in</strong>ta<strong>in</strong>ed throughout. Also, as will be<br />
reported <strong>in</strong> Part V of this series (13), TSD rats showed an <strong>in</strong>crease <strong>in</strong> total body water<br />
as a proportion oftotal body mass, as measured by <strong>the</strong> dilution of <strong>in</strong>jected 18 0. F<strong>in</strong>ally,<br />
changes <strong>in</strong> weight and water <strong>in</strong>take were essentially uncorrelated <strong>in</strong> TSD rats (r =<br />
0.06, NS).<br />
Weight loss of TSD rats, <strong>in</strong> spite of <strong>in</strong>creased food <strong>in</strong>take, did not result from decreased<br />
absorption or obvious perturbations of <strong>in</strong>termediary metabolism. In fact, <strong>the</strong>re<br />
FIG. 2. Mean food <strong>in</strong>take of 10 TSO<br />
TSC pairs. TSD (-) basel<strong>in</strong>e mean =<br />
25.3 g/day (SD = 2.3); TSC (---) = 26.6<br />
g (SD = 4.2).<br />
~<br />
I:<br />
~6 ....<br />
.£Q)<br />
01<br />
-ero<br />
0 ....<br />
01:<br />
LLQ)<br />
U<br />
Iii<br />
0.<br />
100<br />
80<br />
60<br />
40<br />
20<br />
0<br />
Basel<strong>in</strong>e<br />
2 3 4<br />
Quarters of Experi ment<br />
<strong>Sleep</strong>, Vol. 12, No.1, 1989
18 C. A. EVERSON ET AL.<br />
FIG. 3. Mean weights of 10 TSD-TSC<br />
pairs expressed as percentage change<br />
from basel<strong>in</strong>e mean. Error bars <strong>in</strong>dicate<br />
standard errors. TSD (-) basel<strong>in</strong>e mean<br />
= 409.2g(SD = 32.5);TSC(---) = 407.6<br />
g (SD = 28.9).<br />
j 0<br />
+-,0<br />
£<br />
.21 Ol -5<br />
0l0l<br />
~~<br />
§j<br />
t -10<br />
0..<br />
Basel<strong>in</strong>e<br />
2 3 4<br />
Quarters of Experi ment<br />
were <strong>in</strong>dications of accelerated use of all major nutrients. Absence of fatty stools<br />
<strong>in</strong>dicated normal absorption of fats, and accelerated use was suggested by <strong>the</strong> absence<br />
of body fat at necropsy. That <strong>the</strong>re were no gross perturbations <strong>in</strong> glucose use was<br />
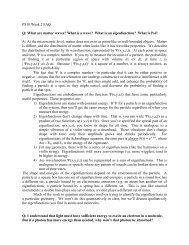
<strong>in</strong>dicated by <strong>the</strong> absence of hyperglycemia and ur<strong>in</strong>ary glucose. Glucose clearance tests<br />
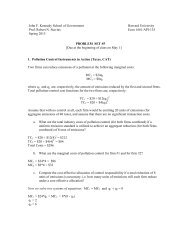
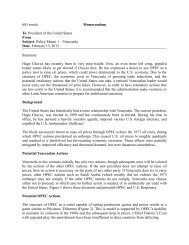
conducted at 7-day <strong>in</strong>tervals <strong>in</strong> eight runs (Fig. 4) <strong>in</strong>dicated enhanced glucose utilization.<br />
The difference between <strong>the</strong> basel<strong>in</strong>e and deprivation glucose clearance rates was<br />
significantly greater for TSD than for TSC rats (Fl.22 = 5.42; P < 0.03). (This analysis<br />
was done for deprivation as a whole, because glucose tolerance tests were not well<br />
distributed across quarters.) Serum levels of total prote<strong>in</strong> were ma<strong>in</strong>ta<strong>in</strong>ed near basel<strong>in</strong>e<br />
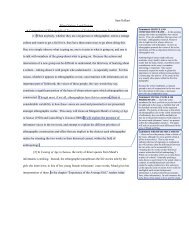
<strong>in</strong> both TSD and TSC rats. However, accelerated catabolism of prote<strong>in</strong>s <strong>in</strong> TSD<br />
rats was <strong>in</strong>dicated by a rise <strong>in</strong> plasma urea nitrogen (group x time <strong>in</strong>teraction,<br />
F 1 ,63 = 4.32; P < 0.05) (Fig. 5). Plasma globul<strong>in</strong>s tended (nonsignificantly) to rise <strong>in</strong><br />
TSD rats, but album<strong>in</strong> decreased (F 1 ,63 = 6.60; P < 0.02), which suggests prote<strong>in</strong><br />
malnutrition and a catabolic state (14). A mild and <strong>in</strong>consistent elevation <strong>in</strong> <strong>the</strong> plasma<br />
lactate:pyruvate ratio suggests a small oxygen debt for some, but not all, TSD rats.<br />
The evidence aga<strong>in</strong>st dehydration and blocked <strong>in</strong>termediary metabolism, and for<br />
(A) 2.70<br />
(8) 2.70<br />
~ " "<br />
'0<br />
~ \<br />
2.55 0, 2.55 \<br />
S<br />
S<br />
\'"<br />
Q)<br />
2.40<br />
$<br />
0 0<br />
:J<br />
2.25<br />
0<br />
\<br />
U) 2.40 \<br />
\<br />
U \<br />
g \<br />
(5 (5 2.25 \<br />
\<br />
,<br />
'8<br />
m "" Cl 1.95<br />
1.95<br />
""<br />
0<br />
...J<br />
"Of<br />
~ ~ 2.10 " "<br />
~<br />
...J<br />
1.80<br />
1.80<br />
10 20 30 40 50 60 10 20 30 40 50 60<br />
Postabsorptive (m<strong>in</strong>utes)<br />
Postabsorptive (mhrtes)<br />
FIG. 4. A (TSD rats) and B (TSC rats); Glucose tolerance curves for eight TSD-TSC pairs. Follow<strong>in</strong>g an 8-h<br />
fast, rats were <strong>in</strong>jected <strong>in</strong>travenously with 50% dextrose solution, 05. mIltoO g body weight. Ord<strong>in</strong>ate shows<br />
mean log blood glucose at postabsorptive <strong>in</strong>tervals of 15, 20, 30, 45, and 60 m<strong>in</strong>. <strong>Deprivation</strong> (-); basel<strong>in</strong>e<br />
(---).<br />
<strong>Sleep</strong>, Vol. 12, No.1, 1989
SLEEP DEPRIVATION: <strong>III</strong>. TOTAL DEPRIVATION 19<br />
FIG. 5. Mean plasma urea nitrogen for<br />
eight TSD-TSC pairs. TSD (-) basel<strong>in</strong>e<br />
mean = 23.5 mg/dl (SD = 4.7); TSC (---)<br />
= 23.9 mg/dl (SD = 3.0).<br />
c:<br />
Q)Q)<br />
0101<br />
ac:<br />
:e~<br />
Zu<br />
til Q)<br />
Q)0l<br />
::J~<br />
c:<br />
til Q)<br />
EU<br />
C1J~<br />
til Q)<br />
0::0...<br />
40<br />
30<br />
20<br />
10<br />
o<br />
-10<br />
Basel<strong>in</strong>e<br />
2 3 4<br />
Quarters of Experi ment<br />
FIG. 6. Mean energy expenditure of 10<br />
TSD-TSC pairs. TSD (-) basel<strong>in</strong>e =<br />
79.8 kcaIlday (SD = 11.7); TSC (---) =<br />
83.0 kcal/day (SD = 11.3).<br />
Q) Q)<br />
1...01<br />
:J c:<br />
~tIl<br />
'O..c:<br />
fj}U<br />
e.Q)<br />
XOI<br />
W tIl<br />
>.t:<br />
0lQ)<br />
I... U<br />
Q) ~<br />
c: Q)<br />
Wo...<br />
120<br />
90<br />
60<br />
30<br />
o<br />
./~---T----r---_<br />
./ '"l.<br />
./<br />
V<br />
...............................<br />
accelerated use of nutrients leaves <strong>in</strong>creased energy expenditure (EE) as <strong>the</strong> most likely<br />
explanation for both <strong>the</strong> weight loss and <strong>in</strong>creased food <strong>in</strong>take. Accord<strong>in</strong>gly, we calculated<br />
daily EE based upon food <strong>in</strong>take, weight change, and estimated wastes by <strong>the</strong><br />
formula described <strong>in</strong> Part II of this series (2). Mean EE <strong>in</strong>creased progressively <strong>in</strong> TSD<br />
rats to more than double basel<strong>in</strong>e values dur<strong>in</strong>g <strong>the</strong> third and fourth quarter (Fig. 6). The<br />
group x time <strong>in</strong>teraction (F 1 348 = 68.5) was significant at p < 0.001. In some rats, <strong>the</strong><br />
weight loss contributed mor~ to changes <strong>in</strong> EE than food <strong>in</strong>take, whereas <strong>in</strong> o<strong>the</strong>r rats<br />
<strong>the</strong> converse obta<strong>in</strong>ed. However, <strong>the</strong> similarity of EE changes <strong>in</strong> <strong>in</strong>dividual rats is<br />
reflected <strong>in</strong> <strong>the</strong> small standard errors <strong>in</strong> each quarter.<br />
In TSD rats, <strong>the</strong> correlation (across rats) between food <strong>in</strong>take and weight loss became<br />
progressively more negative <strong>in</strong> successive quarters (0.45, 0.29, -0.29, -0.48). This<br />
suggests that early <strong>in</strong> sleep deprivation both stored and new (food) energy were consumed<br />
as required by <strong>the</strong> rapidly <strong>in</strong>creas<strong>in</strong>g EE. As <strong>the</strong> rats approached limits of readily<br />
available energy stores, or ability to digest more food, or ability to <strong>in</strong>crease metabolic<br />
activity, a greater proportion of food energy may have been used for tissue preservation<br />
late <strong>in</strong> deprivation than early <strong>in</strong> deprivation.<br />
As would be expected <strong>in</strong> rats with high EE, TSD rats showed elevated heart rates.<br />
S<strong>in</strong>ce TSD rats were mostly awake, only <strong>the</strong> comparison for wak<strong>in</strong>g heart rate is shown<br />
<strong>in</strong> Fig. 7. The group x time <strong>in</strong>teraction (F 1 ,260 = 6.95) was significant at p < 0.01.<br />
No formal behavioral studies were performed. Frequent and prolonged observation<br />
<strong>in</strong>dicated that TSD rats alternated between periods of seem<strong>in</strong>gly normal activity punc-<br />
Basel<strong>in</strong>e<br />
2 3 4<br />
Quarters of Experi ment<br />
<strong>Sleep</strong>, Vol. 12, No. I, 1989
20 C. A. EVERSON ET AL.<br />
20<br />
FIG. 7. Mean heart rate dur<strong>in</strong>g awake <strong>in</strong><br />
seven TSD-TSC pairs. TSD (-) basel<strong>in</strong>e<br />
= 387.8 beats per m<strong>in</strong>ute (bpm) (SD =<br />
19.8); TSC (---) = 394.5 (SD = 21.7).<br />
10<br />
o<br />
_--r---T ---1<br />
~-:-.~~ ..................... .<br />
Basel<strong>in</strong>e<br />
2 3 4<br />
Quarters of Expert ment<br />
tuated by voracious eat<strong>in</strong>g and waves of sleep<strong>in</strong>ess that necessitated disk rotations <strong>in</strong><br />
rapid succession. The rats were not particularly aggressive.<br />
Immersion controls<br />
In <strong>the</strong> three TSD rats evaluated, <strong>the</strong>re were progressive <strong>in</strong>creases across quarters <strong>in</strong><br />
<strong>the</strong> mean number of water immersions per day: partial = 48, 196,291,416;full = 0, 14,<br />
38, 52. Mean total m<strong>in</strong>utes <strong>in</strong> water per day were as follows: partial = 4.4, 23.9, 27.3,<br />
41.2; full = 0, 0.4, 1.1, 1.1. Two immersion control (IC) rats were matched to each of<br />
<strong>the</strong>se three TSD rats for immersion rate by <strong>the</strong> procedures described earlier (2). All IC<br />
rats survived <strong>the</strong> schedule with no <strong>in</strong>dication whatsoever of impend<strong>in</strong>g death. None<br />
appeared debilitated; mean appearance rat<strong>in</strong>g on <strong>the</strong> last IC day (matched to survival<br />
times of TSD rats) was 1.6. Necropsy evaluations revealed no remarkable abnormalities.<br />
Organ weights were comparable to those ofTSC rats. There were m<strong>in</strong>or epidermal<br />
changes, which <strong>in</strong>cluded, <strong>in</strong> some IC rats, fur discoloration <strong>in</strong> <strong>the</strong> scrotal region and<br />
calloused areas or ery<strong>the</strong>matous papules (raised, <strong>in</strong>flamed areas) on <strong>the</strong> h<strong>in</strong>dpaws.<br />
None of<strong>the</strong>se changes remotely approached <strong>the</strong> severity of paw and tail lesions seen <strong>in</strong><br />
TSD rats. Energy changes <strong>in</strong> IC rats will be reviewed later (13). In summary, it is highly<br />
unlikely that water exposure contributed appreciably to <strong>the</strong> pathology and mortality of<br />
TSD rats.<br />
Acknowledgment: This work was supported by NIMH grants MH4151 and MH18428. A major<br />
portion of <strong>the</strong> work is from Carol A. Everson's doctoral dissertation. We thank Dr. Lester Wold<br />
of <strong>the</strong> Mayo Cl<strong>in</strong>ic, Rochester, MN for histological exam<strong>in</strong>ation of <strong>the</strong> lungs.<br />
REFERENCES<br />
1. Rechtschaffen A, Gilliland MA, Bergmann BM, W<strong>in</strong>ter JB. Physiological correlates of prolonged sleep<br />
deprivation <strong>in</strong> rats. Science 1983;221:182-4.<br />
2. Bergmann BM, Kushida CA, Everson CA, et al. <strong>Sleep</strong> deprivation <strong>in</strong> <strong>the</strong> rat: II. methodology. <strong>Sleep</strong><br />
1989;12(1):5-12.<br />
3. Bergmann BM, W<strong>in</strong>ter JB, Rosenberg RS, Rechtschaffen A. NREM sleep with low-voltage EEG <strong>in</strong> <strong>the</strong><br />
rat. <strong>Sleep</strong> 1987;10: 1-11.<br />
4. Mistlberger RE, Bergmann BM, Waldenar W, Rechtschaffen A. Recovery sleep follow<strong>in</strong>g sleep deprivation<br />
<strong>in</strong> <strong>in</strong>tact and suprachiasmatic nuclei-Iesioned rats. <strong>Sleep</strong> 1983;6:217-33.<br />
5. Everson CA, Gilliland MA, Pilcher JJ, et al. <strong>Sleep</strong> deprivation <strong>in</strong> <strong>the</strong> rat: IX. recovery. <strong>Sleep</strong><br />
1989;12(1):60-7.<br />
<strong>Sleep</strong>. Vol. 12. No.1. 1989
SLEEP DEPRIVATION: <strong>III</strong>. TOTAL DEPRIVATION 21<br />
6. Kushida CA, Everson CE, Suthip<strong>in</strong>ittharm P, et aI. <strong>Sleep</strong> deprivation <strong>in</strong> <strong>the</strong> rat: VI. sk<strong>in</strong> changes. <strong>Sleep</strong><br />
1989;12(1):42~.<br />
7. Brodie DA, Hanson HM. A study of <strong>the</strong> factors <strong>in</strong>volved <strong>in</strong> <strong>the</strong> production of gastric ulcers by <strong>the</strong><br />
restra<strong>in</strong>t technique. Gastroenterology 1960;38:353--60.<br />
8. Pare WP. Conflict duration, feed<strong>in</strong>g schedule, and stra<strong>in</strong> differences <strong>in</strong> conflict-<strong>in</strong>duced gastric ulcers.<br />
Physiol Beh 1972;8: 165-171.<br />
9. Galliland MA, Wold L, Wollman R, Eschenbach K, Rechtschaffen A. Pathology <strong>in</strong> sleep deprived rats<br />
is not reflected <strong>in</strong> histologic abnormalities. <strong>Sleep</strong> Research 1984;13:190.<br />
10. Baker HJ, L<strong>in</strong>dsey JR, Weisbroth SH. The laboratory rat. New York: Academic Press, 1979:412.<br />
11. Cizek LJ, Nocenti MR. Relationship between water and food <strong>in</strong>gestion <strong>in</strong> <strong>the</strong> rat. Am J Physiol<br />
1965;208:615-20.<br />
12. Strom<strong>in</strong>ger JL. The relation between water <strong>in</strong>take and food <strong>in</strong>take <strong>in</strong> normal rats and <strong>in</strong> rats with<br />
hypothalamic hyperphagia. Yale J Bioi Med 1947;49:279-88.<br />
13. Bergmann BM, Everson CA, Kushida CA, et al. <strong>Sleep</strong> deprivation <strong>in</strong> <strong>the</strong> rat: V. energy use and mediation.<br />
<strong>Sleep</strong> 1989;12(1):31-41.<br />
14. Krupp MA, Chatton MJ, eds. Current medical diagnosis and treatment 1980. Los Altos, California:<br />
Lange Medical Publications, 1980:798.<br />
<strong>Sleep</strong>, Vol. 12, No.1, 1989