Download File - Fraser - Federal Reserve Bank of St. Louis
Download File - Fraser - Federal Reserve Bank of St. Louis
Download File - Fraser - Federal Reserve Bank of St. Louis

You also want an ePaper? Increase the reach of your titles
YUMPU automatically turns print PDFs into web optimized ePapers that Google loves.
Digitized for FRASER<br />
http://fraser.stlouisfed.org/<br />
<strong>Federal</strong> <strong>Reserve</strong> <strong>Bank</strong> <strong>of</strong> <strong>St</strong>. <strong>Louis</strong><br />
\ v. / I |<br />
■" .<br />
k SiiTS'-<br />
v<br />
-- .i ■ ? ( &<br />
■ ■,a , , 'A-v ;v-i. -•<br />
■ " - 1 - ■ ■- "<br />
w x v 4 ‘ , ,*,**<br />
''' 'T "" | "":<br />
'fSf%<br />
i-'fei'<br />
. § ■_ ■ Kfe '?■■£S^ *^SM “ ^ ^ - fe I? , £<br />
. : . ■■■:■ ■,■ . ■- - ■ • ..... V ... ;. • , ■ ■ . ■: •:. .<br />
, w. «? P fS ls f| r- ®s*5 ■ K jt t ie ip g a s S m g<br />
flgj**: r *'-■»v■ m&$fm * m®c*0s&s£<br />
. r . ' . " ’ .... * ................. t... ,/r* . . ...<br />
cr.
Digitized for FRASER<br />
http://fraser.stlouisfed.org/<br />
<strong>Federal</strong> <strong>Reserve</strong> <strong>Bank</strong> <strong>of</strong> <strong>St</strong>. <strong>Louis</strong>
Digitized for FRASER<br />
http://fraser.stlouisfed.org/<br />
<strong>Federal</strong> <strong>Reserve</strong> <strong>Bank</strong> <strong>of</strong> <strong>St</strong>. <strong>Louis</strong><br />
SECOND<br />
ANNUAL STATISTICAL REPORT<br />
OF T H E<br />
San Francisco<br />
Chamber <strong>of</strong> Commerce<br />
FOR TH E YEAR ENDING DECEMBER 31, 1912
Digitized for FRASER<br />
http://fraser.stlouisfed.org/<br />
<strong>Federal</strong> <strong>Reserve</strong> <strong>Bank</strong> <strong>of</strong> <strong>St</strong>. <strong>Louis</strong><br />
Officers, Directors and <strong>St</strong>aff, 1912<br />
President ........................................................................M. H. ROBBINS, Jr.<br />
First Vice-President ........ 1................. :...............................WM. T. SESNON<br />
Second Vice-President.......... r................................. ...HORACE H. ALLEN<br />
Third Vice-President...............................................CAPT. ROBT. DOLLAR<br />
Treasurer.......................................... .....................................C. K. McINTOSH<br />
Secretary........ ................................................................ A. B. C. DOHRMANN<br />
Executive Secretary .......... ..........................................................L. M. KING<br />
Controller................................. ............................ .,..„:.T. C. FRIEDLANDER<br />
W. M. ALEXANDER C. F. MICHAELS<br />
GEORGE C. BOARDMAN W. N. MOORE<br />
PAU L T. CARROLL<br />
W ILLIA M M. BUNKER<br />
JOHN S. DRUM<br />
ROBERT A. ROOS<br />
W. J. DUTTON<br />
A. L. SCOTT<br />
M. H. ESBERG<br />
JOS. SLOSS<br />
CAPT. WM. MATSON FRANK A. SOMERS<br />
JAMES TYSON<br />
, D7M5SI<br />
v . l
Digitized for FRASER<br />
http://fraser.stlouisfed.org/<br />
<strong>Federal</strong> <strong>Reserve</strong> <strong>Bank</strong> <strong>of</strong> <strong>St</strong>. <strong>Louis</strong><br />
San Francisco Chamber <strong>of</strong> Commerce<br />
1 9 1 3<br />
President ................................................................................WM. T. SESNON<br />
First Vice-President ........................................................... C. F. MICHAELS<br />
Second Vice-President and Manager....... ROBERT NEWTON LYNCH<br />
Third Vice-President ............................................................JOSEPH SLOSS<br />
Treasurer ................................................................................C. K. McINTOSH<br />
Secretary ................................................................GEORGE C. BOARDMAN<br />
Engineer.... .................................................... ..........HENRY A. CAMPBELL<br />
Attorneys .............................................W RIGHT & WRIGHT & STETSON<br />
DIRECTORS.<br />
W. M. ALEXANDER CAPT. WM. MATSON<br />
A. E. ANDERSON C. F. MICHAELS<br />
ROBERT NEWTON LYNCH C. K. McINTOSH<br />
R. I. BENTLEY<br />
GEORGE C. BOARDMAN<br />
PAUL T. CARROLL<br />
JOHN S. DRUM<br />
W. N. MOORE<br />
CONSTANT MEESE<br />
WM. T. SESNON<br />
JOSEPH SLOSS<br />
E. R. DIMOND<br />
B. F. SCHLESINGER<br />
M. H. ESBERG<br />
F. J. KOSTER<br />
F. A. SOMERS<br />
MILES STANDISH<br />
C. H. WORKMAN<br />
TRANSFOSTATION DEPARTMENT<br />
Manager ............................................................... W ILLIAM R. WHEELER<br />
Attorney ........ ............................................................................... SETH MANN<br />
GRAIN TRADE ASSOCIATION.<br />
Chief Inspector ................................ ............................ HENRY C. BUNKER<br />
WASHINGTON, D. C. BUREAU.<br />
Washington Representative .......................................... IRA E. BENNETT
Digitized for FRASER<br />
http://fraser.stlouisfed.org/<br />
<strong>Federal</strong> <strong>Reserve</strong> <strong>Bank</strong> <strong>of</strong> <strong>St</strong>. <strong>Louis</strong><br />
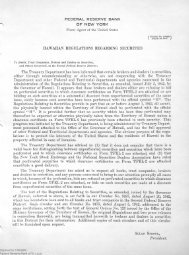
H a ll— San F r a n cis c o C h am ber o f C om m erce
Digitized for FRASER<br />
http://fraser.stlouisfed.org/<br />
<strong>Federal</strong> <strong>Reserve</strong> <strong>Bank</strong> <strong>of</strong> <strong>St</strong>. <strong>Louis</strong><br />
Y e a r R e a l Estate Im p r o v e <br />
m ents<br />
SAN FRANCISCO STATISTICS<br />
ASSESSED VALUES.<br />
P erson a l<br />
P r o p e r ty<br />
T o ta l<br />
T a x<br />
Kate<br />
60%<br />
V a lu a <br />
tio n<br />
A n n u a l<br />
ta x rate<br />
a t 100%<br />
V a lu a <br />
tio n<br />
1905 $304,136,185 $97,830,165 $122,264,596 $524,230,946 1.164 .698<br />
1906 237,082,752 50,250,480 88,805,510 376,138,742 1.164 .698<br />
1907 260,689,806 66,815,201 102,127,836 429,632,843 1.322 .793<br />
1908 258,651,434 90,860,558 104,820,828 454,332,820 1.50 .90<br />
1909 283,213,933 122,935,418 86,180,834 492,330,185 1.60 .96<br />
1910 288,095,453 145,167,790 81,763,921 515,027,164 1.647 .9882<br />
1911 288,653,725 137,179,725 117,223,901 545,057,401 2.00 1.200<br />
1912 323,715,060 169,830,197 111,267,992 604,813,249 2.094 1.2564<br />
BONDED INDEBTEDNESS.<br />
1913— Jan. 2n d..........................................................................<br />
1912— ‘ ‘ ...........................................................................<br />
1911—July 1st.............................................................................<br />
1910— “ ............................................................................<br />
1909— “ .............................................................................<br />
1908— 1‘ .............................................................................<br />
1907— “ .............................................................................<br />
1906— 1« .............................................................................<br />
1905— “ .............................................................................<br />
$27,331,300<br />
19,835,100<br />
18,800,200<br />
16,263,500<br />
12,576,300<br />
3.865.600<br />
4.296.600<br />
4.568.600<br />
4.673.600<br />
PRIVATE BUILDING OPERATIONS.<br />
These figures are for private building operations only and are exclusive<br />
<strong>of</strong> all Municipal, <strong>St</strong>ate, <strong>Federal</strong> or Exposition building. San<br />
Francisco ranked 4th among the cities <strong>of</strong> the United <strong>St</strong>ates in Building<br />
Operations in 1912.<br />
1912.................................................................................................. $26,269,006<br />
191 1 24,495,168<br />
1910......................,........................................................................... 22,873,942<br />
1909................................................................................................... 30,411,196<br />
190 8 ...................................................................................... 35,128,549<br />
190 7 -........ 50,499,499<br />
190 6 39,254,467<br />
190 5 ......................... 20,111,861<br />
190 4 16,916,118<br />
190 3 -.................... 14,984,514<br />
190 2 ...................................... 14,289,938<br />
190 1 ............................. '....................................................... 7,437,562<br />
1900.................................................................................................. 6,390,705<br />
POSTAL RECEIPTS.<br />
191 2 ..................................-................................. $2,782,949 41<br />
1911.................................................................................................. 2,570,215 84<br />
•1910.................................................................................................. 2,488,224 54<br />
190 9 -.................................. 2,212,163 70<br />
190 8 2,010,833 12<br />
190 7 ..................................................................................... 1,787,694 06<br />
190 6 1,509,595 90<br />
190 5 1,772,867 63<br />
190 4 ............... :.......................................................... 1,572,976 81<br />
190 3 1,449,932 20<br />
190 2 1,296,389 08<br />
1901................................................................................................... 1,147,557 00<br />
1900................................................................................................. 1,051,567 00<br />
5<br />
Reproduced from the Unclassified I Declassified Holdings <strong>of</strong> the National Archives
Digitized for FRASER<br />
http://fraser.stlouisfed.org/<br />
<strong>Federal</strong> <strong>Reserve</strong> <strong>Bank</strong> <strong>of</strong> <strong>St</strong>. <strong>Louis</strong><br />
MANUFACTURING.<br />
Ban Francisco ranks eleventh among the cities <strong>of</strong> the United <strong>St</strong>ates<br />
in the number <strong>of</strong> manufacturing establishments.<br />
Census—<br />
Per cent<br />
<strong>of</strong><br />
1909 1904 increase<br />
Number <strong>of</strong> establishments-.........<br />
Capital...............................................<br />
1,795<br />
$133,760,000<br />
2,251<br />
$102,362,000<br />
*20<br />
31<br />
Cost <strong>of</strong> materials used...................<br />
Salaries and wages.........................<br />
76.175.000<br />
30.452.000<br />
75.946.000<br />
31.645.000<br />
(2)<br />
1 4<br />
Value <strong>of</strong> products...........................<br />
Miscellaneous expenses..................<br />
132,929,000<br />
13.053.000<br />
137,788,000<br />
12.474.000 5<br />
1 4<br />
Value added by manufacture<br />
(products less cost <strong>of</strong> materials)<br />
Employees:<br />
Number <strong>of</strong> salaried <strong>of</strong>ficials<br />
and clerks.................................<br />
5^754,000<br />
6,116<br />
61.842.000<br />
5,190<br />
1 8<br />
18<br />
Average number <strong>of</strong> wage earners<br />
employed during the year 28,239 38,429 *27<br />
1 Decrease. 2 Less than 1 per cent increase.<br />
POPULATION.<br />
1912 (according to school attendance).................................... 462,560<br />
1911 (Estimated) .............................. ............................................. 430,000<br />
1910 (U. S. Census)........................................................................- 416,912<br />
1909 (Estimated) ............................................................................ 375,000<br />
1908 “ ............................................................................ 350,000<br />
1907 “ ............................................................................ 300,000<br />
1906 (A fter the fire, estimated by Gen. A. W. Greely).......... 175,000<br />
1905 (Estimated) ............................................................................ 450,000<br />
1900 (U. S. Census)......................................................................... 342,782<br />
1890 “ .......................................................................... 298,997<br />
1880 “ .......................................................................... 233,959<br />
1870 “ .......................................................................... 149,473<br />
1860 “ ......................................................................... 56,802<br />
1852 (<strong>St</strong>ate Census).......................................................................... 34,776<br />
MORTGAGES.<br />
1912.<br />
1911.<br />
1910.<br />
1909.<br />
1908.<br />
1907.<br />
1906.<br />
1905.<br />
1904.<br />
1903.<br />
1902,<br />
1901.<br />
1900.<br />
Year<br />
Number<br />
Amount<br />
9,504 $58,920,242<br />
8,716 48,916,430<br />
8,690 44,899,847<br />
8,005 44,988,205<br />
6,257 41,841,729<br />
6,401 44,583,753<br />
5,488 35,825,680<br />
6,746 35,016,855<br />
6,116 32,977,736<br />
5,194 30,889,988<br />
4,783 25,254,542<br />
4,111 20,148,304<br />
4,010 17,034,453<br />
6
Digitized for FRASER<br />
http://fraser.stlouisfed.org/<br />
<strong>Federal</strong> <strong>Reserve</strong> <strong>Bank</strong> <strong>of</strong> <strong>St</strong>. <strong>Louis</strong><br />
SCHOOL CENSUS.<br />
Pupils Enrolled.<br />
During the year ending June 30, 1912 ........................................ ....... 53,160<br />
During the year ending June 30, 1911 ........................................ ........51,462<br />
During the year ending June 30, 1910 ................................................ 50,212<br />
During the year ending June 30, 1909 ........................................ ....... 48,509<br />
During the year ending June 30, 1908 .......... ............................. ....... 48,045<br />
During the year ending June 30, 1907 ............................................... 45,633<br />
During the year ending April 17, 1906*........................................ ....... 57,782<br />
During the year ending June 30, 1905*......................................55,067<br />
During the year ending June 30, 1904*........................................ ....... 49,600<br />
During the year ending June 30, 1903*.................................. ............. 48,345<br />
During the year ending June 30, 1902*........... ............................ ....... 48,893<br />
During the year ending June 30, 1901*........................................ ....... 48,517<br />
During the year ending June 30, 1900*............................................... 48,058<br />
* N o t e :— P re v io u s to 1 9 0 6 the figu res are ta k en fro m the <strong>St</strong>ate E n rollm en t,<br />
w h ich in clu d e s d u p lica tio n s. P riv a te s ch o o ls h a d an en rollm en t o f 1 1 ,9 2 8 on June<br />
30th , 1 9 1 2.<br />
PASSENGER TRAFFIC BY WATER<br />
PASSENGERS CARRIED BY TRANS-PACIFIC STEAMERS.<br />
1912 1911<br />
Pacific Mail <strong>St</strong>eamship Co.......................................... 39.774 38,467<br />
Matson Navigation Co.................................................. 7,732 6,426<br />
Oceanic <strong>St</strong>eamship Co...... ........................................... 5,875 6,182<br />
Toyo Kisen Kaisha .......... ........................................... 10,573 8,595<br />
Union <strong>St</strong>eamship Co.................. .................................... 3,311 .......<br />
Total ......................................................................... 67,265 59,670<br />
PASSENGERS CARRIED ON FERRIES.<br />
1912 1911<br />
Santa Fe (Richmond) ............................................ 296,220 244,369<br />
Southern Pacific (Oakland and Alameda)....... 19,212,476 18,133.396<br />
K ey Route (Oakland) ...... .................................... 13,770,863 13,383^656<br />
Western Pacific (Oakland) ..... ............................. 113,555 83,165<br />
Northwestern Pacific (Sausalito) ........................ 5,551,910 5,316,815<br />
Total ..................................................................... 38,951,024 37,161,401<br />
PASSENGERS CARRIED ON RIYER BOATS.<br />
1912 1911<br />
Monticello S.' S. Co. (Y allejo).............................. 475,000 516,630<br />
Southern Pacific Co. (Sacramento) ................... 117,628 98,561<br />
California Navigation & Impt. Co. (<strong>St</strong>ockton).. 45,405 43,395<br />
California Transportation Co. (Sacramento).... f 48,096<br />
California Transportation Co. (<strong>St</strong>ockton).......... 70,935 -j 21,419<br />
Cal. Transportation Co. (Mokelumne R iver)..... [ 2,031<br />
Total ........................................................................ 708,968 730,132<br />
Grand Total .............................. ...................... ...... 39,727,257 38,310,833<br />
i
Digitized for FRASER<br />
http://fraser.stlouisfed.org/<br />
<strong>Federal</strong> <strong>Reserve</strong> <strong>Bank</strong> <strong>of</strong> <strong>St</strong>. <strong>Louis</strong><br />
BANKING STATISTICS<br />
BANK CLEARINGS.<br />
1912............................................................................................ $2,677,561,952<br />
1911............................................................................................ 2,427,075,543<br />
1910............................................................................................ 2,323,772,871<br />
1909............................................................................................ 1,979,872,570<br />
1908............................................................#............................. 1,757,151,850<br />
1907............................................................................................ 2,133,882,625<br />
1906...............................................................................:............ 1,998,400,779<br />
1905............................................................................................ 1,834,549,788<br />
1904............................................................................................ 1,534,631,136<br />
1903............................................................................................ 1,520,198,682<br />
1902............................................................................................ 1,373,362,025<br />
1901............................................................................................ 1,178,169,536<br />
1900............................................................................................ 1,029,582,594<br />
San Francisco ranked 8th among the cities <strong>of</strong> the United <strong>St</strong>ates in<br />
<strong>Bank</strong> Clearings in 1912.<br />
SAVINGS BANKS<br />
Number <strong>of</strong> Depositors, January 31st, 1912.............................. .'.....256,083<br />
Date Resources Deposits<br />
1912— December 31 ....... ........... ..... .........<br />
1911—November 10,....................... .......<br />
1910— October 10.......................................<br />
1909—November 16....................................<br />
1908— December 2 1 ....................................<br />
1907—December 28____,............................<br />
1906— December 3 1 ........................... ........<br />
1905—December 3 0 ....................................<br />
1904—January 5..........................................<br />
1903—January 23........................................<br />
1902—December 3 1 .............................. .....<br />
1901—December 3 1 ..................................<br />
1900— December 31......................................<br />
1200,501,961 85<br />
186,758,809 87<br />
175,088,722 87<br />
168,665,975 40<br />
! 150,876,046 63<br />
163,665,016 09<br />
175,309,224 27<br />
182,355,427 24<br />
172,180,930 58<br />
166,466,(73 65<br />
154,762,790 48<br />
143,524,996 39<br />
134,498,940 61<br />
$184,955,220 61<br />
168,744,339 61<br />
158,986,196 59<br />
162,353,933 62<br />
134,454,584 40<br />
147,095,374 49<br />
160,965,128 50<br />
169,538,244 13<br />
160,026,863 15<br />
154,906,701 98<br />
144,295,034 57<br />
133,430,482 77<br />
124,580,434 81<br />
NATIONAL BANKS.<br />
Date Resources Deposits<br />
1913— April 4 ..............................................<br />
1912— June 14........................... ..................<br />
1911—January 7.........................................<br />
1909— November 16 ..................................<br />
1908— November 2 7 .......................... .......<br />
1907— December 3............................ .........<br />
1906—January . 9 ......................... ............<br />
1905—January 11 ......................................<br />
1904—November 10 ..................................<br />
1903— November 17 ..................................<br />
1902— September 15 ..................................<br />
1901— December 10 ..................................<br />
1900— December 13 ..................................<br />
$229,292,094 60<br />
220,003,000 00<br />
211,670,933 67<br />
142,980,426 21<br />
115,363,458 23<br />
98,451,612 88<br />
98,091,160 80<br />
61,008,181 39<br />
60,102,652 27<br />
54,597,516 16<br />
49,487,066 43<br />
39,793,283 35<br />
34,891,054 33<br />
$148,959,367 45<br />
149,082,000 00<br />
83,218,852 18<br />
54,265,802 25<br />
42,267,043 70<br />
31,502,547 98<br />
36,954,152 28<br />
22,463,816 12<br />
23,581,648 73<br />
23,148,450 14<br />
22,903,240 01<br />
18,085,890 49<br />
15,392,276 82
Digitized for FRASER<br />
http://fraser.stlouisfed.org/<br />
<strong>Federal</strong> <strong>Reserve</strong> <strong>Bank</strong> <strong>of</strong> <strong>St</strong>. <strong>Louis</strong><br />
COMMERCIAL BANKS.<br />
I<br />
Date j Resources Deposits<br />
1913— January 31.................................... $ 61,510,057 28<br />
1911—January 7...................................... *57,380,449 73<br />
1909—November 16................................ 116,694,820 91<br />
1908— December 21........................... 116,096,094 80<br />
1907—December 28................................ 130,631,194 27<br />
1906—December 3 1 ................................ 157,156,723 44<br />
1905—December 3 0 ................................ 131,409,473 26<br />
1904—January 5...................................... 127,374,241 04<br />
1903—January 23.................................... 117,476,092 25<br />
1902—December 31................................ 109,294,865 96<br />
1901—December 3 1 ................................ 90,185,766 73<br />
1900—December 3 1 ................................ 76,543,241 09<br />
$ 39,729,068 86<br />
*35,175,904 42<br />
65,085,266 26<br />
63,645,250 44<br />
70,224,725 20<br />
101,901,692 88<br />
80,874,847 38<br />
71,460,562 21<br />
65,122,974 68<br />
67,853,182 53<br />
55,545,547 72<br />
46,270,737 20<br />
*On Feb. 5, 1910, the <strong>Bank</strong> <strong>of</strong> California changed from a commercial<br />
to a national bank with resources <strong>of</strong> $49,109,426.84 and deposits amounting<br />
to $32,036,673.66.<br />
U. S. MINT, SAN FRANCISCO, CALIFORNIA.<br />
Coinage calendar year 1912.<br />
Gold Pieces Value<br />
Eagles............................................................ 300,000 $3,000,000 00<br />
Half Eagles.................................................. 392,000 1,960,000 00<br />
Silver<br />
$4,960,000 00<br />
H alf Dollars................................................ 1,370,000 685,000 00<br />
Quarter Dollars.......................................... 708,000 177,000 00<br />
Dimes....................................... ..................... 3,420,000 342,000 00<br />
$1,204,000 00<br />
Minor<br />
Five Cents.................................................... 238,000 $ 11,900 00<br />
One Cent....................................................... 4,431,000 44,310 00<br />
PHILIPPINE<br />
$ 56,210.00<br />
Pesos.............................................................. 680,000 P 680,000 00<br />
20 Centavos................................................. 750,000 150,000 00<br />
10 Centavos................................................ 1,010,000 101,000 00<br />
PH ILIPPINE<br />
(Bronze)<br />
1 Centavo..................................................... 3,001,000 P 30,010 00<br />
9
Digitized for FRASER<br />
http://fraser.stlouisfed.org/<br />
<strong>Federal</strong> <strong>Reserve</strong> <strong>Bank</strong> <strong>of</strong> <strong>St</strong>. <strong>Louis</strong><br />
TOTAL U. S. COINAGE.<br />
Mint <strong>of</strong> the United <strong>St</strong>ates, San Francisco, Cal.<br />
Double Eagles..................................................................... $1,401,930,520 00<br />
Eagles................................................................................... 138,644,060 00<br />
Half Eagles......................................................................... 134,765,040 00<br />
Three Dollars.................................................................... 186,300 00<br />
Quarter Eagles...... ............................................................ 1,861,255 00<br />
Dollars................................................... .............................. 90,232 00<br />
Total Gold Coinage to Dec. 31, 1912........................ $1,677,477,407 00<br />
Dollars...... .......................................................................... $ 109,523,073 00<br />
Trade Dollars....... ................................................. ............ 26,647,000 00<br />
Half Dollars....... —.............................. .............................. 30,987,445 50<br />
Quarter Dollars.................................................................. 11,213,534 25<br />
Dimes............... ................................................................. . 8,280,218 90<br />
Twenty Cents.................................................................. 231,000 00<br />
Half Dimes...................................................... ................... 119,100 00<br />
Total Silver Coinage to Dee. 31, 1912.... ............. $ 187,001,371 65<br />
One Cent............................................................................. $ 182,350 00<br />
Five Cents........................................................................... 11,900 00<br />
Total Minor Coinage to Dee. 31, 1912........ ............ $ 194,250 00<br />
Total U. S. Coinage to Dec. 31, 1912...... ................ $1,864,673,028 65<br />
Foreign Coinage to Dec. 31, 1912.... ............................ 82,514,284 42<br />
Grand T ota l...... ........................................................... $1,947,187,313 07<br />
TREASURE<br />
Imports at San Francisco<br />
F rom 191 2 1 911 191 0 1909 1 90 8<br />
M e x ic o .......................................<br />
J a p a n .......................................<br />
E cu a d o r.....................................<br />
$ 6,000<br />
2 1 8 ,9 3 0<br />
2 0 4 ,9 5 0<br />
2 ,5 5 3 ,8 0 1<br />
5 1 0 ,9 0 0<br />
2 9 ,3 0 2<br />
8 ,1 5 4<br />
F re n ch O ce a n ica ................... 21<br />
2 4 ,0 0 0<br />
$........... $ 2 ,1 9 2<br />
1 3 4 ,9 0 9<br />
1 ,2 0 9 .1 2 1<br />
1 ,8 6 7 ,9 2 8<br />
3 ,8 7 9 ,2 2 9<br />
1 2 4 ,3 1 3<br />
6 6 3 ,2 8 8<br />
1 ,6 1 6<br />
2 5 0<br />
C h il e .......................................... 1 9 ,0 0 6<br />
4 8 ,3 0 0<br />
1 ,0 5 5 ,6 4 0<br />
2 ,4 9 6 ,3 1 9<br />
1 ,5 7 6 ,0 0 0<br />
7 8 ,9 8 3<br />
8 5 5 ,5 7 4<br />
2 0 7 ,2 0 0<br />
3 ,7 1 3<br />
1 ,4 1 6<br />
1 0 ,2 5 0<br />
$ 1 7 ,1 5 0<br />
6,2 1 0<br />
6 0 2 ,6 7 4<br />
3 ,1 6 5 ,4 7 8<br />
5 7 ,9 4 0<br />
3 8 ,5 2 2<br />
9 5 ,8 9 4<br />
4 0 7 ,5 6 5<br />
1 ,5 8 0<br />
2 ,3 3 0<br />
864<br />
8 ,9 2 8<br />
1,410<br />
4 6 ,2 0 0 1 2 ,0 0 0<br />
6 7 ,2 7 1 4 ,0 0 0<br />
615<br />
1 0 0 ,0 0 0 1 9 ,5 2 5<br />
200<br />
560<br />
2 ,1 0 4<br />
2 ,7 6 8<br />
2 0 ,6 3 6<br />
177<br />
2 5 ,9 7 5<br />
$<br />
4,7 0 0<br />
8 2 9 ,6 7 5<br />
4 ,3 9 1 ,5 0 6<br />
1 0 9 ,3 4 5<br />
1 1 1 ,7 2 6<br />
1 6 7 ,4 0 3<br />
1 ,4 6 2 ,6 5 3<br />
6,8 5 7<br />
1,280<br />
1 5 ,3 9 0<br />
T o ta ls ............................... $ 4 ,6 2 3 ,3 2 9 $ 9 ,0 9 7 ,5 8 0 $ 6 ,4 4 7 ,5 8 ', $ 4 ,4 3 1 ,7 0 2 $ 7 ,1 4 7 ,3 2 3<br />
10
Digitized for FRASER<br />
http://fraser.stlouisfed.org/<br />
<strong>Federal</strong> <strong>Reserve</strong> <strong>Bank</strong> <strong>of</strong> <strong>St</strong>. <strong>Louis</strong><br />
TREASURE<br />
Shipments by Sea<br />
F R O M U . S. C U S T O M H O U S E R E C O R D S<br />
To 1912 1911 1910 1909<br />
|<br />
Hongkong...............<br />
China........................<br />
Fr. Oceania .........<br />
$ 415<br />
7,270,709<br />
2,418,098<br />
5.000<br />
2,605<br />
6.000<br />
5,018,566<br />
$7,768,703<br />
177,050<br />
10,000<br />
Philippine Is.........<br />
Japan....................... 1,999,999<br />
India........................ 1,139,379 1,428,200<br />
Totals...............<br />
$ 200 $<br />
5,616,483<br />
355,476<br />
1,262<br />
2,412<br />
5,332,918<br />
1,507,242<br />
160<br />
2,000<br />
1,968,508<br />
220<br />
1,500<br />
1,501,700<br />
100,000<br />
4,610<br />
28,063,454<br />
1,240<br />
3,180<br />
1,341,261<br />
75,000<br />
2,4S0<br />
..................i.......................<br />
1<br />
$15,860,772 $11,383,852 $9,557,967 $36,335,219<br />
Reproduced from the Unclassified / Declassified Holdings <strong>of</strong> the National Archives<br />
Year Gold Silver Total<br />
1912 ....................................... ........... $5,147,551 $10,713,221 $15,860,772<br />
1911.................................................... 2,013,596 9,370,256 11.383.852<br />
1910..................- ................................ 1,980,208 7,577,759 9,557,967<br />
1909 36,335,219<br />
1908........... ......................................... 2,762,980 3,217.789 5,980,769<br />
1907.................................................... 1.317,420 3,064,374 4,381,794<br />
1906..................................................... 1,214,728 7,739,340 8,954,068<br />
19H1. .............................................. 2.077,663 14,263,550 16,341,218<br />
1904..................................................... 4,153,265 10,995,479 15,148,744<br />
1903..................................................... 1,818,737 1,862,018 3,680,755<br />
1902................................ 2,947.959 11,903.830 14,851,789<br />
1901......................... 246,182 10,988,526 11,234,708<br />
1900......................... .. .. 485.687 14,665.491 15.151,178<br />
1899......... .................. 2,775,754 7.884,477. 10.660.231<br />
1898......................... 803,481 7.887,039 8,694,695<br />
1897................................ 1,088.333 17,668,003 18,756,336<br />
1896.......................................... 1,138,557 14,372,272 15,510,829<br />
1895....................... 18,241,101 18,799,671<br />
1894........................ 1.048,975 12,929,894 13.978,869<br />
1893....... ................ 1 153.509 11,899,433 13,052,942<br />
1892........................................ 875.635 13,700,943 14,576,578<br />
1891....................................................<br />
1890....................................................<br />
1889........................................... .........<br />
1,318,287<br />
1,538,819<br />
1.679.636<br />
7,756,019<br />
7,128,561<br />
18.586.221<br />
9,074,306<br />
8,667,380<br />
20.265.857<br />
11
Digitized for FRASER<br />
http://fraser.stlouisfed.org/<br />
<strong>Federal</strong> <strong>Reserve</strong> <strong>Bank</strong> <strong>of</strong> <strong>St</strong>. <strong>Louis</strong><br />
CUSTOMS RECEIPTS<br />
Receipts <strong>of</strong> Customs duties paid into the United <strong>St</strong>ates Treasury at San Francisco.<br />
Months 1912 1911 1910 1909 1908 1907 1906 1905<br />
January.............<br />
February...........<br />
March.................<br />
April...................<br />
May.....................<br />
June...................<br />
July.....................<br />
August................<br />
September.........<br />
October_______<br />
November.........<br />
December......<br />
$569,519 07 $ 583,511 94 $ 129,579 75 $ 518,924 77<br />
432,391 21<br />
577,185 40<br />
538,659 86<br />
494,663 57<br />
521,833 60<br />
581,705 78<br />
625,339 59<br />
461,009 84<br />
590,121 58<br />
635,334 28<br />
522,204 07<br />
506,617 61<br />
631,445 77<br />
442,358 35<br />
447.847 94<br />
559,067 73<br />
485,335 55<br />
513,489 40<br />
619,484 82<br />
782,437 76<br />
541.847 31<br />
559,911 59<br />
461,919 22<br />
572,400 41<br />
619,445 28<br />
590,357 91<br />
456, S20 39<br />
711,309 89<br />
877,724 92<br />
605,700 17<br />
467,102 04<br />
765,808 98<br />
519,979 77<br />
459,755 08<br />
708,118 31<br />
496,532 50<br />
492,485 61<br />
558,774 25<br />
795,592 45<br />
484,440 39<br />
492,501 33<br />
533,411 51<br />
622,344 82<br />
535,211 74<br />
$681,746 17<br />
513,027 87<br />
605,418 71<br />
509,064 47<br />
659,373 69<br />
553,430 70<br />
466,967 26<br />
519,354 75<br />
551,436 57<br />
538,451 04<br />
606,773 05<br />
625,077 38<br />
$754,727 75<br />
756,286 95<br />
690,383 49<br />
720,406 12<br />
831,866 00<br />
634,982 32<br />
821,047 74<br />
702,814 52<br />
577,070 87<br />
681,876 66<br />
495,740 54<br />
657,778 92<br />
$645,160 50<br />
673,571 41<br />
721,132 11<br />
406,853 67<br />
537,368 33<br />
632,560 84<br />
627,038 28<br />
1,171,705 04<br />
878,126 31<br />
972,562 36<br />
801,230 43<br />
1,024,174 94<br />
$658,990 04<br />
493,289 39<br />
552,445 58<br />
515,684 72<br />
628,937 01<br />
603,593 24<br />
501,855 11<br />
576,468 94<br />
602,528 34<br />
606,707 20<br />
580,028 85<br />
810,798 86<br />
Totals......... $6,549,967 85 $6,673,355 37 $7,125,711 50 $6,698,092 76 $6,830,121 66 $8,324,981 88 $9,091,486 22 $7,131,327 28
Digitized for FRASER<br />
http://fraser.stlouisfed.org/<br />
<strong>Federal</strong> <strong>Reserve</strong> <strong>Bank</strong> <strong>of</strong> <strong>St</strong>. <strong>Louis</strong><br />
SAN FRANCISCO’S COMMERCE<br />
F R O M U . S. C U S T O M H O U S E R E C O R D S<br />
EXPORTS TO FOREIGN COUNTRIES.<br />
Exports<br />
1912..<br />
1911-<br />
1910-<br />
1909..<br />
1908-<br />
1907.<br />
1906.<br />
1905.<br />
1904—<br />
1903—<br />
1902—<br />
1901—<br />
1 9 0 0 -<br />
$54,707,850<br />
43,427.033<br />
35,773,746<br />
30.431.489<br />
30.738^610<br />
29,838,469<br />
33,470,478<br />
' 46,888,504<br />
38,119,692<br />
31,772,113<br />
37,095,030<br />
36,784,072<br />
38.552.710<br />
Annual valuations <strong>of</strong> merchandise traffic between San Francisco and<br />
foreign countries, the Atlantic <strong>St</strong>ates and non-contiguous territory:<br />
• Exports Imports<br />
1912.................................... ........................<br />
1911.... .......................................................<br />
1910..................................... .......................<br />
1909—...... — ..............— ..................-......<br />
1908.................— .........— ........................<br />
1907.........................................- .................<br />
1906 ....................................................<br />
1905 ................................................<br />
1904 ....................................................<br />
1903..................................................... -......<br />
1902 ...................................................<br />
1900.........................—- ..................... ........<br />
IMPORTS.<br />
$94,862,490<br />
85.445,970<br />
65.008,518<br />
57,221,596<br />
48,464.161<br />
4-6,571.790<br />
49,562.403<br />
64.918.505<br />
56,661.481<br />
51,552^249<br />
47,601,422<br />
41,638,410<br />
41,419.679<br />
$62,744,188<br />
56,075.324<br />
50.669.435<br />
51,469.023<br />
44,403.197<br />
49,192,378<br />
54,207,011<br />
44,249.211<br />
43,409,980<br />
36,522,187<br />
36,078,270<br />
37,267,279<br />
39.424.435<br />
Year Free Dutiable<br />
1912,................................................................. ........<br />
1909 . . ....................<br />
1908...... ................................ ...................................<br />
1904..... ................................. .......... ........... .............<br />
1903..... .................................. ,-if........... ...........- „ -<br />
$47,464,578 $15,279,610<br />
40,783,758 15,291,566<br />
35,355,140 15,314,295<br />
37,354,238 14,114,785<br />
29,323,338 15,079,859<br />
34,092,992 20,114.019<br />
29,701,394 • 19,490,984<br />
29,097,175 ' ,15.152.036<br />
28,649,453 ,(14,750,527<br />
20.572.291 15.949,.896<br />
13,
Exports and Imports at San Francisco, to and from aU countries<br />
Destination<br />
Australia...............<br />
Argentine.............<br />
Aden.......................<br />
Austria-Hungary..<br />
Belgium................<br />
F R O M U . S. C U S T O M H O U S E R E C O R D S<br />
British India.... ............. 96,940 126,778<br />
Br. So. A frica................ 84,180 38,096<br />
Canada............................. 3,664,282 2,348,372<br />
Cuba— ......................»..... 16,861 20,640<br />
Chile.... - ........................... 1,201,457 658,588<br />
Colombia— ..................... 149,799 104,062<br />
China................................ 2,632,285 1,383,904<br />
Costa Rica..... ................ 168,088 160,570<br />
Dutch E. Indies..—......... 128,803 88,402<br />
Denmark.......................... 105,086 103,010<br />
Ecuador............................ 182,671 120,658<br />
England........................... 6,269,242 4,995,871<br />
Egypt.......... ..................... 6,924 3,260<br />
France.............................. 767,501 643,590<br />
French Oceania.............. 588,498 615,713<br />
Fr. East Indies................ 2,778 5,892<br />
Germany.......................... 2,316,350 3,179,076<br />
Greece......... .....................<br />
German Oceania.....<br />
Guatemala................<br />
Honduras..................<br />
Hongkong.................<br />
Ireland......... ............<br />
Italy..........................<br />
Japanese China.......<br />
Japan.........................<br />
Jamaica....................<br />
Korea........................<br />
Mexico......................<br />
Netherlands-............<br />
New Zealand..........<br />
Norway.—.................<br />
Nicaragua....... ........<br />
Oth. Br. Oceania___<br />
Oth. Br. E. Indies....<br />
Philippine Is...........<br />
Peru.......... ................<br />
Portugal...................<br />
Panama.... ................<br />
•Russia in Asia.........<br />
Russia in Europe....<br />
Soain.........................<br />
Siam..........................<br />
Scotland...................<br />
Switzerland..............<br />
Sweden.....................<br />
Salvador...................<br />
<strong>St</strong>. Settlements......<br />
Trinidad & Tobago.<br />
Turkey in Europe....<br />
Turkey in Asia.......<br />
Miscellaneous.........<br />
Totals................<br />
Hawaii......................<br />
Tutuilla....................<br />
* Alaska....................<br />
Foreign.....................<br />
Atlantic <strong>St</strong>ates.......<br />
Grand Totals.......<br />
Digitized for FRASER<br />
http://fraser.stlouisfed.org/<br />
<strong>Federal</strong> <strong>Reserve</strong> <strong>Bank</strong> <strong>of</strong> <strong>St</strong>. <strong>Louis</strong><br />
1912<br />
$2,776,762<br />
68,060<br />
EXPORTS<br />
3,182<br />
379,797<br />
84,550<br />
675,176<br />
149.339<br />
1,397,387<br />
663,796<br />
39,549<br />
24,297<br />
18,182,316<br />
18,606<br />
137,830<br />
1,274,033<br />
281,167<br />
1,008,767<br />
20,109<br />
539,391<br />
62,817<br />
16,967<br />
4,783-428<br />
408.340<br />
5,800<br />
1,157,083<br />
101.857<br />
1,210<br />
125<br />
8,110<br />
264,021<br />
6,824<br />
56,028<br />
663,753<br />
62,598<br />
25,193<br />
977,837<br />
$54,707,850<br />
18,193,850<br />
91,173<br />
2,550,644<br />
1,051,561<br />
18,878.262<br />
$95,473,340<br />
1911<br />
$2,187,475<br />
513,224<br />
89,305<br />
462,681<br />
123,457<br />
1,342,313<br />
1,785,799<br />
23,899<br />
5,591<br />
12,382,222<br />
97,688<br />
996,905<br />
232,372<br />
834.837<br />
316,641<br />
4,597,286<br />
401,919<br />
951,654<br />
88,939<br />
1,500<br />
10,320<br />
60,496<br />
144,799<br />
494.547<br />
42,362<br />
642.330<br />
$43,427,033<br />
14,593.966<br />
76,897<br />
3,246,799<br />
882,439<br />
23,218.836<br />
$85,445,970<br />
IMPORTS<br />
1912 1911<br />
$719,470 $621,967<br />
66,064<br />
64,478<br />
48,882 52,019<br />
237,213 639,768<br />
815,544<br />
2,397/630 2,248,842<br />
1,376,750 1,191,820<br />
397,475 380,102<br />
1,464,491 1,126,772<br />
725 705<br />
9,859,277 7,284,312<br />
127,947 151,176<br />
280,160 770,066<br />
23,092 20,907<br />
324,866 618,193<br />
1,455,072 1,791,673<br />
880 1,598<br />
1,587.102 1,688,525<br />
1,046,990 848,026<br />
1,717,623 1,728,814<br />
51,123<br />
67,855 14.979<br />
1,368,786 1,499,179<br />
126,208 72.241<br />
1,720,499 1,046.058<br />
25,844,698 24,095.918<br />
15,671<br />
824,779 478.889<br />
136,959 183,582<br />
128.294 91.561<br />
86,646 122.311<br />
50.955 67.732<br />
238.849<br />
3 715.838 2,720.113<br />
856,162 344,970<br />
19,080 18.027<br />
10,438 6,296<br />
16,181<br />
6,323<br />
113,431 71,136<br />
8.223<br />
209,613 205,179<br />
261.710 239,148<br />
112.-548 147,751<br />
1,438.943 1,372.278<br />
1,279,018 1,612,776<br />
5.303<br />
26,454<br />
90<br />
625.301<br />
$62,744,188 $56,075,324<br />
*T h e se figu res fo r A la sk a d o n ot in clu d e severa l m illio n d o lla rs w o rth o f<br />
g o o d s tra n s-sh ip p ed at o th e r p orts.<br />
14
Digitized for FRASER<br />
http://fraser.stlouisfed.org/<br />
<strong>Federal</strong> <strong>Reserve</strong> <strong>Bank</strong> <strong>of</strong> <strong>St</strong>. <strong>Louis</strong><br />
EXPORT AND IMPORT SUMMARY<br />
F R O M U . S. C U S T O M H O U S E R E C O R D S<br />
COMBINED EXPORT VALUES<br />
The combined exports, treasure and merchandise, exclusive <strong>of</strong> merchandise<br />
by overland railroads, during the past four years, were as follows<br />
:<br />
1912 1911 1910 1909<br />
Merchandise..........<br />
Treasure ................<br />
$94,862,490<br />
15,854,567<br />
$85,445,970<br />
11,383,852<br />
$65,008,158<br />
9,557,967<br />
$57,221,596<br />
36,335,219<br />
Totals.................. $110,717,057 $96,829,822 $74,566,125 $93,556,815<br />
COMBINED VALUES OF IMPORTS<br />
The combined values <strong>of</strong> imports <strong>of</strong> merchandise and treasure from<br />
Foreign Countries during the last four years were as follows:<br />
1912 1911 1910 1909<br />
Merchandise..........<br />
Treasure ................<br />
$62,291,016<br />
4,546,828<br />
$56,075,324<br />
9,097,580<br />
$50,669,435<br />
6,447,587<br />
$51,469,023<br />
4',431,702<br />
Totals ................ $66,837,844 $66,172,904 $57,117,022 $55,900,725<br />
SAN FRANCISCO TRADE SUMMARY<br />
The combined values <strong>of</strong> all exports <strong>of</strong> merchandise and treasure by<br />
sea and all imports <strong>of</strong> merchandise and treasure at San Francisco during<br />
the last four years make the following showing:<br />
Merchandise<br />
E xports.............<br />
Treasure Exports ..<br />
Merchandise<br />
Imports ‘..............<br />
Treasure Imports ..<br />
1912 1911 1910 1909<br />
$94,862,490<br />
15,854,567<br />
62,291,016<br />
4,546,828<br />
$85,445,970<br />
11,383,852<br />
56,075,324<br />
9,097,580<br />
$65,008,158<br />
9,557,967<br />
50,669,435<br />
6,447,587<br />
$57,221,596<br />
36,335,219<br />
51,469,023<br />
4,431,702<br />
Total trade......... $177,554,901 $162,002,726 $131,683,147 $149,457,540<br />
N o t e .—The exports <strong>of</strong> merchandise, commodities and supplies on<br />
United <strong>St</strong>ates Army Transports from San Francisco, which aggregates<br />
more than $800,000 per year are not included in the trade statistics,<br />
and the movement <strong>of</strong> treasure to and from non-contiguous territory <strong>of</strong><br />
the United <strong>St</strong>ates is not included.<br />
15
Digitized for FRASER<br />
http://fraser.stlouisfed.org/<br />
<strong>Federal</strong> <strong>Reserve</strong> <strong>Bank</strong> <strong>of</strong> <strong>St</strong>. <strong>Louis</strong><br />
EXPORTS TO ORIENTAL COUNTRIES<br />
Exports To 1912 1911 1910 1909<br />
China......................<br />
Hongkong..............<br />
Siberia....................<br />
Japan......................<br />
Philippine Islands..<br />
East Indies.............<br />
K orea......................<br />
Guam *....................<br />
$ 2,632,285<br />
1,397,387<br />
101,857<br />
18,182,316<br />
4,783,428<br />
194,398<br />
137,830<br />
35<br />
$ 1,383,904<br />
1,342,313<br />
12,382,222<br />
4,597,286<br />
112,773<br />
97,688<br />
$ 540,123<br />
861,485<br />
96,311<br />
8,709,031<br />
4,939,887<br />
204,825<br />
91,937<br />
300<br />
$ 577,916<br />
1,133,585<br />
131,320<br />
6,825,469<br />
4,960,605<br />
76,730<br />
111,733<br />
Total.................... $27,429,536 $19,916,186 $15,446,899 $13,817,358<br />
* The U. S. Custom House does not include shipments <strong>of</strong> army supplies<br />
inU. S. army transports.<br />
IMPORTS FROM ORIENTAL COUNTRIES<br />
Imports From 1912 1911 1910 1909<br />
China<br />
J apan......................<br />
Philippine Islands..<br />
East Indies............<br />
Asiatic Russia ......<br />
<strong>St</strong>raits Settlements.<br />
Siam........................<br />
A den........................<br />
Dut. East Indies....<br />
Total......<br />
$ 9,859,277<br />
25,844,698<br />
3,715,838<br />
238,849<br />
16,181<br />
1,279,018<br />
64,478<br />
280,160<br />
$ 7,284,312<br />
24,095,918<br />
2,720,113<br />
212,999<br />
1,612,776<br />
8,223<br />
39,638<br />
770,066<br />
$ 6,930,458<br />
20,535,300<br />
2,715,710<br />
2,018,284<br />
1,340,261<br />
19,016<br />
33,514<br />
966,942<br />
$ 7,333j563<br />
24,020,740<br />
1,258,526<br />
1,850,606<br />
637<br />
990,238<br />
6,375<br />
37,910<br />
225,991<br />
$41,298,499 $36,744,045 $34,559,4 85 $35 ,724,586<br />
16
Digitized for FRASER<br />
http://fraser.stlouisfed.org/<br />
<strong>Federal</strong> <strong>Reserve</strong> <strong>Bank</strong> <strong>of</strong> <strong>St</strong>. <strong>Louis</strong><br />
RICE<br />
F R O M U. S. C U S T O M H O U S E R E C O R D S<br />
IMPORTS AT SAN FRANCISCO B Y SEA<br />
Sources<br />
China...................................<br />
Japan...................................<br />
Italv.....................................<br />
Elsewhere......... ..................<br />
1912 1911<br />
Pounds Values Pounds Values<br />
17,970,177<br />
11,532,376<br />
228,627<br />
50,180<br />
$658,591<br />
400,965<br />
10,639<br />
319<br />
12,607,471<br />
8,534,435<br />
315,755<br />
134,900<br />
$437,428<br />
224,366<br />
13,524<br />
2,770<br />
Totals..........................<br />
29,781,360 $1,070,514 21,592,561 1 $678,088<br />
EXPORTS FROM SAN FRANCISCO B Y SEA<br />
To<br />
Hawaii ...................................<br />
Central America ..................<br />
Mexico ..................................<br />
Panama ...................................<br />
South America ......................<br />
Pacific Islands .......................<br />
Canada ...................................<br />
China and Hongkong..........<br />
French Oceania .....................<br />
Alaska .....................................<br />
Totals......... ......................<br />
1912 1911<br />
Pounds V alues Pounds Values<br />
509,555<br />
5,433,675<br />
1,571,457<br />
1,203,373<br />
56,200<br />
6,000<br />
8,412<br />
9,297<br />
661,767<br />
157,925<br />
$■ 24,290<br />
174,429<br />
49,433<br />
35,333<br />
1,748<br />
296<br />
220<br />
295<br />
22 247<br />
7*834<br />
236,600<br />
1,398,206<br />
1,341,052<br />
888,955<br />
105,576<br />
804,010<br />
9,020<br />
1,015<br />
$ 9,948<br />
35,881<br />
33,988<br />
22,266<br />
2,604<br />
21,225<br />
198<br />
27<br />
255,010 8,885<br />
9,617.661 $316,091 5,040,179 $135,022
Digitized for FRASER<br />
http://fraser.stlouisfed.org/<br />
<strong>Federal</strong> <strong>Reserve</strong> <strong>Bank</strong> <strong>of</strong> <strong>St</strong>. <strong>Louis</strong><br />
SUGAR<br />
F R O M U . S. C U S T O M H O U S E R E C O R D S<br />
EXPORTS FROM SAN FRANCISCO B Y SEA<br />
To<br />
Mexico .......................................<br />
Central America .....................<br />
South America .......................<br />
Hawaii .....................................<br />
Pacific Islands .........................<br />
Japan .........................................<br />
Alaska .......... ............................<br />
Canada .....................................<br />
Elsewhere .................................<br />
Tot'll3.......... -.............-......-<br />
1912 1911<br />
Pounds Values Pounds Values<br />
2,137,594<br />
204,587<br />
991,043<br />
10,520<br />
393,248<br />
127,436<br />
1,280,531<br />
30,000<br />
107,064<br />
$122,040<br />
7,525<br />
53,073<br />
610<br />
23,811<br />
7,677<br />
70,388<br />
1,748<br />
6,368<br />
425,589<br />
314,870<br />
580<br />
663,484<br />
373,274<br />
668,924<br />
83,610<br />
45,800<br />
1,238,268<br />
$22,578<br />
16,516<br />
39<br />
35,101<br />
18,279<br />
36,781<br />
5,184<br />
2,415<br />
62,211<br />
5,282,023 $293,240 3,814,399 $199,104<br />
IMPORTS AT SAN FRANCISCO KY SEA<br />
1912<br />
1911<br />
Pounds<br />
V allies<br />
Pounds<br />
Values<br />
Hawaii .................<br />
China .....................<br />
Guatemala ..........<br />
Salvador ..........—<br />
Dutch Bast Indies<br />
Canada ....................<br />
Mexico .................<br />
Peru .......................<br />
Philippines ...........<br />
442,880,200<br />
738,979<br />
1,208,377<br />
924<br />
10,297<br />
4,501,189<br />
28,517,50.6<br />
$17,715,448<br />
27,268<br />
33,274<br />
39<br />
307<br />
119,305<br />
893,250<br />
476,999,990<br />
887,488<br />
323,260<br />
109,020<br />
17,431,515<br />
947,608<br />
3,196<br />
1,120,000<br />
$19,079,999<br />
26,934<br />
8,503<br />
1,935<br />
379,541<br />
21,241<br />
94<br />
21,770<br />
TotnIs.......... .<br />
477,863,472<br />
18,788,910<br />
497,822,077<br />
119,540,017<br />
QUICKSILVER<br />
Exports from Receipts at Production<br />
San Francisco San Francisco from <strong>of</strong> California<br />
by sea California mines mines<br />
1912.............. 9,815 12,327 20,600<br />
1911....... -...... 7,856 13,321 19,109<br />
1910.............. 10,703 17,698 17,665<br />
1909.......... - 10,371 16,143 16,217<br />
1908....... ...... 14,856 15,436 18,039<br />
1907.............. 11,784 13,042 17,379<br />
1906........ ... 14,746 16,642 19,516<br />
1905.............. 16,832<br />
19,276 24,655<br />
1904.............. 23,184<br />
25,732 28,876<br />
1903............... 16,741<br />
26,534 32,094<br />
1902..... - ....... 9,826<br />
20,328 29,552<br />
1901.............. 5,337 21,224 26,720<br />
1900.............. 7,294 21,247 26,317<br />
18
Digitized for FRASER<br />
http://fraser.stlouisfed.org/<br />
<strong>Federal</strong> <strong>Reserve</strong> <strong>Bank</strong> <strong>of</strong> <strong>St</strong>. <strong>Louis</strong><br />
TEA<br />
IMPORTS AT SAN FRANCISCO BY SEA<br />
F R O M U. S. C U S T O M H O U S E R E C O R D S<br />
Sources<br />
1912 1911<br />
Pounds Y alues Pounds V alues<br />
Japan.................................<br />
China.................................<br />
British East Indies.......<br />
Elsewhere.........................<br />
10,657,990<br />
10,686,449<br />
632,630<br />
186,332<br />
$2,019,185<br />
1,834,987<br />
115,904<br />
61,459<br />
13,298,763<br />
4,919,296<br />
798,776<br />
361,098<br />
$2,398,497<br />
688,743<br />
142,725<br />
108,784<br />
Totals........................<br />
22,163,401 $4,031,535 19,377,933 $3,338,749<br />
IMPORTS AT SAN FRANCISCO BY SEA<br />
Y E A R<br />
C H IIJA J A P i*.N TOT^LLS<br />
P o u n d s V a lu e P o u n d s V a lu e P o u n d s V a lu e<br />
1 9 1 2<br />
1 9 1 1<br />
1 9 1 0<br />
1 9 0 9<br />
1 9 0 8<br />
1 9 0 7<br />
1 9 0 6<br />
1 9 0 5<br />
1 9 0 4<br />
1 90 3<br />
1 9 0 2<br />
1 9 0 1<br />
1 9 0 0 ........<br />
1 0 ,6 8 6 ,4 4 9<br />
4 ,9 1 9 ,2 9 6<br />
8 ,3 0 2 ,6 7 8<br />
7 ,4 2 9 ,8 7 0<br />
3 ,9 2 8 ,6 4 2<br />
3 ,9 8 2 ,4 2 8<br />
3 ,4 1 7 ,8 6 2<br />
3 ,1 6 7 ,8 4 2<br />
2 ,7 8 4 ,6 1 4<br />
2 ,9 5 6 ,4 6 8<br />
2 ,2 2 6 ,5 8 4<br />
1 ,8 9 1 ,5 8 7<br />
4 ,4 3 5 ,2 2 0<br />
$ 1 ,8 3 4 ,9 8 7<br />
6 8 8 ,7 4 3<br />
1 ,6 4 1 ,7 2 0<br />
1 ,4 8 5 ,9 7 4<br />
7 8 5 ,7 2 8<br />
6 4 8 ,7 8 0<br />
5 7 1 ,6 0 8<br />
4 6 9 ,2 7 9<br />
4 0 1 ,2 1 0<br />
4 0 6 ,8 2 2<br />
2 8 7 ,5 3 0<br />
2 2 8 ,9 7 0<br />
5 0 6 ,7 5 7<br />
1 0 ,6 5 7 ,9 9 0<br />
1 3 ,2 9 8 ,7 6 3<br />
1 3 ,9 1 4 ,2 6 8<br />
1 1 ,6 0 2 ,3 6 4<br />
6 ,2 7 9 ,8 6 4<br />
5 ,8 4 4 ,1 0 7<br />
5 ,2 6 5 ,3 8 4<br />
4 ,8 4 1 ,9 7 2<br />
5 ,2 1 4 ,1 8 2<br />
5 ,9 6 8 ,8 0 5<br />
3 ,5 5 4 ,6 2 0<br />
6 ,6 0 6 ,1 5 2<br />
1 0 .1 2 7 .2 6 7<br />
$ 2 ,0 1 9 ,1 8 5<br />
2 ,3 9 8 ,4 9 7<br />
2 ,7 8 6 ,3 1 2<br />
2 ,3 2 0 ,4 7 2<br />
1 ,2 5 6 ,0 7 2<br />
1 ,2 3 1 ,2 8 0<br />
1 ,1 6 9 ,7 1 4<br />
9 7 4 ,4 6 2<br />
1 ,0 2 0 ,3 6 2<br />
1 ,1 0 6 ,3 4 7<br />
5 8 1 ,2 1 5<br />
8 3 8 ,6 9 2<br />
1 3 4 6 .5 9 6<br />
2 1 ,3 4 4 ,4 3 9<br />
1 8 ,2 1 8 ,0 5 9<br />
2 2 ,2 1 6 ,9 4 3<br />
1 9 ,0 3 2 ,2 3 4<br />
1 0 ,2 0 8 ,5 0 6<br />
9 ,8 2 6 ,5 3 5<br />
8 ,6 8 3 ,2 4 6<br />
8 ,0 0 9 ,8 1 5<br />
7 ,9 9 8 ,7 9 6<br />
8 ,9 2 5 ,2 7 7<br />
5 ,7 8 1 ,2 0 4<br />
8 ,4 9 7 ,7 3 9<br />
1 4 .5 6 2 .4 S 7<br />
$ 3 ,8 5 4 ,1 7 2<br />
3 ,0 8 7 ,2 4 0<br />
4 ,4 2 8 ,0 3 2<br />
3 ,9 2 4 ,7 6 0<br />
2 ,0 4 1 ,8 0 0<br />
1 ,8 8 0 ,0 6 0<br />
1 ,7 4 1 ,4 2 2<br />
1 ,3 9 3 ,7 4 1<br />
1 ,4 2 1 ,5 7 2<br />
1 ,5 1 3 ,1 6 9<br />
8 6 8 ,7 4 5<br />
1 ,0 6 7 ,6 6 2<br />
1 .8 5 3 .3 5 3<br />
1!)
Digitized for FRASER<br />
http://fraser.stlouisfed.org/<br />
<strong>Federal</strong> <strong>Reserve</strong> <strong>Bank</strong> <strong>of</strong> <strong>St</strong>. <strong>Louis</strong><br />
Source<br />
Central America.—<br />
Ecuador....................<br />
East Indies.............<br />
Mexico......................<br />
Elsewhere................<br />
COFFEE<br />
IMPORTS AT SAN FRANCISCO B Y SEA<br />
1912 1911<br />
Pounds | V alues Pounds Values<br />
24,429,503<br />
982,386<br />
394,128<br />
7,635,685<br />
Aden......................... 371,767<br />
Peru.......................... 9,900<br />
Brazil....................... 5,404,504<br />
$2,933,127<br />
130,944<br />
63,338<br />
553,633<br />
64,478<br />
1,255<br />
815,544<br />
28,153,052<br />
3 438,325<br />
626,634<br />
2,312,266<br />
2,883,244<br />
$2,908,207<br />
389,461<br />
90,138<br />
270,458<br />
410,699<br />
Totals.............. 39,227,873 $4,562,319 37,413,521 $4,068,963<br />
EXPORTS FROM SAN FRANCISCO BY SEA<br />
Alaska......................<br />
M exico.....................<br />
118,405<br />
844<br />
South America......<br />
Hawaii..................... 87,096<br />
Pacific Islands<br />
4,569<br />
Philippine Islands. 747,609<br />
Japan........................ 5,565<br />
China & Hongkong. 2,459<br />
Australasia..............<br />
Canada.....................<br />
Elsewhere................<br />
1912 1911<br />
Pounds Values Pounds Values<br />
108,765<br />
1,830<br />
$32,336<br />
244<br />
16,123<br />
1,127<br />
152,988<br />
1,243<br />
519<br />
22,431<br />
509<br />
7,162<br />
1,600<br />
81,290<br />
11,726<br />
296,235<br />
12,425<br />
129,735<br />
281,038<br />
48,752<br />
138,210<br />
$ 1,396<br />
352<br />
14,643<br />
1,872<br />
61,050<br />
2,018<br />
18,513<br />
38,301<br />
9,715<br />
35,229<br />
Totals...............<br />
1,077,142 $227,520 1,008,173 $183,089<br />
HOPS<br />
EXPORTS FROM SAN FRANCISCO BY SEA<br />
To<br />
1912 1911 1910<br />
Pounds Value Pounds Value Pounds Value<br />
New Zealand...... 64,875 $ 20,456 23,572 $ 8,223 45,860 $ 4,872<br />
Australia.......... . 689,588 183,383 145,755 39,974 152,574 17,498<br />
Hawaiian Islands 23,971 5,664 21,797 4,921 38,895 4,609<br />
China.................... 5,120 1,516 2,490 585 16,348 1,864<br />
M exico................. 3,690 1,421 4,687 1,388 6,792 728<br />
Central America,. 6,248 3,078 6,187 2,142 5,270 579<br />
Japan ................... 2,624 769 3,650 847 9,618 1,118<br />
In d ia .................... 34,437 8,740 40,497 13,744 46,528 4,970<br />
Canada ................ 4,751 2,019 576 134 26,307 2,889<br />
E n gland.............. 42,726 8,660 1,566,034 192,079 148,692 16,412<br />
South America..... 2,291 759 1,918 684 8,212 904<br />
Pacific Islands..... 1,330 338 2,708 306<br />
Manila.................. 9,090 2,796 6,796 1,483 2,918 325<br />
553 183 285 32<br />
H on gk on g........... 5,560 1,583<br />
Eastern <strong>St</strong>ates..... 526,000 71,430 358,254 51,946 531,109 56,690<br />
Elsewhere............. 3,326 2,814 1,154 257 34,705 4,326<br />
Totals.......... 1,429,297 $314,874 2,185,250 318,928 1,086,821 $118,122<br />
20
Digitized for FRASER<br />
http://fraser.stlouisfed.org/<br />
<strong>Federal</strong> <strong>Reserve</strong> <strong>Bank</strong> <strong>of</strong> <strong>St</strong>. <strong>Louis</strong><br />
COMPARATIVE STATEMENT OF HOP CROPS.<br />
In Bales.<br />
1912 1911 1910 1909 1908 1907 1906 1905 1904 1903 1902 1901 1900<br />
California ...<br />
Oregon.........<br />
W ashington<br />
117,500<br />
115,000<br />
38,000<br />
87.000 71.000<br />
75,COO 100,000<br />
20.000 20.000<br />
69.000<br />
82,500<br />
17.000<br />
65.000<br />
90.000<br />
15.000<br />
90.000<br />
130,000<br />
35.000<br />
110,000<br />
150,000<br />
50,000<br />
105.000<br />
125.000<br />
50,000<br />
66,000<br />
88,000<br />
35,000<br />
55.000<br />
88.000<br />
35,000<br />
55.000<br />
85.000<br />
35.000<br />
48.000<br />
72.000<br />
30.000<br />
36.000<br />
80.000<br />
35,000<br />
Totals 270,500 182,000 191,000 168,500 170,000 255,000 310,000 280,000| 189,000 178,000 175,000 150,000 151,000
Digitized for FRASER<br />
http://fraser.stlouisfed.org/<br />
<strong>Federal</strong> <strong>Reserve</strong> <strong>Bank</strong> <strong>of</strong> <strong>St</strong>. <strong>Louis</strong><br />
CALIFORNIA WINES<br />
F R O M U . S. C U S T O M H O U S E R E C O R D S .<br />
EXPORTS FROM SAN FRANCISCO BY SEA<br />
To<br />
1912 1911<br />
Gallons Values Gallons Values<br />
Atlantic <strong>St</strong>ates.................. 11,483,389 $3,859,221 11,157,705 $3,538,800<br />
Germany............................. 32,658 11,340 222,884 67,577<br />
England.......................... 62,729 24,389 58,337 22,460<br />
Switzerland........................ 24,119 6,824 23,376 8,551<br />
Belgium............................... 1,000 300 8,750 2,830<br />
France.................. 11,203 3,350 6,874 2,413<br />
Netherlands............ 1,025 310 5,750 2,400<br />
China................. 26,662 10,903 30,191 11,681<br />
Japan................................. 29,029 10,164 224,224 66,399<br />
Hawaii..................... 957,291 405,417 810,579 354,965<br />
A laska.................... 6,968 7,503 6,179 6,563<br />
Philippines...................... 22,642 10,066 15,622 8,790<br />
Canada............................... 56,820 22,407 45,336 18,569<br />
Australia and Tasmania.. 412 315 1,103 440<br />
Costa Rica.......................... 11,420 4,325 2,952 1,439<br />
Guatemala............ 21,182 8,465 22,717 11,092<br />
Honduras........................... 4,708 2,440 4,817 3,172<br />
Nicaragua........................... 9,965 5,111 11,669 4,188<br />
Salvador........... ;................. 35,521 14,226 36,114 16,517<br />
Panama.............................. 266,957 80,664 236,565 66,928<br />
Cuba.................................... 7,289 8,821 14,530 4,842<br />
Mexico................................ 53,341 18,284 48,962 18.515<br />
Columbia............................ 53,696 23,981 31,309 13,406<br />
Ecuador.............................. 56,243 22,269 56,384 23,522<br />
Dutch East Indies............ 2,619 1,055 2,873 1.906<br />
Hong Kong......................... 2,241 1,747 2,752 1,798<br />
French Oceania................. 37,956 11,028 35,342 9,380<br />
Miscellaneous.......... ......... 5,448 2.948 5,743 3,931<br />
1912_______ _______________ ___ ;__________ 13,274,533 $4,577,873<br />
1911..................................... 13,129,639 4,293,063<br />
1910...................................... 9,862,830 3,382,417<br />
1909...................................... 7,298,620 2,518,436<br />
1908..................................... 5,469,632 2,318,545<br />
1907....... .................... .......... 3,721,841 1,502,355<br />
1906..................................... 3,831,225 1,894,328<br />
1905...................................... .7,061,156 2,614,971<br />
1904............ 7,118,884 2,697,439<br />
1903...................................... 6,938,746 2,567,228<br />
1902....................... 6,636,186 2,478,659<br />
1901...................................... 5,839,447 1,993,327<br />
1900.... ............... 5,790,786 1 755 923<br />
1899...................................... 3,518,631 1,157,965<br />
1898...................................... 5,145,003 1 824,259<br />
1897...................................... 5,462,686 1,988,197<br />
1896................................... 4,202,869 1 496 366<br />
1895........... .......................... 4,015,126 1,323,223<br />
1894_____________________ 2,440,024 1,017,027<br />
iso:?__________ _____ _____ ________________ 3,666,412 1 527,678<br />
1892...................................... 4,797,172 2,031,405<br />
1891...................................... 4.918.222 2.160.51 fi<br />
22
Digitized for FRASER<br />
http://fraser.stlouisfed.org/<br />
<strong>Federal</strong> <strong>Reserve</strong> <strong>Bank</strong> <strong>of</strong> <strong>St</strong>. <strong>Louis</strong><br />
Vintage<br />
187 9<br />
188 0<br />
1881-.....<br />
1882.......<br />
188 3 .<br />
188 4<br />
188 5<br />
1887—......................<br />
1888........................<br />
1889<br />
CALIFORNIA WINES<br />
Gallons<br />
7.000.000<br />
10,200,000<br />
8.000.000<br />
9,000,000<br />
8,500,000<br />
10,000,000<br />
11,000,000<br />
18,000,000<br />
15.000.000<br />
17.000.000<br />
15.000.000<br />
189 0 -............. 17,500,000<br />
189 1 ........................ ... 20,000,000<br />
1892............................ ..... 15,000,000<br />
189 3 ... 24,700,000<br />
189 4 ................. 14,000,000<br />
•1895.......................-......... 18,000,000<br />
Estimated Production<br />
Vintage<br />
189 6<br />
189 7<br />
189 8<br />
189 9<br />
CALIFORNIA BRANDY<br />
Gallons<br />
............. ...17.000,000<br />
.............. 16,400,000<br />
............. ...31,500,000<br />
............. ...19,000,000<br />
1900.................................23,500,000<br />
1901... . ...22,500,000<br />
190 2 ...43,000,000<br />
190 3 .......................34,500,000<br />
190 4 ...........:.........29,160,000<br />
190 5 ...........26,502,000<br />
190 6 .......................38,000,000<br />
1907... . ...43,000,000<br />
190 8 .......................37,250,000<br />
190 9 ...45,000,000<br />
191 0 ...45,500.000'<br />
191 1 ....................... ...49,280*044<br />
1912... . ...40,000,000<br />
EXPORTS FROM SAN FRANCISCO BY SEA<br />
To<br />
1912<br />
Gallons<br />
Value<br />
Eastern <strong>St</strong>ates................... d '6. 54o $48,423<br />
England......... .................... 48 3o<br />
Germany............................ 1,021 1,022<br />
Hawaii................................. 27,074 55,743<br />
Philippines......................... 2,888 4,839<br />
Canada......... ...................... 1,333 2,659<br />
China................................... 128 75<br />
Japan.................................. 7 26<br />
Australia......... ................... 257 180<br />
Central America...-......... . 217 305<br />
South America.- .............. 40 47<br />
Russia........ .........................<br />
M exico............ .......... 102 174<br />
French Oceania................. 6 18<br />
1912............................<br />
1911........................<br />
1910............. . . .<br />
1909............................<br />
1908............................<br />
1907....... ............................<br />
1906...................<br />
1905...... ............<br />
1904................ .<br />
1903....... ..................<br />
1902..................<br />
1901.................<br />
1900.............<br />
1899...........<br />
1898...................<br />
1897...........<br />
1896..................<br />
1895..........<br />
1894...............<br />
1893...................<br />
1892..........................<br />
1891.<br />
1890.<br />
Gallons<br />
1911<br />
Value<br />
13,H i $26,136<br />
7.617 4,783<br />
1.021 669<br />
21.827 33,559<br />
3,244 4,239<br />
38: 652<br />
149 275<br />
15 33<br />
3( 58<br />
234 391<br />
40 110<br />
15<br />
89,666 113,546<br />
47,725 72,010<br />
25,331 23,755<br />
18,265 30,945<br />
16,424 28,223<br />
12,846 25,881<br />
14,234 28,892<br />
16,766 32,089<br />
27,922 31,069<br />
54,168 60,189<br />
24,349 36,423<br />
29,512 28,746<br />
56,776 54,536<br />
126,572 106,413<br />
120,046 117,149<br />
18,058 26,806<br />
72,998 78,871<br />
91,953 76,845<br />
357,103 374,153<br />
309,353 265,975<br />
532,347 495,368<br />
432,821 395,396<br />
303.425 324,462<br />
23
CANNED SALMON<br />
EXPORTS FROM SAN FRANCISCO BY SEA<br />
Eastern <strong>St</strong>ates.............<br />
Hawaii..........................<br />
Alaska,—.......................<br />
Philippines...................<br />
Cuba..............................<br />
England........................<br />
Australia......................<br />
New Zealand................<br />
British Guiana............<br />
British India................<br />
<strong>St</strong>raits Settlements....<br />
Hong Kong...................<br />
Other British Oceania<br />
Other Br. East Indies.<br />
Dutch Guiana..............<br />
Dutch East Indies......<br />
M exico..........................<br />
Costa Rica.............. .<br />
Guatemala....................<br />
Nicaragua.....................<br />
Salvador........................<br />
Honduras......................<br />
Panama........... .............<br />
Jamaica.........................<br />
Korea.............................<br />
Canada..........................<br />
Barbadoes..... ...............<br />
British S. Africa.........<br />
Egypt............................<br />
Siam....... .......................<br />
France...........................<br />
Dutch West Indies.....<br />
Chile...... ......................<br />
Columbia................ ......<br />
Bolivia...........................<br />
Ecuador......... ...............<br />
Peru___________ ______<br />
China...................... ......<br />
Argentina.....................<br />
French Oceania............<br />
German Oceania........ .<br />
Trinidad and Tobago..<br />
Elsewhere......................<br />
T otal-.........................<br />
Cases<br />
1912<br />
161,290<br />
3,489<br />
399<br />
16,920<br />
290<br />
306,653<br />
124,506<br />
4,827<br />
3,720<br />
3,405<br />
3,370<br />
1,450<br />
614<br />
1,063<br />
1,200<br />
1,829<br />
7,299<br />
1,766<br />
729<br />
246<br />
360<br />
276<br />
6,500<br />
3,701<br />
2,880<br />
4,750<br />
22,848<br />
61,000<br />
10,992<br />
1,920<br />
470<br />
1,440<br />
13,583<br />
2,301<br />
619<br />
4,315<br />
5,581<br />
1,622<br />
5,775<br />
4,842<br />
472<br />
V alue<br />
$761,987<br />
38,669<br />
2,140<br />
55,163<br />
1,128<br />
1,585,483<br />
795,918<br />
24,616<br />
17,649<br />
14,990<br />
10,372<br />
7,211<br />
3,791<br />
3,835<br />
5,525<br />
10,475<br />
24,489<br />
7,374<br />
2,935<br />
5,226<br />
1,437<br />
1,191<br />
28,743<br />
15,783<br />
342<br />
24,585<br />
2,177<br />
4,573<br />
1,021<br />
271<br />
58<br />
151<br />
49,738<br />
9,815<br />
1,691<br />
15,326<br />
14,308<br />
6,744<br />
32,017<br />
19,094<br />
23,905<br />
Cases<br />
287,388<br />
6,030<br />
348<br />
19,412<br />
240<br />
181,756<br />
92,906<br />
1,449<br />
950<br />
1,694<br />
1,053<br />
1,059<br />
1,367<br />
1,465<br />
1,295<br />
1,223<br />
3,991<br />
2,334<br />
339<br />
1,022<br />
176<br />
372<br />
6,086<br />
3,770<br />
38,703<br />
1,457<br />
225<br />
3,143<br />
3,375<br />
598<br />
628<br />
5,150<br />
5,896<br />
2,875<br />
1,010<br />
1911<br />
Value<br />
$1,794,635<br />
38,301<br />
2,319<br />
82,438<br />
1,008<br />
1,029,248<br />
606,548<br />
8,308<br />
5,010<br />
10,176<br />
4,440<br />
6,834<br />
5,237<br />
7,173<br />
6,926<br />
7,349<br />
18,297<br />
12,245<br />
1,731<br />
5,081<br />
1,074<br />
1,948<br />
33,667<br />
19,834<br />
171,452<br />
7,428<br />
1,057<br />
14,575<br />
14,843<br />
3,819<br />
2,826<br />
32,226<br />
23,021<br />
15,800<br />
4,923<br />
702,124| $3,632,5831 680,785! $4,001,753<br />
SUMMARY OF ANNUAL EXPORTS<br />
Cases Barrels Values Cases Barrels Values<br />
1912.. 702,124 $3,632,583 1900.. 856,994 15,734 $3,602,562<br />
1911.. 680,785 4,001,753 1899.. 694,866 27,146 2,946,028<br />
1910.. 685,124 9,298 2,740,018 1898.. 703,442 16,727 2,921,178<br />
1909.. 993,782 12,664 5,493,086 1897.. 789,252 17,066 3,338,331<br />
1908.. 576,255 9,206 2,389,078 1896.. 707,903 10,693 3,026,888<br />
1907.. 644,560 11,890 2,597,378 1895.. 902,089 11,072 3,711,686<br />
1906.. 568,025 13,236 2,304,640 1894.. 640,163 7,753 2,704,728<br />
1905.. 679,846 16,624 2,883,024 1893.. 203,316 7,373 1,027,051<br />
1904.. 940,969 11,998 4,121,569 1892.. 758,517 5,946 3,490,877<br />
1903.. 748,706 11,819 3,136,542 1891 464,291 11,982 2,091,292<br />
1902.. 793,156 11,845 3,048,268 1890- 480,006 9,751 2,229,313<br />
1901- 804,347 9,839 3,623,746 1889- 475,317 7,011 2,636,361<br />
Digitized for FRASER<br />
http://fraser.stlouisfed.org/<br />
<strong>Federal</strong> <strong>Reserve</strong> <strong>Bank</strong> <strong>of</strong> <strong>St</strong>. <strong>Louis</strong><br />
1<br />
24
c3<br />
0><br />
1868<br />
1869<br />
1870<br />
1871<br />
1872<br />
1873<br />
1874<br />
1875<br />
1876<br />
1877<br />
1878<br />
1879<br />
1880<br />
1881<br />
1882<br />
1883<br />
1884<br />
1885<br />
1886<br />
1887<br />
1888<br />
1889<br />
1890<br />
1891<br />
1892<br />
1893<br />
1894<br />
1895<br />
1896<br />
1897<br />
1898<br />
1899<br />
1900<br />
1901<br />
1902<br />
1903<br />
1904<br />
1905<br />
1906<br />
1907<br />
1908<br />
1909<br />
1910<br />
1911<br />
1912<br />
CANNED SALMON<br />
<strong>St</strong>atement <strong>of</strong> Product <strong>of</strong> Pacific Coast, in cases.<br />
12 £<br />
'B £<br />
O P5<br />
- a ?<br />
£ §<br />
PP o<br />
O<br />
1,000<br />
2.500<br />
3,000<br />
8,300<br />
21.500<br />
36.500<br />
31.000<br />
51.000<br />
181,200<br />
200,300<br />
160,000<br />
81,450<br />
48.500<br />
39,300<br />
36.500<br />
58.000<br />
66,666<br />
35,006<br />
4,142<br />
4,600<br />
23,336<br />
28,463<br />
24.000<br />
13,387<br />
42.500<br />
28.000<br />
33,550<br />
34,000<br />
17.500<br />
14,043<br />
8.500<br />
19,698<br />
4,142<br />
3.000<br />
6.000<br />
9,750<br />
16,800<br />
25.600<br />
24,800<br />
30.000<br />
30.000<br />
37,200<br />
48,500<br />
49.000<br />
38.000<br />
41,350<br />
51,750<br />
131,100<br />
195.400<br />
154.000<br />
199,068<br />
67,117<br />
66,805<br />
144,200<br />
119,660<br />
118,500<br />
264.300<br />
115.400<br />
68,683<br />
78.600<br />
82,432<br />
106.300<br />
123,326<br />
134,190<br />
63,706<br />
164,791<br />
190.000<br />
155,506<br />
127,591<br />
105,381<br />
103,604<br />
209,919<br />
267,354<br />
198,457<br />
2,200<br />
4.000<br />
5.000<br />
8.000<br />
11.500<br />
15.000<br />
66.500<br />
67,933<br />
52.000<br />
248,200<br />
423.500<br />
417,700<br />
871.500<br />
478,742<br />
1,380,590<br />
625,982<br />
470,207<br />
296,272<br />
430,602<br />
441,414<br />
721,666<br />
314,281<br />
1,568,051<br />
540,592<br />
1,557,029<br />
416,125<br />
6,270<br />
9,847<br />
67,387<br />
113,601<br />
57,394<br />
61,300<br />
175,675<br />
255,061<br />
243.000<br />
138,945<br />
106,865<br />
163,004<br />
201,990<br />
135.600<br />
414,400<br />
409,464<br />
314,813<br />
221,797<br />
590,229<br />
494,470<br />
512,877<br />
598,300<br />
1,015,477<br />
454,500<br />
711.600<br />
527,281<br />
1,236,156<br />
2,554,423<br />
473,547<br />
465,894<br />
500.000<br />
629,460<br />
547,459<br />
542,689<br />
967,920<br />
762,201<br />
948,965<br />
996,576<br />
2,800<br />
5,200<br />
8,159<br />
12,530<br />
6,539<br />
8,977<br />
10,244<br />
36.000<br />
54.000<br />
74,850<br />
120.700<br />
190,200<br />
427,372<br />
709,347<br />
688,332<br />
789,294<br />
461,482<br />
64o,54o<br />
678,501<br />
619,379<br />
958.700<br />
969,850<br />
956,979<br />
1,098,833<br />
1,534,534<br />
2,034,895<br />
563,307<br />
2,251,085<br />
1,953,746<br />
2,215,201<br />
2,208,495<br />
2,170,272<br />
2,622,487<br />
2,354,230<br />
2,410,729<br />
2,820,066<br />
4,060,129<br />
28,000<br />
100,000<br />
150.000<br />
200.000<br />
253.000<br />
257.000<br />
362,250<br />
401,070<br />
496,547<br />
578,887<br />
648,260<br />
610.924<br />
786,039<br />
965,352<br />
1,055,905<br />
1,106,400<br />
971.924<br />
806,495<br />
909,047<br />
1,000,090<br />
1,146,722<br />
1,719,981<br />
1,641,419<br />
1,576,737<br />
1,325,979<br />
1,870,470<br />
1,898,867<br />
2,090,016<br />
2,397,608<br />
3,072,731<br />
2,409,009<br />
3,138,040<br />
2,994,485<br />
5,040,961<br />
4,259,186<br />
3,606,411<br />
3,323,654’<br />
3,635,803<br />
3,774,423<br />
3,869,469<br />
3,885,129<br />
5,289,172<br />
4,312,974<br />
6,140,887<br />
5,956,953<br />
25<br />
Digitized for FRASER<br />
http://fraser.stlouisfed.org/<br />
<strong>Federal</strong> <strong>Reserve</strong> <strong>Bank</strong> <strong>of</strong> <strong>St</strong>. <strong>Louis</strong>
Digitized for FRASER<br />
http://fraser.stlouisfed.org/<br />
<strong>Federal</strong> <strong>Reserve</strong> <strong>Bank</strong> <strong>of</strong> <strong>St</strong>. <strong>Louis</strong><br />
MISCELLANEOUS EXPORTS FROM SAN FRANCISCO TO FOR<br />
EIGN PORTS— 1912.<br />
Agricultural Implements .................... ..........................pkgs. 1,57-1<br />
Arms and Ammunition ........................ ..........................pkgs. 6,270<br />
Asphaltum .............................................. ...........................bbls. 5,944<br />
Bags ........................................................ ..........................bales 2,406<br />
Bark .................................... .................. ............................ctls. 31,229<br />
\cases<br />
2,893<br />
Beer ......................................................... ......................{ casks 1,157<br />
[ bbls. 83<br />
Wax ...... ................................................... .............................lbs. 1,338,583<br />
Boots and Shoes .................................... ..........................cases 4,176<br />
Borax .... .................................................. ............................ ctls. 5,166<br />
Bran and Feed ...................:.................. ............................ctls. 1,674<br />
Bread ....................................................... ............................ctls. 6,259<br />
Building Material:<br />
Brick ................................................... . ................................M 89<br />
Doors .................................................... ............................. No. 1,095<br />
Laths ...... .............................................................................M 172<br />
Lumber ............................................... ........ ....................... M 35,848<br />
Shingles ............................................... ................................M 1,662<br />
Various ........ ................................... . ..........................pkgs. 158,393<br />
Butter .................................................... ............................etls.<br />
2,284<br />
Candles ..... ............................................... ..........................cases 30<br />
Canned Goods .............................. .......... .......................... cases 1,308,780<br />
Cement .................................................... ...........................bbls. 233,458<br />
Cigars .............................. ........................ ..........................cases 7<br />
Coal ......................................................... ...........................tons 131<br />
C<strong>of</strong>fee ............................. ........................... ............................ ctls. 11,046<br />
Cordage .................................................. ..............-......— pkgs.- 7,168<br />
Cotton .......... ............................................ ...... ...................bales 211,251<br />
Drugs ....................................................... ..........................cases 4,026<br />
Codfish ........... ......................................... ............................ctls. 3,499<br />
Dry Fruits:<br />
Prunes ................................................. ............................ctls. 430,894<br />
Raisins ......... .......................... ............ ............................ctls. 107,060<br />
Various ............................................... ............................ctls. 167,913<br />
Fresh Fruits ........................................... .................-........pkgs. 142,843<br />
Dry Goods .............................................. ..........................cases 9,272<br />
Dynamite ................................................. ..........................cases 12,124<br />
Fertilizer ......................................... ....... ............................tons 3,407<br />
Fish:<br />
Salmon ................................................ ..........................cases 511,642<br />
Various ............................................... ..........................pkgs. 13,230<br />
Ginseng .................................................................................lbs. 69,425<br />
Groceries ................................................. ..........................pkgs. 39,117<br />
Hardware ..........................................................................pkgs. 748<br />
Hides ....................................................... ..........................bales 5,721<br />
Honey ........................................ .............. ..........................cases 6.573<br />
Hops .......................................................................................lbs. 826,154<br />
Ivory .............................. .................................... ................. lbs. 3,104<br />
Lard ........................................................ ..... ...................... ctls. 50,574<br />
Leather .................................. ............................................ rolls 16,452<br />
Lime ........................................... .............. ...........................bbls. 708<br />
Live <strong>St</strong>ock ...........................................................................No. 124<br />
Machinery .........................................................................pkgs. 13,078<br />
Malt ........... ............................................. ............................ctls. 22,160<br />
26
Digitized for FRASER<br />
http://fraser.stlouisfed.org/<br />
<strong>Federal</strong> <strong>Reserve</strong> <strong>Bank</strong> <strong>of</strong> <strong>St</strong>. <strong>Louis</strong><br />
Meal ......................................................................................ctls. 10,868<br />
Merchandise ..................................................................... pkgs. 146,003<br />
Metals:<br />
Iron ..................................................................................pkgs. 96<br />
Lead ..................................................................................ctls. 43<br />
<strong>St</strong>eel ................................................................................pkgs. 5,653<br />
Various ..............................................................................ctls. 64,350<br />
Nitrate <strong>of</strong> Soda ................................................................. tons 480<br />
Oils:<br />
Coal ..................................................................................cases 65,994<br />
f gals. 96,052,931<br />
Various ....................................................................... cases 39,184<br />
[ bbls. 2,481,883<br />
Onions ....................................................................... ............sx. 62,915<br />
Paints ..................................................................................pkgs. 11,496<br />
Paper ....................................................................................pkgs. 1,370<br />
Paste ......................................................................................ctls. 70<br />
Pearl Barley ........ ,..............................................................ctls. 2,850<br />
Pipe ............................c.....................................................pkgs. 180<br />
Potatoes ..................................................................................sx. 31,532<br />
Powder ..............................................................................peases 21,059<br />
}kegs 5,506<br />
Provisions:<br />
Beef ..................................................................................ctls. 12<br />
Ham and Bacon .............................................................ctls. 15,695<br />
Various ..............................................................................ctls. 2,347<br />
Quicksilver ....................................................-.................. flasks 105<br />
Railroad Ties ....................................................................... No. 76,337<br />
Rice ........................................................................................ctls. 66,512<br />
Rosin ....................................................................................ctls. 742<br />
Salt ........................................................................................tons 10,566<br />
Seed ......................................................................................ctls. 2,137<br />
Shooks ..................................................................................bdls. 20,502<br />
Soap ....................................................................................cases 4,979<br />
Soda ..................................... ................................................ctls. 15,423<br />
Spirits:<br />
Brandy ............................................................................. gals. 1,975<br />
Whiskey ......................................................................... gals. 19,950<br />
Various ............................................................................gals. 6,299<br />
Sugar ....................................................................................ctls. 24,363<br />
Tallow ....................................................................................ctls. 65,512<br />
Tea ........................................................................................ctls. 678<br />
Tin ..........................................................................................ctls. 6,974<br />
Tobacco ................................................................................ctls. 10,082<br />
Treasure ...................................................................................... $13,955,535<br />
Wine ........................... ........................................................ gals. 770,385<br />
Wire ..................................................................................... coils 356<br />
Value .................................................................................... $55,387,972<br />
27
Digitized for FRASER<br />
http://fraser.stlouisfed.org/<br />
<strong>Federal</strong> <strong>Reserve</strong> <strong>Bank</strong> <strong>of</strong> <strong>St</strong>. <strong>Louis</strong><br />
EXPORTS BY SEA FROM SAN FRANCISCO TO ATLANTIC<br />
PORTS— 1912.<br />
Arsenic, crude .................................. ................................ ctls. 1,218<br />
Asphaltum ......................................................................... bbls. 46,300<br />
Beeswax ............................................... 56<br />
Boots and Shoes .............................. ................................cases 86<br />
Bone black ........................................... 520<br />
Building Material:<br />
Lumber ........................................... .................................... M 95<br />
Various ............................................. .............................. pkgs. 1,022<br />
Canned Fruits .................................... ...............................cases 50,520<br />
Canned Goods .................................... ...............................cases 732,817<br />
Casein ................................................... 11,943<br />
Copper Matte .................................... ..................................ctls. 94,999<br />
Drugs .................................................... 50<br />
Dry Fruits:<br />
Grapes .................................................................................ctls. 420<br />
Prunes .............................................. 67,411<br />
Raisins ............................................ 118,985<br />
Various ............................................ ................................ ctls. 43,211<br />
Fish: Salmon ................................... ............................... cases 153,878<br />
Glue ....................................................... 1,158<br />
Groceries ............................................. .............................. pkgs- 4,765<br />
Hair ...................................................... . 2,497<br />
Hay ....................................................... 20<br />
Herbs .................................................... ....................................sx. 2,077<br />
Hides ..................................................... ..................................ctls. 1,157<br />
Honey .................................................. ............................... cases 2,284<br />
Hops ..................................................... .................................. lbs. 420,517<br />
Horns .................................................... ................................... sx. 2,831<br />
Leather ............................................... ................................ rolls 912<br />
Leather Scrap .................................... .............................. pkgs- 1,131<br />
Machinery .......................................... .............................. pkgs. 712<br />
Malt ..................................................... ..................................ctls. 4,386<br />
Merchandise ........................................ .............................. pkgs. 14,484<br />
Metals:<br />
Lead ................................................... ................................ ctls. 145,154<br />
Various ............................................ .................................ctls. 27,274<br />
Mustard Seed .................................... 1,319<br />
Nuts .......................................................................................ctls. 26,646<br />
Oils: Various ...................................................................cases<br />
168<br />
Pearl Barley ...................................... ........................... .....ctls. 4,200<br />
Quicksilver ......................................... .............................. flasks 9,565<br />
Rice ...................................................... ................................. ctls. 92<br />
Shells ........................................ ........... ...................................sx. 152<br />
Spirits:<br />
Brandy ............................................. ................................ gals. 59,740<br />
Whiskey ............................................................................ gals. 1,832<br />
Various ........................................................................... gals. 1,871<br />
Tallow ................................................... ........................... „...ctls. 1,227<br />
Tea ......................................................... ................................ ctls. 7,260<br />
Tin Scrap ............................................ ................................ ctls. 55,495<br />
Tobacco .............................................. ................................ fttls. 447<br />
Wine ..................................................... ................................. gals. 11,991,348<br />
Wool ..................................................... 137,476<br />
Value ........................................... $17,891,031.00<br />
28
Digitized for FRASER<br />
http://fraser.stlouisfed.org/<br />
<strong>Federal</strong> <strong>Reserve</strong> <strong>Bank</strong> <strong>of</strong> <strong>St</strong>. <strong>Louis</strong><br />
IMPORTS OF RULING ARTICLES OF MERCHANDISE BY SEA<br />
FROM FOREIGN PORTS AT SAN FRANCISCO FOR<br />
YEAR 1912.<br />
Bananas ............................................... 61,428<br />
China Beans ...................................... ............................... pkgs. 13,393<br />
China Merchandise .......................... ............................... pkgs. 535,813<br />
China Oil ........................................... ............................... pkgs. 50,814<br />
Cement ................................................ 197<br />
Cocoa .................................................. 8,771<br />
Cocoanuts ................................................................................. M 2,807<br />
C<strong>of</strong>fee .................................................. ................................ bags 186,482<br />
Copra .................................................. 343,993<br />
}tons 2,860<br />
Cordage ............................... pkgs. 12,980<br />
Firebricks ............................................................................... M 1,369<br />
Gunnies ............................................. ............................... bales 30,355<br />
Hardware ........................................................................... pkgs. 149,084<br />
Hemp ................................................... ............................... bales 36,228<br />
Hides .................................................. ............................... pkgs. 3,145<br />
Iron ...................................................... 4,152<br />
ipkgs. 252,992<br />
Jute ...................................................... ............................... bales 12,349<br />
Kopak ................................................. ............................... bales 7,481<br />
Limes ................................................... ................................... cs. 15,271<br />
Lard ..................................................... ................................ bbls. 2,410<br />
Matting .............................................. ................................ rolls 203,704<br />
Nails ........................................... J........ ................................ kegs 148,018<br />
Nitrate ................................................ .............................. £sx. 239,684<br />
}tons 17,550<br />
Oil ....................................................... ............................. $cs. 34,383<br />
ibbls. 299,751<br />
Olive Oil .................................. ^......... ..................................................................cs. 56,950<br />
Opium .................................................. .............................. pkgs. 6<br />
Pig Iron .............................................. ................................ tons 8,044<br />
Rice ............................. J...................... ............................... mats 494,068<br />
Salt ....................................................... ................................ bags 25,314<br />
Silk ...................................................... ..........................-............... pkgs. 67,197<br />
Soap ................................................................................................. .............................. pkgs. 26,105<br />
Spices ............................................................................................. .............................. pkgs. 12,275<br />
<strong>St</strong>eel ................................................................................................. ............................ $pkgs. 313,687<br />
\tons 710<br />
Sugar ............................................................................................. 704,986<br />
Sulphur ...................................................................................... 191,085<br />
£tons 6,314<br />
Tea ........................................................................ 543,435<br />
Tin .................. 28,301<br />
Vermouth ................................ 32,450<br />
W hiskey ............... ............................... bbls. 2,772<br />
29
FOREIGN EXPORTS FROM SAN FRANCISCO, YEAR 1912.<br />
British<br />
C olu m bia<br />
M e x ico<br />
Central<br />
America &<br />
P a nam a<br />
S outh<br />
Am erica, etc.<br />
E u rop e<br />
Australia &<br />
Pacific Islands<br />
China<br />
Japan<br />
P h ilip p in es<br />
V arious<br />
O riental<br />
Ports<br />
F lou r, B b ls ..................................... 11,2*1 257,418 47 105 42,296 1,760 12,619 93<br />
W h eat, C tls............................... .. IS,784 2,101 26 16,537<br />
B a rle y , C t l s - ................................... 116 9,533 118,518 1,830,081 2 501 1,389<br />
Oats, O tis.......................................... 80 441<br />
C orn, C tls................................................................ 55,866 1,265<br />
166<br />
O n ion s, S a ck s ........................................... 3,061<br />
B ea n s, C tls...................................... 5 356 1 103 11 672<br />
B ra n F eed , C tls................................................ .. 200 554 200<br />
337 6,899 2,088 97 5,268 11<br />
P o ta to e s, P k g s .................................. 1,780 8,327 9,157 4,219 1,181 525<br />
1,600 10 12 809<br />
H o p s, L b s ............................................................ 21,348 3.004 14,066 3,098 42,726 723,186 30,740 950 7,671<br />
B u ild in g M a te ria l—<br />
H a y , T o n s ............................................................... 2,128<br />
34,441<br />
L u m b er, M F t................ ................... 1.434 7 403 6,202 765 15 867 3 55 880 11<br />
S hingles, M ............................ .......................... 475 12 1,103<br />
D oors, N o ...............................................<br />
V a rio u s P k g s ................................................... 65,909 410 261 964 40 43,794<br />
B rick , M ............................................................ 7 74 19<br />
7,596 23,814 4,337 9,255<br />
Lath , M .................................................... .......... 165<br />
Soda, C tls................................................................ 542 81b 1,184 100 1 140 11,005 604<br />
C oke, T o n s —..........................................................<br />
P ru n es, C tls........................................................... 38,279 791 618 438 386,683 11,267<br />
C <strong>of</strong>fee, C tls............................................................ 1,109 3 12 606 1,609 86 7,312 40<br />
Cem ent, B b ls ......................................................... 177,038 24,531 11,029 2,800 400<br />
C ordage, P k g s ....................................................... 533 2,339 468 1,267 926 272<br />
C otton, B a le s........................................................ 15,192 197,459 900<br />
D ry G oods, P k g s ................................................ 313 196 305 12 29 284 14 50 7,810 19<br />
D ru gs, P k g s ........................................................... 551 144 4 129 394 258 1,675 55<br />
F ru its—<br />
R a isin s, C tls.................................................... . 45,950 2,551 1,134 463 1,786 46,566 1,044 2.108 4,128 489<br />
Dried Fruit, Otis..................................... 43,049 1,522 1,250 4,463 93,793 8,6S3 2,867 1,538 765 6,553<br />
Various Pkgs.......................................... 26,779 18,267 9,163 11,669 716 16,888 1,422<br />
Digitized for FRASER<br />
http://fraser.stlouisfed.org/<br />
<strong>Federal</strong> <strong>Reserve</strong> <strong>Bank</strong> <strong>of</strong> <strong>St</strong>. <strong>Louis</strong>
Digitized for FRASER<br />
http://fraser.stlouisfed.org/<br />
<strong>Federal</strong> <strong>Reserve</strong> <strong>Bank</strong> <strong>of</strong> <strong>St</strong>. <strong>Louis</strong><br />
F ish —<br />
S alm on, C a ses.........................<br />
Cod, C tls....................................<br />
V a rio u s P k g s ...........................<br />
C anned G oods, C a ses...............<br />
B ags, B is .........................................<br />
G inseng, L b s .................................<br />
G roceries, P k g s ...........................<br />
H on ey, C a ses................................<br />
D yn am ite, C ases..........................<br />
F e rtilizer, T o n s ............................<br />
L im e, B b ls .....................................<br />
Lea th er, R o lls ...............................<br />
H a rd w a re, P k g s..........................<br />
M a ch in ery, P k g s .........................<br />
M etals—<br />
V a rio u s P k g s ...........................<br />
M alt, C tls........................................<br />
M eals, CtIs......................................<br />
Seeds, C tls.....................................<br />
A rm s and A m m u n ition , P k g s.<br />
O ils -<br />
Coal O il, Caseis.......................<br />
“ G a ls....:...................<br />
O ils— C a ses................................<br />
P a in t, P k g s ....................................<br />
T a llo w , C tls ...................................<br />
T in, C tls...........................................<br />
P a p er, P k g s ...................................<br />
P ow d er, K e g s ................ ...............<br />
‘ ‘ C a ses...............................<br />
P ea rl B a rley, C tls......................<br />
R osin , C tls.................... ............... .<br />
T a n B a rk , C tls............................<br />
P ro v is io n s —<br />
B a co n and H am s, P k g s ........<br />
B u tter, C tls...............................<br />
W a x , C tls...................................<br />
L a rd , C tls............ .....................<br />
V a rio u s P k g s ........................<br />
Q u ick silv er, F la s k s ...................<br />
R ice , C tls.......................................<br />
Salt, T o n s ...................................... .<br />
4,305<br />
195,742<br />
85<br />
21,047<br />
1,232<br />
410<br />
480<br />
557<br />
1,899<br />
3,200<br />
6,311<br />
1,1(4<br />
97<br />
64<br />
4,847<br />
338<br />
1,665<br />
279<br />
161<br />
152<br />
1,831<br />
84<br />
9,741<br />
6,494<br />
159<br />
8,218<br />
468<br />
3,600<br />
642<br />
3,652<br />
3.792<br />
340<br />
574<br />
2,455<br />
7,260<br />
294<br />
5.793<br />
126<br />
""'6<br />
280<br />
184<br />
18<br />
2,717<br />
192<br />
40<br />
568<br />
9,169<br />
912<br />
18,312<br />
220<br />
3,554<br />
120<br />
5,586<br />
1,704<br />
154<br />
668<br />
6,992<br />
6,510<br />
163<br />
391<br />
40,484<br />
4,423<br />
Ifil<br />
10.789<br />
1,508<br />
19,276<br />
‘278<br />
162<br />
11<br />
23<br />
6,378<br />
12<br />
54<br />
39,992<br />
297<br />
35,522<br />
38<br />
25,892<br />
1,0'<br />
’2,028<br />
278<br />
3,594<br />
28<br />
113<br />
14.175<br />
5,734,911<br />
716<br />
3; 54<br />
4,582<br />
3,794<br />
1,947<br />
13<br />
121<br />
281<br />
4.916<br />
5<br />
335,080<br />
951,069<br />
3 694<br />
4,369<br />
23<br />
47.364<br />
11<br />
' 32.519<br />
93,954<br />
607<br />
4,889<br />
956<br />
10,966<br />
74,682 38,589<br />
69,398<br />
.....139 2, >-'26<br />
280<br />
45 1.639<br />
683 ""285<br />
778<br />
1,577<br />
15 954<br />
14,306,175<br />
601 337<br />
295<br />
1,164<br />
1,179<br />
2,792<br />
204<br />
11,371<br />
593 364<br />
2 1,609<br />
63<br />
20<br />
1,732<br />
4,71<br />
339<br />
75<br />
50<br />
'12,573<br />
6,333<br />
400<br />
74,020,845<br />
1,764<br />
112<br />
4.198<br />
29,729<br />
33<br />
150<br />
386<br />
73<br />
20<br />
’ 16,<br />
732<br />
5<br />
25<br />
104<br />
905<br />
.....3<br />
206<br />
176<br />
91<br />
743<br />
536<br />
21<br />
33<br />
126<br />
1.107<br />
1,966<br />
2,307<br />
13,818 46<br />
1.853 673<br />
36,993 147<br />
45
Digitized for FRASER<br />
http://fraser.stlouisfed.org/<br />
<strong>Federal</strong> <strong>Reserve</strong> <strong>Bank</strong> <strong>of</strong> <strong>St</strong>. <strong>Louis</strong><br />
FOREIGN EXPORTS FROM SAN FRANCISCO YEAR 1912.— Cont’ d.<br />
B ritish<br />
('o lu m b ia<br />
M e x ico<br />
. _ . 1<br />
C en tral<br />
America &<br />
P a n a m a<br />
S ou th<br />
Am erica, etc.<br />
! E u rop e<br />
Australia &<br />
Pacific Isla n d s<br />
C h ina<br />
Japan<br />
1<br />
P h ilip p in e s<br />
V a riou s<br />
O riental<br />
Ports<br />
j<br />
900 200 781 210 2,203 100<br />
13,917<br />
30<br />
2,928<br />
312<br />
1,466 4,803 1,270 360<br />
S h ook s, B d ls .......................................................... 6,214 2,668<br />
5,85^<br />
1,651<br />
191,034 111 805,293 1,130,358 130 8,159<br />
R . R . T ie s, No......................................................<br />
9,620 250 61,448<br />
A g ric u ltu ra l Im p le m e n ts ................................ 3 261 277 136 713 10<br />
S p irits —<br />
257<br />
335<br />
315 9,765<br />
1,906<br />
792<br />
81<br />
546<br />
60,570<br />
2,987<br />
120<br />
197<br />
3<br />
50.392<br />
19,042 2,710<br />
2,773<br />
130<br />
558<br />
173<br />
9<br />
353.334<br />
62<br />
9,091<br />
184<br />
1,500<br />
34<br />
9<br />
113,496<br />
9<br />
1,270<br />
1,490<br />
24 6 4,311<br />
13<br />
2,559<br />
147<br />
31,690<br />
181<br />
12,623<br />
7,789<br />
31,027<br />
22<br />
17,386<br />
6,244<br />
23<br />
1,548<br />
25,375<br />
2,822<br />
28,834<br />
19<br />
2,409
Digitized for FRASER<br />
http://fraser.stlouisfed.org/<br />
<strong>Federal</strong> <strong>Reserve</strong> <strong>Bank</strong> <strong>of</strong> <strong>St</strong>. <strong>Louis</strong><br />
IMPORTS INTO SAN FRANCISCO FROM INTERIOR CALIFORNIA<br />
COAST, OREGON, WASHINGTON AND ALASKA FOR<br />
YEAR 1912.<br />
Almonds ..................................................................................sx. 6,131<br />
Apples ..................................................... ................................ bx. 552,346<br />
Bark ....................................................... ............................ cords 15,403<br />
Broomcorn ........................................................................... bdls. 4,558<br />
Butter .................................................... .............................. ctls. 247,755<br />
Calf Skins ............................................. ............................. bdls. 1,933<br />
Cheese ..................................................... .............................. ctls. 121,074<br />
Chicory ............................. bbls. 245<br />
Dry Fish ............................................................................. bdls. 141<br />
Eggs ......................................................... .............................. doz. 19,267,57~4<br />
Furs ............................. bdls. 8<br />
Hides ....................................................................................$No. 234,257<br />
Jbdls. 58,122<br />
Honey ...................................................... ................................. cs. 8,215<br />
Laths ..................................................... .................................. M 10,342<br />
Leather ................................................... .............................. rolls 30,903<br />
Lime ........................................................ .............................bbls. 228,325<br />
Live <strong>St</strong>ock ................................... ......... ................................No. 124,468<br />
Malt ............. -......................................... ................................. sx. 60,210<br />
Oil ............................................................ ....... ..................... bbls. 5,870,064<br />
Oranges and Lemons ......................... ................................. cs. 295,911<br />
Oysters ................................................. .........................sx. 9,465<br />
Paper ...................................................... ...........................reams 319,156<br />
Peas ................................. sx. 3,004<br />
Pelts ........................................................................................No. 226,556<br />
Piles ........................................................ ............................... No. 23,753<br />
Poles ........................................................ ............................... No. 52,042<br />
Posts ....... .................................... ....................... No. 113,400<br />
Quicksilver ................................................... ...............flasks 12,327<br />
Railroad Ties ..... ................. No. 105,000<br />
Raisins .............................................................................cs. 1,323,403<br />
Rice .........................sx. 3,102<br />
Salt ....................................................................................... tons 1,500<br />
Seal Skins ............................................. ................................No. 3,764<br />
Shingles ................................................................................... M 82,872<br />
Shooks .................................................... ............................. bdls. 367,346<br />
Skins ....................................................... ................................No. 6,297<br />
<strong>St</strong>ave Bolts .......................................... ............................ cords 7,650<br />
Sugar ....................................................... ..........................................c tls . 2,173,948<br />
Tallow ....................................... ...................... c tls . 51,568<br />
Wood ......................................... 3,193<br />
Walnuts ........................ 11,830
Digitized for FRASER<br />
http://fraser.stlouisfed.org/<br />
<strong>Federal</strong> <strong>Reserve</strong> <strong>Bank</strong> <strong>of</strong> <strong>St</strong>. <strong>Louis</strong><br />
IMPORTS INTO SAN FRANCISCO FROM H A W A IIA N ISLANDS.<br />
Y ea r<br />
Sugar, sks. |<br />
C<strong>of</strong>fee, bags.<br />
Hides. •<br />
B a nanas<br />
b u n ch es.<br />
R ice, b a g s.<br />
M olasses,<br />
b b ls.<br />
T a llo w ,<br />
bbls.<br />
C anned<br />
P in eap p les,<br />
cases.<br />
H o n e y ,<br />
cases.<br />
W ool, sks.<br />
1912 4,428,862 13,459 15,800 218,299 38,131 59,601 368 647.627 5,482 5<br />
1911 4,147,826 17,787 13,104 150,284 45,054 30,450 273 437,724 5,827<br />
1910 3,830,929 15,622 13,563 137,172 54,897 23,534 27 4.637 22<br />
1909 3,701,078 19,035 18,299 138,664 46,578 4,722<br />
1908 4,028,152 14,383 15,347 143,878 38,157 219 17,943 5,082 576<br />
1907 2,931,681 8,163 10,773 147,010 31,767 304 4,237<br />
1906 4,189,286 9,995 13,124 148,277 26,493 96 372 2,347 931<br />
1905 4,627,088 8,819 11,633 165,138 46,393 4 155 5,624 829<br />
EXPORTS FROM SAN FRANCISCO TO HAW AIIAN ISLANDS—<br />
YEAR 1912.<br />
Agricultural Implements .................................................pkgs. 269<br />
Arms and Ammunition ...................................................pkgs. 4,007<br />
Bags ..................................................................................... bales 1,438<br />
f cs. 2,137<br />
Beer ............................................................ .....................^ casks<br />
2,186<br />
bbls. 463<br />
Boots and Shoes .................................... .............................. cs. 5,089<br />
Bran and F e e d ........................................ .............................ctls. 22,361<br />
Bread ......................................................................................ctls.' 13,018<br />
Building Material:<br />
Bricks .................................................... ............................... M 1,266<br />
Doors ...................................................... ............................. No. 1,801<br />
Lumber ................................... .............. ............................... M 4,518<br />
Shingles ................................................ ........................... ...M 1,833<br />
Various .......... ..................................... .......................... pkgs- 15,963<br />
Butter ....................................................................................ctls.. 7,979<br />
Candles ......................................................................................cs. 1,524<br />
Canned Goods ..........................................................................cs. 150,940<br />
Cement ......... -........................................... ...........................bbls. 135,509<br />
Cigars .........................................................................................cs. 1,407<br />
Coal ........................................................... ............................tons 152<br />
C <strong>of</strong>fee......................................................... ............................ ctls. 859<br />
Cordage .................................................... ..........................Pkgs. 4,886<br />
Drugs ........................................................ ............................... cs. 10,588<br />
Dry Fish:<br />
Codfish ................................................. ............................ ctls. 5,765<br />
Dynamite ...... —........................................ ............................... cs. 864<br />
Dry Fruits:<br />
Prunes ................................................... ............................ ctls. 241<br />
Raisins ..............................................................-..................es. 1,333<br />
Various .........................................................................jetis. 2,439<br />
Jpkgs. 131,943<br />
Dry Goods ................................................ 8,710<br />
F ertilizer................................................... 21,205<br />
Fish:<br />
Salmon .................................................. 7,244<br />
Jbbls. 4,016<br />
Various ................................................. ..........................pkgs. 960<br />
Furniture ................................................ ..........................pkgs. 339<br />
34
Digitized for FRASER<br />
http://fraser.stlouisfed.org/<br />
<strong>Federal</strong> <strong>Reserve</strong> <strong>Bank</strong> <strong>of</strong> <strong>St</strong>. <strong>Louis</strong><br />
Groceries ........................................... - ............................. pkgs. 20,397<br />
Hardware ........................................... ............................... pkgs.<br />
4,710<br />
Hay ..................................................... 8,795<br />
Hops .................................................... .................................. lbs. 18,222<br />
Lard .....................................................<br />
14,480<br />
Leather ................................... ............................................. rolls 1,585<br />
Lime ..................................................... 7,615<br />
Live <strong>St</strong>ock ......................................... .................................. No. 822<br />
Machinery ......................................... ............................... pkgs. 3,601<br />
Malt ..................................................... 7,275<br />
Meal ...................................................... 294<br />
Merchandise ....................................... ............................... pkgs. 56,471<br />
Metals:<br />
Iron ................................................. ............................. ..pkgs. 1,025<br />
Lead ................................................ 4,953<br />
<strong>St</strong>eel ................................................................................. pkgs. 6,297<br />
Various ........................................................................... pkgs. 5,390<br />
Nails .................................................... 239<br />
Oils:<br />
C o a l................................................... .................................... cs. 185,738<br />
Various ................................ ............ .............................. fbbls. 1,287,182<br />
^cs. 27,130<br />
Onions ................................................... .................................. sks. 17,606<br />
Paints ................................................... .................................... cs. 15,086<br />
Paper ................................................... ............................... pkgs. 578<br />
Paste .................................................... ............................... pkgs. 359<br />
Pipe ...................................................... ............................... pkgs. 2,388<br />
Potatoes ................................................................................. sks. 64,900<br />
Powder ................................................ .............................. $cs. 11,899<br />
£kegs 5,768<br />
Provisions:<br />
Beef ................................. -............... .................................ctls. 27<br />
Ham and Bacon ........................... ................................. ctls. 8,414<br />
Various ........................................... ............................... pkgs. 3,004<br />
Railroad material ............................. ............................... pkgs. 529<br />
Railroad ties .................................... ,. .................................. No. 44,282<br />
Rice ...................................................... ................................. ctls. 5,142<br />
Salt ...................................................... ................................ tons 1,330<br />
Seed ..... ................................................ ................................. ctls. 533<br />
Shooks ................................................. ............................... bdls. 22,267<br />
Soap ................................... ................ ....... ...........................cs. 23,981<br />
Soda ................................................... .......... ..................... ctls. 6,383<br />
Spirits :<br />
Brandy ............................................ ................................ gals. 15,306<br />
Whiskey .......................................... ................................ gals. 40,205<br />
Various .............................................................................gals. 12,850<br />
Sugar .................................................... ................................. ctls. 12,732<br />
Tallow ................................................. ................................ ctls. 436<br />
Tea ........... ............................................. .................................. lbs. 865<br />
Tin ........................................................ 4,312<br />
Tinplate .............................................. 11,932<br />
Tobacco ................................................ 11,654<br />
Treasure ............................................. .............................$ 27,000<br />
Wine ........................ 914,649<br />
Wire ........................ 540<br />
Value ..................................... $18,178,418<br />
35
Digitized for FRASER<br />
http://fraser.stlouisfed.org/<br />
<strong>Federal</strong> <strong>Reserve</strong> <strong>Bank</strong> <strong>of</strong> <strong>St</strong>. <strong>Louis</strong><br />
RECEIPTS OE PRODUCE AT SAN FRANCISCO, FROM ALL SOURCES, 1912<br />
D ate<br />
F lou r,<br />
Qrs.<br />
W h eat<br />
Ctls.<br />
B a rley<br />
Ctls.<br />
Oats<br />
Ctls.<br />
B eans<br />
Sx.<br />
C orn<br />
Ctls.<br />
R y e<br />
Ctls.<br />
B ra n<br />
Sx.<br />
M id d .<br />
P ota toes<br />
Sx.<br />
O n ion s<br />
H a y<br />
T on s<br />
<strong>St</strong>raw<br />
Tons<br />
H op s<br />
Bales<br />
F la x <br />
seed<br />
Sx.<br />
M usta<br />
rd<br />
Sx.<br />
W o o l<br />
Sx.<br />
1912<br />
J a n u a r y .....<br />
F e b ru a ry ...<br />
M a r c h .........<br />
A p r i l ...........<br />
M a y .............<br />
J u n e.............<br />
J u l y .............<br />
A u g u st........<br />
Septem ber..<br />
O cto b e r......<br />
N ovem ber..<br />
D ecem ber...<br />
1911-1912.....<br />
1910-1911.....<br />
1909-1910.....<br />
1908-1909.....<br />
1907-1908.....<br />
1906-1907.....<br />
1905-1906.....<br />
1904-1905.....<br />
1903-1904.....<br />
1902-1903.....<br />
1901-1902.....<br />
1900-1901.....<br />
1899-1900.....<br />
1898-1899.....<br />
1897-1898.....<br />
1896-1897.....<br />
1895-1896.....<br />
1894-1895.....<br />
1893-1894.....<br />
1892-1893.....<br />
1891-1892.....<br />
313,913<br />
412,239<br />
369,046<br />
504,258<br />
430,836<br />
445,827<br />
416,096<br />
441,861<br />
354,481<br />
468,353<br />
455,989<br />
494,256<br />
4,727,648<br />
3,835,088<br />
3.351,972<br />
3,631,787<br />
3.542,579<br />
4,122,717<br />
3,262,446<br />
4,749,728<br />
5,566,942<br />
6,062,804<br />
6,791,385<br />
6,627,493<br />
6,081,975<br />
5,654,585<br />
5,301,903<br />
5,840,683<br />
5,452,574<br />
5,162,439<br />
4,213,022<br />
5,512,921<br />
5,190,045<br />
277,170<br />
219,65 *<br />
242,179<br />
348,709<br />
487,834<br />
247,403<br />
259,405<br />
143,549<br />
374,194<br />
625,445<br />
474,821<br />
490,142<br />
3,514,004<br />
3,139,671<br />
3,129,343<br />
2,735,312<br />
2,341,035<br />
1,027,839<br />
3,710,837<br />
2,840,918<br />
2,512,618<br />
6,242,859<br />
10,310,905<br />
8,918,523<br />
7,044,322<br />
3,164,712<br />
10,325,677<br />
10,851,287<br />
10,566,180<br />
11,315,592<br />
10,712,778<br />
12,155,559<br />
13,813,751<br />
217,617<br />
245,228<br />
120,909<br />
! 92,907<br />
236,176<br />
184,894<br />
235,270<br />
549,074<br />
541,968<br />
692,416<br />
581,594<br />
714,336<br />
4,414,925<br />
7,813,331<br />
3,293,432<br />
3,912,439<br />
2,705,771<br />
4,445,484<br />
2,907,478<br />
3,591,523<br />
5,584,531<br />
5,000,500<br />
6,332,321<br />
3,731,347<br />
5,255,785<br />
1,386,643<br />
4,465,125<br />
5,081,697<br />
3,419,104<br />
1,850,518<br />
3,628,110<br />
3,386,821<br />
2,611,056<br />
82,390<br />
28,750<br />
39,845<br />
28,224<br />
23,576<br />
10,523<br />
55,295<br />
41,055<br />
87,170<br />
135,168<br />
66,767<br />
74,547<br />
683,706<br />
661,865<br />
507,035<br />
421,713<br />
601,909<br />
648.211<br />
587,539<br />
866,414<br />
871,712<br />
777,774<br />
842,410<br />
661.139<br />
823,169<br />
638.139<br />
689,072<br />
545,848<br />
666,254<br />
701,051<br />
644,752<br />
594,383<br />
575.211<br />
49,024<br />
19,873<br />
64,900<br />
21,285<br />
39,403<br />
57,468<br />
26,215<br />
26,210<br />
32,968<br />
171,732<br />
144,432<br />
57,615<br />
921.556<br />
844,426<br />
771,214<br />
721,339<br />
404,871<br />
624,721<br />
748,180<br />
666,348<br />
729,319<br />
704,837<br />
718,772<br />
543,100<br />
366,220<br />
407,566<br />
569,243<br />
588,138<br />
536,147<br />
493,883<br />
535,967<br />
577.315<br />
500,780<br />
5,155<br />
7,900<br />
8,255<br />
11,030<br />
10,798<br />
14,528<br />
22,225<br />
14,490<br />
5,934<br />
7,571<br />
8,038<br />
11,914<br />
T o t ’l 1912... 5,107,155 4,180,569 4,512,389 673,310 711,125 127,838<br />
10«,026<br />
102,710<br />
97,546<br />
49,458<br />
45,876<br />
46,891<br />
125,768<br />
324,588<br />
166,496<br />
139,145<br />
151,267<br />
139,132<br />
171.059<br />
202,251<br />
386,726<br />
342,537<br />
258,606<br />
208,821<br />
374,536<br />
312,447<br />
319,920<br />
2,720<br />
1,980<br />
340<br />
1,160<br />
275<br />
865<br />
1,265<br />
130<br />
535<br />
1,915<br />
5,225<br />
2,210<br />
18,650<br />
20.635<br />
11,610<br />
5,240<br />
13,724<br />
12,920<br />
13,444<br />
38,710<br />
57,745<br />
61.636<br />
187,428<br />
313,188<br />
181,368<br />
106,945<br />
38,486<br />
48,449<br />
222,937<br />
101,589<br />
44,860<br />
41,102<br />
109,779<br />
121,238<br />
69,479<br />
48,510<br />
49,632<br />
77,311<br />
35,288<br />
15,387<br />
63,768<br />
25,890<br />
38,972<br />
57,713<br />
50,725<br />
27,493<br />
560,168<br />
584,369<br />
405,953<br />
393,864<br />
362,358<br />
538,351<br />
819,822<br />
691,573<br />
463,428<br />
611,116<br />
606,078<br />
568,959<br />
651,162<br />
671,704<br />
547,414<br />
645,461<br />
592,135<br />
590,290<br />
557,707<br />
6,593<br />
6,355<br />
4,240<br />
3,971<br />
8,019<br />
5,952<br />
9,110<br />
6,363<br />
7,424<br />
7,763<br />
9,239<br />
8,313<br />
85,045<br />
71,661<br />
80,642<br />
104,544<br />
113,965<br />
132,262<br />
116,069<br />
136,071<br />
149,317<br />
204,596<br />
165,131<br />
148,379<br />
147,664<br />
130,868<br />
134,074<br />
144,685<br />
100,297<br />
132,274<br />
77,358<br />
64,269<br />
74,036<br />
121,967<br />
120,144<br />
95,992<br />
132,323<br />
184,185<br />
112,514<br />
1,442,979<br />
1,427,299<br />
1,384,783<br />
1,337,928<br />
1,118,449<br />
1,041,523<br />
1,214,951<br />
1,323,218<br />
1,368,201<br />
1,344,710<br />
1,390,204<br />
1,530,090<br />
1,255,259<br />
1,142,712<br />
1,137,938<br />
1,138,322<br />
1,034,964<br />
1,147,652<br />
1,308,700<br />
1,277,067<br />
1,199,788<br />
14,090<br />
8,940<br />
9,922<br />
8,265<br />
16,396<br />
23,718<br />
19,525<br />
41,827<br />
38,284<br />
85,771<br />
26,913<br />
17,687<br />
75,142 1,360.044 311,338<br />
357,703<br />
253,400<br />
238,923<br />
224,213<br />
146,653<br />
182,131<br />
186,955<br />
159,037<br />
168,561<br />
229.666<br />
223,444<br />
184.667<br />
175,067<br />
198,662<br />
127,965<br />
143,200<br />
140,107<br />
137,065<br />
9,119<br />
8,569<br />
11,547<br />
9,220<br />
9,976<br />
8,909<br />
18,441<br />
24,301<br />
14,038<br />
10,218<br />
9,007<br />
8,480<br />
147,483<br />
184,594<br />
168,220<br />
164,648<br />
193,676<br />
200,349<br />
165,384<br />
179,622<br />
176,517<br />
166,437<br />
149,464<br />
162,892<br />
159,102<br />
133,560<br />
133,597<br />
145,487<br />
140,386<br />
145,033<br />
129,704<br />
129,206<br />
127,418<br />
150<br />
259<br />
60<br />
95<br />
50<br />
81<br />
100<br />
195<br />
289<br />
170<br />
90<br />
103<br />
1,305<br />
1,081<br />
1,870<br />
2,079<br />
517<br />
1,467<br />
452<br />
260<br />
1,450<br />
217<br />
48<br />
239<br />
476<br />
257<br />
3,186<br />
2,430<br />
1,800<br />
3,273<br />
142,825 1,642 14,088<br />
17,050<br />
15,852<br />
12,448<br />
20,854<br />
8,727<br />
11,236<br />
44,090<br />
39,755<br />
28,458<br />
15,558<br />
8,942<br />
8,551<br />
11,707<br />
11,578<br />
8,857<br />
7,738<br />
11,863<br />
13,298<br />
8,725<br />
8,913<br />
9,714<br />
427<br />
433<br />
2,848<br />
3,192<br />
2,497<br />
2,166<br />
3,473<br />
2,746<br />
12,988<br />
50,722<br />
19,391<br />
130,992<br />
99,515<br />
60,804<br />
36,864<br />
16,017<br />
23,360<br />
35,565<br />
100,358<br />
45,990<br />
10,578<br />
19,388<br />
66,108<br />
104<br />
315<br />
93<br />
1,353<br />
2,365<br />
7,169<br />
1,497<br />
2,037<br />
1,783<br />
2,174<br />
168<br />
2,704<br />
2,462<br />
4,556<br />
5,340<br />
9,772<br />
6,457<br />
21,683<br />
5,629<br />
10,886<br />
36,770<br />
58,126<br />
53,945<br />
69,769<br />
27,864<br />
21,481<br />
5,289<br />
4,002<br />
1,585<br />
4,801<br />
7,755<br />
10,697<br />
6,852<br />
5,064<br />
4,498<br />
4,014<br />
2,989<br />
971<br />
58,517<br />
52,120<br />
56,087<br />
38,978<br />
66,180<br />
41,802<br />
38,085<br />
33,272<br />
79,878<br />
73,845<br />
71,234<br />
76,258<br />
58,947<br />
61,533<br />
82,832<br />
77,935<br />
89,439<br />
76,945<br />
98,243<br />
92,143<br />
99,420<br />
94,641
Digitized for FRASER<br />
http://fraser.stlouisfed.org/<br />
<strong>Federal</strong> <strong>Reserve</strong> <strong>Bank</strong> <strong>of</strong> <strong>St</strong>. <strong>Louis</strong><br />
CEREAL STATISTICS<br />
CLEARANCES FROM SAN FRANCISCO<br />
Flour<br />
bbls.<br />
Wheat<br />
ctls.<br />
B a rley<br />
c tls.<br />
Oats<br />
ctls.<br />
Corn<br />
ctls.<br />
Rye<br />
ctls.<br />
1911<br />
July --------------------------<br />
A u g u st -------------------------------<br />
S e p te m b e r ________________<br />
O c t o b e r ___________________<br />
N ovem ber ________________<br />
D e c e m b e r --------------------------<br />
30,784<br />
29,325<br />
30,705<br />
33,141<br />
31,992<br />
31,884<br />
226<br />
16,114<br />
138,707<br />
67,243<br />
77,459<br />
184<br />
152,710<br />
820,104<br />
288,677<br />
287,698<br />
534,751<br />
307,657<br />
122<br />
479<br />
140<br />
50<br />
300<br />
224<br />
168<br />
32<br />
32<br />
2,322<br />
1,393<br />
T o ta l fo r six m onth s<br />
1912<br />
Jan uary __________________<br />
F e b ru a ry _________________<br />
M a r c h _____________________<br />
A p ril ______________________<br />
M a y ------------------------------------<br />
J u n e _______________________<br />
187,831<br />
32,518<br />
39,405<br />
38,669<br />
25,962<br />
38,812<br />
28,046<br />
299,933<br />
7.189<br />
145<br />
5<br />
262<br />
7.190<br />
280<br />
2,390,697<br />
140,894<br />
153,781<br />
54,275<br />
127,050<br />
50,301<br />
76,686<br />
1,177<br />
185<br />
255<br />
40<br />
4,171<br />
176<br />
127<br />
2,997<br />
4,385<br />
18,593<br />
T o ta l fo r s ix m onthsj 203,412<br />
J u ly<br />
39,017<br />
A u g u s t ------<br />
58,276<br />
Septem ber<br />
25,994<br />
O ctober<br />
34,820<br />
N ovem ber<br />
25,592<br />
D ecem ber _<br />
35,984!<br />
T o ta l fo r six m onth s<br />
T o ta l 1911-12______________<br />
T o t a l 1910-11 ---------------------<br />
T o ta l 1909-10 _____________<br />
T o ta l 1908-09 _____________<br />
T o ta l 1907-08 _____________<br />
T o ta l 1906-07 _____________<br />
T o ta l 1905-06 _____________<br />
T o ta l 1904-05 _____________<br />
T o ta l 1903-04 _____________<br />
T o ta l 1902-03 _____________<br />
T o ta l 1901-02 _____________<br />
T o ta l 1900-01 _____________<br />
T o ta l 1899-00 _____________<br />
T o ta l 1898-99 _____________<br />
T o ta l 1897-98 _____________<br />
T o ta l 1896-97 _____________<br />
219,683)<br />
391,2431<br />
278,5591<br />
220,7951<br />
234,529;<br />
305,826<br />
455,967<br />
540,669<br />
763,068<br />
879,366 1,082<br />
988,864 5,544<br />
178,235<br />
91,684<br />
5,783<br />
9,416<br />
4,266<br />
19,103<br />
•Includes 248,100 cen tals b y r a il.<br />
15,071! 602,987<br />
217 93,299<br />
2,388 323,009<br />
220 460,403<br />
465, 445,170!<br />
2411 400,158<br />
540 547,462<br />
269,501<br />
993,684<br />
962,292<br />
983,610<br />
740,789<br />
782,104<br />
,237,397<br />
548<br />
510<br />
353<br />
176 ,418,790<br />
541 2 ,030,016<br />
572 4 ,260,551<br />
851 3 ,544,859<br />
9,671. 107 4 ,281,182<br />
7,990 186 2 ,119,292<br />
6,519 771 *4 ,251,236<br />
2,285 862<br />
10,056, 558<br />
10,092, 012<br />
480<br />
1,340<br />
107<br />
'§2^120<br />
4,650<br />
109<br />
38,326<br />
l,657i<br />
88,334<br />
1,714!<br />
3,044<br />
4,701<br />
6,212<br />
23,427<br />
114,886<br />
37,029<br />
56,626!<br />
145,827<br />
125,449j<br />
220,795<br />
23,905<br />
22,440<br />
26,278<br />
18,189<br />
10,890'<br />
2,494<br />
1,599<br />
645<br />
33,817.<br />
30,449|<br />
51,896..<br />
9,222!<br />
9,813 .<br />
6,172<br />
13,061<br />
43,788<br />
191,453<br />
18,989<br />
51,139<br />
14,718<br />
4,266<br />
20,220<br />
46,339<br />
70<br />
70<br />
-<br />
x ,m<br />
is<br />
478<br />
603<br />
120,852<br />
258,963<br />
117,710<br />
54,215<br />
69<br />
166,501
Digitized for FRASER<br />
http://fraser.stlouisfed.org/<br />
<strong>Federal</strong> <strong>Reserve</strong> <strong>Bank</strong> <strong>of</strong> <strong>St</strong>. <strong>Louis</strong><br />
HIGHEST AND LOWEST PRICES NO. 1 FEED BARLEY. SELLER M AY 1912.<br />
>1<br />
oS<br />
n<br />
Septem ber<br />
H ig h . L ow ,<br />
O ctober<br />
H ig h . L ow .<br />
N ovem b er<br />
H igh . L ow .<br />
D ecem ber<br />
H ig h . L ow .<br />
Jan uary<br />
H ig h . L ow .<br />
F eb ru a ry<br />
H ig h . L o w .<br />
M arch<br />
H igh . L o w .<br />
1<br />
2<br />
4<br />
5<br />
6<br />
7<br />
8<br />
9<br />
10<br />
11<br />
12<br />
13<br />
14<br />
15<br />
16<br />
17<br />
18<br />
19<br />
20<br />
21<br />
22<br />
23<br />
24<br />
25<br />
26<br />
27<br />
28<br />
29<br />
30<br />
31<br />
1 72 1 72<br />
1 704 1 704<br />
S unday<br />
H o lid a y<br />
1 68 1 68<br />
1 68 1 67i<br />
1 70 1 691<br />
H o lid a y<br />
Sund ay<br />
1 71! 1 714<br />
1 71i<br />
1 73<br />
1 714<br />
1 72<br />
Sund ay<br />
1 75 1 74J<br />
744<br />
1 m 1 744<br />
1 74i<br />
S unday<br />
1 81 1 81<br />
1 834 1 824<br />
1 831 1<br />
1 81 1 804<br />
F o r M on th<br />
1 83f 1 671<br />
Sund ay<br />
1 824 1 82<br />
1 834 1 81|<br />
1 82 1 82<br />
1 79 1 79<br />
1 83i 1 80<br />
Sunday<br />
H o lid a y<br />
1 804 1 804<br />
H o lid a y<br />
Su n d ay<br />
864 1 83!<br />
1 1 874<br />
1 89! 1 88|<br />
1 914 1 904<br />
1 954 1 934<br />
1 974 1 964<br />
S unday<br />
2 00i 1 99<br />
1 99 1 984<br />
S unday<br />
2 00 1 99<br />
F or M onth<br />
2 004 1 79<br />
2 00 1 994<br />
1 98i 1 97<br />
1 964 1 941<br />
1 974 1 971<br />
S u n d ay<br />
2 004 1 98<br />
2 054 2 024<br />
2 074 2 06<br />
2 074 2 044.<br />
2 06 2 04<br />
S u n d ay<br />
2 05 2 02<br />
2 03!<br />
2 00<br />
2 00<br />
1 984<br />
2 014<br />
1 99!<br />
1 99<br />
1 98<br />
2 034 2 01<br />
S u n d a y •<br />
044 2 044<br />
2 C9<br />
2 02<br />
2 044<br />
2 024<br />
1 994<br />
2 05<br />
2 02<br />
2 04<br />
2 00<br />
1 994<br />
Sund ay<br />
1 98 1 924<br />
1 93 1 92<br />
1 91i 1 904<br />
H o lid a y<br />
F or M onth<br />
2 074 1 904<br />
1 90 1 88<br />
1 87 1 86<br />
S unday<br />
1 84<br />
1 83<br />
1 79<br />
1 84<br />
1 85<br />
1 82!<br />
1 80<br />
1 76t<br />
1 77<br />
1 844<br />
Sun day<br />
1 884 1 864<br />
1 87 1 86<br />
1 85 1 844<br />
1 85 1 87<br />
1 884 1 874<br />
Sund ay<br />
1 90 1 90<br />
1 914 1 91<br />
1 944 1 94<br />
Su n day<br />
1 974 1 95!<br />
2 001- 2 00<br />
1 98 1 94<br />
1 97 1 964<br />
Sund ay<br />
1 97 1 97<br />
F or M on th<br />
2 00| 1 82!<br />
H o lid a y<br />
2 02 2 001<br />
1 96| 1 96i<br />
2 00 1 974<br />
2 014 2 01<br />
Sund ay<br />
2 024 2 024<br />
2 05 2 024<br />
2 024 2 024<br />
2 014 2 014<br />
2 034 2 03<br />
2 031<br />
Sund ay<br />
2 02 2 01<br />
1 98<br />
1 97<br />
1 95<br />
1 95<br />
1 954<br />
1 97<br />
1 954<br />
1 924<br />
1 94<br />
1 95<br />
S u n d ay<br />
1 95 1 924<br />
91<br />
1 874<br />
1 874<br />
1 88<br />
1 90<br />
1 89<br />
1 874<br />
1 85:<br />
1 86-<br />
1 89<br />
S u n d ay<br />
1 90* 1 904<br />
1 894 1 89<br />
F or M on th<br />
2 05 1 854<br />
1 824 1 814<br />
1 824 1 804<br />
1 79! 1 78!<br />
S u n d a y<br />
1 84 1 80<br />
1 85<br />
1 86<br />
1 90<br />
1 864<br />
1 90<br />
1 85<br />
1 85<br />
1 89!<br />
1 864<br />
1 874<br />
S u n d ay<br />
H o lid a y<br />
1 90 1 90<br />
1 88! 1 874<br />
1 864 1 86i<br />
1 85i 1 84J<br />
S u n d ay<br />
1 90 1 89<br />
1 884 1 854<br />
1 88 1 86!<br />
H o lid a y<br />
1 1<br />
1 84 1 83<br />
Sund ay<br />
1 84 1 834<br />
1 81 804<br />
1 82 1<br />
1 80 1 794<br />
F o r M on th<br />
1 90 1 78;<br />
1 79 1 784<br />
1 83 1 82<br />
S u n d a y<br />
1 82 1 804<br />
1 804 1 79<br />
1 874 1 85<br />
1 874 1 86<br />
1 87 1 87<br />
Sund ay<br />
1 874 1 864<br />
1 85 1 85<br />
1 834 1 824<br />
1 844 1 8<br />
S u n d a y<br />
1 854 1 854<br />
1 864 1 !<br />
1 84<br />
1 83<br />
1 83<br />
1 84<br />
1 85<br />
1 87<br />
1 87<br />
S unday<br />
1 !<br />
1 824<br />
1 824<br />
1 831<br />
1 85<br />
1 85!<br />
F o r M on th<br />
1 874 1 784
Digitized for FRASER<br />
http://fraser.stlouisfed.org/<br />
<strong>Federal</strong> <strong>Reserve</strong> <strong>Bank</strong> <strong>of</strong> <strong>St</strong>. <strong>Louis</strong><br />
HIGHEST AND LOWEST PEICES NO. 1 FEED BAELEY.<br />
SELLER M AY 1913.<br />
June<br />
H ig h . L ow .<br />
J u ly<br />
H ig h . L o w .<br />
A u gu st<br />
H ig h . L o w .<br />
Septem ber<br />
H ig h . L ow .<br />
O ctober<br />
H ig h . Low .<br />
N o v e m b e r<br />
H ig h . L ow .<br />
D ecem ber<br />
H ig h . L o w .<br />
Sun day<br />
1 62A 1 62<br />
1 594 1 59i<br />
1 55<br />
S unday<br />
1 521 1 52j<br />
1 52f 1 521<br />
1 52 1 52<br />
1 501 1 50:<br />
1 494 1 49i<br />
Sunday<br />
1 49 1 48}<br />
1 49|<br />
1 52i<br />
1 534<br />
1 54<br />
1 491<br />
1 52i<br />
1 52<br />
1 53$<br />
S u n d ay<br />
1 52 1 51}<br />
1 514 1 514<br />
1 49 1 49<br />
Sunday<br />
F o r M onth<br />
1 621 1 48i<br />
1 461<br />
1 45<br />
1 46<br />
1 433<br />
H o lid a y<br />
C losed<br />
C losed<br />
S u n d a y<br />
1 40 1 39!<br />
1 41} 1 41|<br />
1 44}<br />
1 42#<br />
1 44<br />
1 424<br />
S u n d a y<br />
1 38i 1 38i<br />
1 40 1 40<br />
1 39 i m<br />
1 38 1 371<br />
1 374 1 374<br />
S u n d a y<br />
1 354 1 35}<br />
1 35 1 35<br />
1 33 1 32}<br />
S u n d a y<br />
1 311 1 314<br />
1 31i 1 301<br />
1 284 1 284<br />
F o r M on th<br />
1 461 1 284<br />
1 254 1 24<br />
1 21f 1 204<br />
1 214 1 204<br />
S u n d ay<br />
1 234 1 23<br />
1 211<br />
1 24<br />
1 264<br />
1 29<br />
S unday<br />
1 311<br />
1 281<br />
1 254<br />
1 261<br />
1 30<br />
1 311<br />
S u n d ay<br />
1<br />
1 311<br />
1 371<br />
1 35<br />
36<br />
1<br />
1 2L<br />
1 24<br />
1 264<br />
1 29<br />
1 311<br />
1 261<br />
1 241<br />
1 261<br />
1 30<br />
1 31<br />
1 32<br />
1 311<br />
1 32<br />
1 35<br />
1 354<br />
1 481<br />
S u n d ay<br />
1 414 1 394<br />
1 43 1 43<br />
1 471 1 461<br />
1 50 1 471<br />
1 494 1 481<br />
F o r M on th<br />
1 50 1 204<br />
S u n d ay<br />
H o lid a y '<br />
H o lid a y<br />
1 50 1 47<br />
1 504 1 494<br />
1 504 1 504<br />
1 48 1 474<br />
S u n d ay<br />
H o lid a y<br />
1 501 1 49<br />
1 481 1 47<br />
1 481 1 481<br />
1<br />
1 48<br />
S u n d a y<br />
1 451<br />
1 424<br />
1 42<br />
1 40<br />
1 391<br />
1 471<br />
1 471<br />
1 451<br />
1 414<br />
1 41<br />
1 394<br />
1 391<br />
S u n d ay<br />
1 424 1 401<br />
1 451 1 444<br />
1 434 i 421<br />
1 421 1 404<br />
1 401 1 394<br />
1 40 1 394<br />
S u n d ay<br />
1 43 1 42<br />
F o r M on th<br />
1 5^4 1 394<br />
1 444 1 434<br />
1 444 1 421<br />
1 464 1 44<br />
S u n d a y<br />
1 431 1 434<br />
1 44 1 44<br />
1 46# 1 444<br />
1 471 1 47<br />
1 49 1 471<br />
H o lid a y<br />
S unday<br />
1 514 1 50<br />
1 514<br />
1 524<br />
1 531<br />
1 53#<br />
1 53<br />
1 501<br />
1 511<br />
1 53<br />
1 53<br />
1 521<br />
S u n d a y<br />
1 531 1 52<br />
1 511 1 501<br />
1 494 1 494<br />
1 481 1 481<br />
1 48 1 48<br />
S u n d a y<br />
1 481 1 471<br />
1 501 1 501<br />
1 514 1 514<br />
1 501 1 501<br />
F o r M onth<br />
1 531 1 421<br />
C losed<br />
S u n d ay<br />
1 48# 1 474<br />
H o lid a y<br />
1 47 1 46<br />
1 474 1 474<br />
1 461 1 461<br />
Sund ay<br />
1 49 1 47<br />
1 47} 1 474<br />
1 461 1 461<br />
1 46 1 46<br />
1 47 1 47<br />
S u n d a y<br />
1 48 1 464<br />
1 46 1 454<br />
1 45} 1 45}<br />
1 46 1 46<br />
1 43 1 424<br />
1 41} 1 39}<br />
Sund ay<br />
1 42 1 411<br />
1 45 1 434<br />
1 43} 1 43}<br />
H o lid a y<br />
1 42 1 39<br />
1 401 1 39}<br />
F o r M onth<br />
1 49 1 39<br />
Sunday<br />
1 40 1 40<br />
1 404 1 391<br />
1 40 1 394<br />
1 391 1 39<br />
1 351 1 35<br />
1 364 1 351<br />
S u n d a y<br />
1<br />
1 36<br />
1 35<br />
1 321<br />
1 321<br />
1 30#<br />
S unday<br />
1<br />
1 284<br />
1 31<br />
1 34<br />
1 37<br />
1 311<br />
1 35<br />
1 354<br />
1 32<br />
1 301<br />
1 301<br />
1 30<br />
1 281<br />
1 284<br />
1 31<br />
1 32<br />
1 33<br />
1 31<br />
S unday<br />
1 304 1 304<br />
1 294 1 281<br />
H o lid a y<br />
1 30f 1 301<br />
1 314 1 301<br />
S unday<br />
1 32 1 311<br />
1 311 1 311<br />
1 32 1 311<br />
F o r M o n th<br />
1 404 1 284<br />
HIGHEST AND LOWEST PRICES NO. 1 FEED BARLEY.<br />
SELLER DECEMBER 1912.<br />
Jan uary<br />
H igh . L o w .<br />
F eb ru a ry<br />
H igh . L ow .<br />
M arch<br />
H ig h . L ow .<br />
A p ril<br />
H igh . L ow .<br />
M ay<br />
H igh . L ow .<br />
June<br />
H igh . L ow .<br />
H o lid a y<br />
Sun day<br />
'l 45..... 1 45<br />
Sunday<br />
1 421<br />
1 401<br />
S unday<br />
1 421<br />
1 40<br />
1 40 1 40<br />
1 471 1 471<br />
Sun day<br />
F or M on th<br />
1 471 1 40<br />
1 44 1 44<br />
1 45 1 45<br />
1 44J 1 441<br />
Su n d ay<br />
1 484 1 474<br />
1 47 1 461<br />
1 47 1 461<br />
1 454 1 454<br />
1 47 1 47<br />
Su n d ay<br />
H o lid a y<br />
1 464 1 45<br />
1 47 1 47<br />
1 46 1 46<br />
1 46| 1 46<br />
S u n d ay<br />
1 50$ 1 494<br />
1 501 1 50<br />
1 524 1 52<br />
H o lid a y<br />
1 57 1 55<br />
1 571 1 561<br />
S u n d a y<br />
1 591 1 57<br />
1 584 1 561<br />
1 57f 1 55<br />
1 521 1 501<br />
F o r M on th<br />
1 591 1 44<br />
1 50 1 484<br />
1 531 1 53<br />
S u n d ay<br />
511 1 50<br />
481 1 471<br />
51<br />
1 461<br />
1 504<br />
1 521<br />
521<br />
524 1 521<br />
S u n d a y<br />
1 511 1 50<br />
1<br />
1 484<br />
1 494<br />
1 461<br />
1 46<br />
1 471<br />
1 484<br />
1 48<br />
1 45<br />
1 451<br />
S u n d a y<br />
1 481 1 47<br />
1 481 1 471<br />
1 481 1 474<br />
1 50 1 481<br />
1 481 1 48<br />
S u n d a y<br />
1 491 1 481<br />
1 504 1 501<br />
1 514 1 504<br />
1 524 1 511<br />
1 53 1 521<br />
1 54 1 531<br />
Sunday<br />
F o r M onth<br />
1 54 1 45<br />
39<br />
1 551<br />
1 52#<br />
1 o i l<br />
1 544<br />
1 551<br />
1 551<br />
1 541<br />
1 501<br />
1 511<br />
1 54<br />
1 54<br />
1 55<br />
Sund ay<br />
1 561 1 551<br />
1 541 1 53<br />
1 52 1 51<br />
1 534 1 501<br />
1 55 1 54|<br />
1 53 1 53<br />
Su n d ay<br />
1 56 1 55<br />
1 57 1 55<br />
1 574 1 561<br />
1 59 1 581<br />
1 591 1 581<br />
1 59 1 584<br />
Su n d ay<br />
1 581<br />
1 561<br />
1 561<br />
1 571<br />
1 581<br />
1 58<br />
1 56<br />
1 56<br />
1 571<br />
1 57<br />
S u n d ay<br />
1 574 1 57<br />
1 561 1 561<br />
F o r M on th<br />
1 591 1 501<br />
1 571 1 561<br />
1 584 1 58<br />
1 594 1 594<br />
1 60 1 591<br />
S u n d ay<br />
1 611 1 61<br />
1 611 1 60<br />
1 604 1 60<br />
1 60f 1 604<br />
1 614 1 61<br />
S u n d ay<br />
1 654 1 62}<br />
H o lid a y<br />
1 67 1 66<br />
1 674 1 66#<br />
1 65 1 641<br />
1 631 1 63<br />
S unday<br />
1 60 1 571<br />
1 581<br />
1 59#<br />
1 594<br />
1 591<br />
1 574<br />
1 57<br />
1 58<br />
1 59<br />
1 584<br />
1 f 61<br />
S unday<br />
1 581 1 57<br />
1 59# 1 58f<br />
1 594 1 594<br />
H o lid a y<br />
1 594 1 58<br />
F or M on th<br />
1 674 1 561<br />
S u n d a y<br />
1 56f<br />
1 554<br />
1 504<br />
1 501<br />
1 504<br />
1 49<br />
1<br />
1 521<br />
1 49<br />
1 50<br />
1 494<br />
1 47#<br />
S u n d a y<br />
47} 1 47<br />
1 1 48<br />
1 48 1 48<br />
1 474 1 47<br />
1 45# 1 444<br />
1 441 1 44<br />
S u n d ay<br />
1<br />
1 45<br />
1 47<br />
1 47}<br />
1 491<br />
1 49<br />
Sund ay<br />
1 47<br />
1 474<br />
1 461<br />
I 464<br />
1 46<br />
1 45<br />
S u n d ay<br />
1 43}<br />
1 44}<br />
1 45<br />
1 47<br />
1 48<br />
1 47}<br />
1<br />
1 45<br />
1 454<br />
1 454<br />
1 434<br />
F o r M on th<br />
1 564 1 43}
Digitized for FRASER<br />
http://fraser.stlouisfed.org/<br />
<strong>Federal</strong> <strong>Reserve</strong> <strong>Bank</strong> <strong>of</strong> <strong>St</strong>. <strong>Louis</strong><br />
HIGHEST AND LOWEST PRICES NO. 1 FEED BARLEY<br />
SELLER DECEMBER 1912<br />
II<br />
July<br />
H ig h . L o w .<br />
A u gust<br />
H ig h . L o w .<br />
Septem ber<br />
H ig h . L ow .<br />
O ctober<br />
H ig h . L o w .<br />
N o v e m b e r<br />
H ig h . L ow .<br />
D ecem b er<br />
H ig h . L o w .<br />
i 1 43 1 41} 1 19i 1 171 S u n d ay 1 40i 1 39 S unday<br />
2 1 40i 1 38| 1 16i 1 14i H o lid a y 1 40| 1 38 C losed<br />
3 1 38f 1 38 1 19 1 13i H o lid a y 1 43i 1 411 S u n d a y 1 44 1 44<br />
4 H oliday- S u n d a y 1 46i 1 42i 1 41i 1 41i 1 48i 1 471<br />
5 Closed 1 171 1 161 1 47 1 45f 1 42 1 41 H o lid a y 1 441 1 431<br />
6 Closed 1 151 1 141 1 471 1 461 S u n d ay 1 461 1 45 1 40 1 40<br />
7 S u n d ay 1 18 1 171 1 46 1 431 1 42 1 41i 1 46 1 45 1 371 1 361<br />
8 1 36 1 35 1 214 1 19i S u n d a y 1 42f 1 42f 1 451 1 441 Sund ay<br />
9 1 37i 1 35} 1 21 1 20i H o lid a y 1 44£ 1 42f 1 37-J 1 35<br />
10 1 38i 1 37i 1 251 1 23 1 48 1 46 1 46 1 441 S u n d ay 1 36 1 35<br />
11 1 40 1 39i S u n d a y 1 451 1 431 1 461 1 451 1 481 1 451 1 35 1 35<br />
12 1 39 1 361 1 23| 1 23 1 46 1 45 H o lid a y 1 481 1 481<br />
13 1 37 1 36} 1 23 1 191 1 45i 1 441 Sund ay 1 47i 1 47|<br />
14 Su n d ay 1 191 1 18 1 44i 1 44i 1 47 1 46 1 39f 1 39<br />
15 1 35} 1 34i 1 20f 1 201 S u n d ay 1 471 1 461 1 46£ 1 461 S unday<br />
16 1 36i 1 35* 1 24i 1 231 1 43i 1 41 1 481 1 48 1 48 1 48 1 421 1 391<br />
17 1 35 1 34i 1 26i 1 25 1 41 1 391 1 491 1 49 S u n d a y 1 421 1 421<br />
18 1 34} 1 33} S u n d ay 1 39 1 381 1 50 1 49t 1 48 1 47 1 45 1 45<br />
19 1 34 1 33} 1 281 1 26 1 371 1 37 1 50i 1 50 1 47 1 47 1 50 1 50<br />
20 1 33} 1 321 1 291 1 26 S u n d ay 1 46f 1 46 1 45 1 45<br />
21 Sunday 1 31 1 264 Sund ay 1 50f 1 491 1 44 1 44 S u n d ay<br />
22 1 31| 1 30f 1 30i 1 29 1 391 1 38 1 491 1 49 1 451 1 45i<br />
23 1 32 1 31i 1 321 1 30 1 44 1 401 1 50 1 491 1 47} 1 47 1 42 1 41|<br />
24 1 31 1 29i 1 331 1 32 1 41 1 40l 1 491 1 481 S u n d ay 1 39t 1 351-<br />
25 1 28} 1 27f S u n d ay 1 39} 1 38i 1 49 1 49 1 48 1 48 H o lid a y<br />
26 1 28 1 27 1 35 1 33£ 1 371 1 361 1 471 1 471 1 481 1 47|<br />
27 1 28 1 28 1 371 1 S6| 1 371 1 361 Sund ay 1 38 1 361<br />
28 S unday 1 381 1 371 Sund ay 1 481 1 471 H o lid a y S u n day<br />
29 1 25| 1 25 1 411 1 40 1 361 1 361 1 50S 1 49 1 47 1 46i 1 38 1 38<br />
30 1 25i 1 25 1 44i 1 43 1 391 1 37 1 51| 1 50 1 44 1 44<br />
31 1 24} 1 201 1 45 1 43<br />
Fo r M on th F o r M on th F o r M on th F o r M on th F o r M on th F o r M on th<br />
1 43 1 201 1 45 1 13i 1 48' 1 361 1 51f 1 38 1 481 1 44 1 50 1 35<br />
PRICES CASH GRAIN IN SAN FRANCISCO<br />
W H E A T<br />
B A R L E Y<br />
M on th A v e ra g e H igh . L o w . M o n th A v e ra g e H ig h . L o w .<br />
J a n u a ry ............. 1 51i 1 521 1 50 J a n u a r y ............. 1 91 i 1 95 1 871<br />
F e b r u a r y ........... 1 54S 1 571 1 51i F e b ru a r y ........... 1 881 1 921 1 85<br />
1 58| 1 621<br />
1 83t 1 871 1 80<br />
1 76f 1 90 1 63i 1 91 i 1 95 1 871<br />
1 821 1 90 1 851 1 92} 1 781<br />
1 671 1 75 1 60 1 621 1 711 1 521<br />
1 61} 1 65 1 571<br />
1 36} 1 471 1 25<br />
A u g u s t ............ 1 521 1 571 1 471 A u g u s t ............... 1 30 1 45 1 15<br />
S ep tem ber......... 1 471 1 521 1 421 S e p te m b e r........ 1 45 1 50 1 40<br />
1 46} 1 50 1 421 1 46i 1 521 1 40<br />
N o v e m b e r ......... 1 46} 1 50 1 421 N o v e m b e r......... 1 471 1 52 1 42<br />
D e c e m b e r ......... 1 421 1 45 1 40 D e c e m b e r ......... 1 41i 1 471 1 351<br />
F o r Y e a r ....... 1 57i 1 90 1 40 F o r Y e a r ....... 1 62t 1 95 1 15<br />
40
Digitized for FRASER<br />
http://fraser.stlouisfed.org/<br />
<strong>Federal</strong> <strong>Reserve</strong> <strong>Bank</strong> <strong>of</strong> <strong>St</strong>. <strong>Louis</strong><br />
IMPORTS INTO SAN FRANCISCO BY SEA, 1912<br />
From Oregon and Washington<br />
Date<br />
F lo u r<br />
Qrs.<br />
W h eat<br />
Ctls.<br />
B a rley<br />
Ctls.<br />
Oats<br />
Ctls.<br />
Beans<br />
Sx.<br />
C6rn<br />
Ctls.<br />
R y e<br />
Ctls.<br />
B ran<br />
Sx.<br />
M id d <br />
lin g s<br />
Sx<br />
P o <br />
tatoes<br />
Sx.<br />
O n ion s<br />
Sx.<br />
H op s<br />
B ales<br />
F la x <br />
seed<br />
Sx,<br />
W o o l<br />
Sx,<br />
242,529<br />
311,115<br />
385,211<br />
356,193<br />
337,684<br />
309,280<br />
219,765<br />
143,760<br />
184,969<br />
277,270<br />
451,60f<br />
234,800<br />
2,185<br />
61,720<br />
10,950<br />
16,650<br />
11,730<br />
7,945<br />
500<br />
2,420<br />
1,080<br />
1,070<br />
60,802<br />
43,370<br />
49,968<br />
71,647<br />
32,915<br />
13,265<br />
2.739<br />
1,895<br />
2,725<br />
1,891<br />
4,889<br />
2,127<br />
5,370<br />
9,331<br />
25,566<br />
8,591<br />
5,478<br />
12,346<br />
300<br />
300<br />
362<br />
110<br />
5<br />
56<br />
T o ta l fo r 6 m o n t h s ...<br />
1,912,012 1,512,169 2,185 108,995 500 4,570 271,967 16,266 66,682 1,072 61<br />
July<br />
390,580<br />
312,372<br />
264,189<br />
323,461<br />
354,692<br />
357,442<br />
T o ta l fo r 6 m o n th s... 2,002,736<br />
3,944,748<br />
236,035<br />
113,845<br />
320,198<br />
588,376<br />
434,579<br />
444,320<br />
2.137.353<br />
3,649,522<br />
48,680<br />
66,824<br />
287,326<br />
402,830<br />
405,015<br />
5,095<br />
2,910<br />
13,541<br />
59,730<br />
39,852<br />
30,088<br />
520<br />
640<br />
130<br />
59,423<br />
14,370<br />
35,305<br />
5,635<br />
2.085<br />
5,312<br />
1,140<br />
540<br />
3,950<br />
56,338<br />
47,295<br />
4,262<br />
5,542<br />
50<br />
1,418<br />
200 ...............<br />
4,117 2,175 21,731 5,368 1,254<br />
427<br />
T ota ls 1911-12......................<br />
T otals 1910-11.....................<br />
T otals 1909-10......................<br />
T ota ls 1908-09<br />
T otals 1907-08<br />
3,546,758<br />
2,577,560<br />
2,052,780<br />
2,170,936<br />
1,678(511<br />
2,634,807<br />
2,423,455<br />
2,865,080<br />
2,482,0)4<br />
1,513,260<br />
2,780<br />
660<br />
855<br />
116,361<br />
286,909<br />
230,670<br />
38,654<br />
179,264<br />
99,317<br />
318,571<br />
4,112<br />
4,856<br />
6,065<br />
965<br />
545<br />
534,018<br />
370,839<br />
266,748<br />
39,016<br />
34,464<br />
29,381<br />
69,979<br />
39,006<br />
1.072<br />
45<br />
1,018<br />
487<br />
327<br />
T ota ls 1906-07<br />
T ota ls 1904-05<br />
................<br />
.................<br />
1,619,596<br />
1,417,713<br />
1,645,196<br />
385,272<br />
3,143,941<br />
1.287.353<br />
20,532<br />
13,477<br />
38,717<br />
208,236<br />
165,785<br />
289,848<br />
T ota ls 1903-04 . ....... 1,527,800 834,213 97,818 233,526<br />
T ota ls 1902-03 ............... 1,273,524 584,356 41,650 229,746<br />
T ota ls 1901-02 ....... 1,305,533 4,525 789 169,735<br />
1,605,097 32,935<br />
...............<br />
T ota ls 1899-00<br />
T ota ls 1898-99<br />
T ota ls 1897-98<br />
T ota ls 1896-97<br />
1,643,868<br />
1,453,240<br />
1,261,117<br />
1,572,890<br />
1,209,382<br />
575,282<br />
201,697<br />
964,858 548,380<br />
251,471<br />
80<br />
T ota ls 1895-96<br />
T ota ls 1894-95<br />
T ota ls 1893-94<br />
T ota ls 1892-93......................<br />
1,075,038<br />
1,282,101<br />
677,588<br />
494,703<br />
466,136<br />
1,542,748<br />
1,141,993<br />
1,225,844<br />
69,466<br />
416,515<br />
102,970<br />
1,828<br />
151.216<br />
260,211<br />
154,677<br />
233,635<br />
533,492<br />
519,491<br />
320,078<br />
509,944<br />
515,545<br />
388,598<br />
284,102<br />
500<br />
5.277<br />
5.277<br />
6,795<br />
11,365<br />
234,462<br />
506,429<br />
28,204<br />
44,470<br />
3,862<br />
70,544<br />
31,265<br />
18,142<br />
28,810<br />
74,218<br />
88,976<br />
100,200<br />
233,526<br />
175,440<br />
262,894<br />
174,279<br />
236,690<br />
205,100<br />
225,692<br />
139,818<br />
266,149<br />
212,540<br />
106,053<br />
231,164<br />
1.072<br />
200<br />
200<br />
427<br />
427<br />
928<br />
768<br />
1,134<br />
1,870<br />
3,473<br />
2,746<br />
12,769<br />
44,522<br />
13,919<br />
122,997<br />
94,656<br />
58,820<br />
29,751<br />
12,086<br />
20,434<br />
11,423<br />
93,188<br />
44,145<br />
8,516<br />
18,060<br />
41<br />
11<br />
2<br />
46<br />
100<br />
161<br />
261<br />
2,376<br />
570<br />
604<br />
1,422<br />
827<br />
977<br />
1,187<br />
1,302<br />
1,894<br />
2,581<br />
2,201<br />
6,917<br />
6,224<br />
9,100<br />
11,993<br />
4,902<br />
8,588<br />
12,250<br />
10,073
Digitized for FRASER<br />
http://fraser.stlouisfed.org/<br />
<strong>Federal</strong> <strong>Reserve</strong> <strong>Bank</strong> <strong>of</strong> <strong>St</strong>. <strong>Louis</strong><br />
EXPOETS FROM SAN FRANCISCO W ITH DESTINATION.<br />
WHEAT.<br />
Y E A R<br />
Ports o f<br />
Call<br />
U. K .<br />
D irect<br />
C o n tin ’nt<br />
o f E u rop e<br />
South<br />
A m erica<br />
A u stra lia<br />
South<br />
A frica<br />
In d ia<br />
M iscella<br />
n eou s<br />
Jap an<br />
1911-12 _<br />
1010-11 _<br />
1909-10 .<br />
1908-09 .<br />
1907-08 .<br />
1906-07 -<br />
1905-06 .<br />
1904-05 .<br />
1903-04 .<br />
1902-03 .<br />
1901-02 .<br />
1900-01 .<br />
1899-1900<br />
1898-99 .<br />
1897-98 .<br />
1896-97 .<br />
1895-96 .<br />
1894-95 .<br />
1893-94 .<br />
276,377<br />
191,412<br />
361,026<br />
82.036<br />
204.879<br />
. 746.442<br />
850,806<br />
2,352,438<br />
8,447,826<br />
6,858.148<br />
5,750,295<br />
1,619,756<br />
7,350,098<br />
6,292,496<br />
6,027,736<br />
7,775,806<br />
6,243,545<br />
15<br />
13.<br />
9, i<br />
13,<br />
151,<br />
138.<br />
35.<br />
41,<br />
166.<br />
349,<br />
630,<br />
458,<br />
303.<br />
408,<br />
1,183,<br />
1,372.<br />
2,872,<br />
1,764.<br />
2,739,<br />
24,823<br />
25 ,760<br />
23 ,610<br />
227 ,426 182<br />
113 547<br />
244<br />
172,532<br />
179,073<br />
5,601<br />
374,890<br />
1,726,315<br />
18,257<br />
102,252<br />
892,151<br />
1,071,940<br />
740.489<br />
144,443<br />
189,935<br />
240,223<br />
1,011,265<br />
453,726<br />
480,947<br />
17,872<br />
4,232<br />
4.738<br />
3,033<br />
5,964<br />
8.874<br />
21.558<br />
20,973<br />
17.728<br />
41,172<br />
20,433<br />
12,978<br />
31,741<br />
17,792<br />
21.637<br />
42,778<br />
31,594<br />
58,285<br />
21,711<br />
9,210<br />
BARLEY.<br />
Y E A R I T . K .<br />
C on tin<br />
en t<br />
A u stra lia<br />
D o m e stic<br />
B y R a il<br />
O v erla n d R u ssia A tla n tic<br />
H a w a iia n<br />
Isla n d s<br />
M iscella<br />
n eou s<br />
Jap an<br />
1911-12 ______________<br />
1910-11 ___________<br />
1909-10 ______________<br />
1908-09 _______________<br />
1907-08 _______________<br />
1906-07 _______________<br />
1905-06 _______________<br />
1904-05 _______________<br />
1903-04 _______________<br />
1902-03 _______________<br />
1901-02 _______________<br />
1900-01 _______________<br />
1899-1900 _____________<br />
•China. fNew<br />
615,813<br />
4,089,830<br />
1,485,003<br />
2,443,463<br />
1,194,373<br />
2,545,579<br />
702,499<br />
1,221,795<br />
3,182,503<br />
2,359,403<br />
3,286,844<br />
1,880,303<br />
3,549,538<br />
254,644<br />
89,524<br />
22,400<br />
24,640<br />
188,124<br />
222,023<br />
ll5 ~ 9 7 2<br />
280,792<br />
’ *68~935<br />
68,768<br />
39,331<br />
36,182<br />
134,986<br />
~"23~046<br />
13,440<br />
115,975<br />
348,681<br />
231,107<br />
9,195<br />
40,102<br />
514,414<br />
552,334<br />
tl54,693<br />
1,891,849<br />
827,660<br />
153,900<br />
199,500<br />
582,980<br />
270,080<br />
192,400<br />
227,840<br />
248,100<br />
JTorfc. **Soutb A m e ric a . JPaclflc Isla n d s.<br />
40,000<br />
1,062,357<br />
31,782<br />
194,908<br />
344,975<br />
50,233<br />
4,865<br />
377,301<br />
274,926<br />
233,197<br />
503,694<br />
407,617<br />
481,723<br />
406,881<br />
501,922<br />
9,020<br />
6,166<br />
384,830<br />
63,605<br />
270,058<br />
139,220
Digitized for FRASER<br />
http://fraser.stlouisfed.org/<br />
<strong>Federal</strong> <strong>Reserve</strong> <strong>Bank</strong> <strong>of</strong> <strong>St</strong>. <strong>Louis</strong><br />
EXPORTS FROM SAN FRANCISCO W ITH DESTINATION.<br />
Y E A R<br />
C hina<br />
Japan<br />
H a w a ii<br />
an d<br />
P a cific<br />
Isla n d s<br />
FLOUR.<br />
East<br />
In d ies Siberia M e x ico<br />
C entral<br />
A m er ’a<br />
a n d<br />
P ’n ’m a<br />
South<br />
A m er'a<br />
U. K .<br />
A u stra <br />
lia<br />
A frica<br />
M iscella<br />
n eou s<br />
T ota l<br />
1911-12 .<br />
1910-11<br />
1909-10 .<br />
1908-09 .<br />
1907-08 .<br />
1906-07 .<br />
1905-06 .<br />
1904-05 .<br />
l!»UiHI4 .<br />
1902-03 .<br />
1901-02 .<br />
1900-01 .<br />
3899-1900<br />
1898-99 .<br />
1897-98 .<br />
1896-97 .<br />
1895-96 .<br />
1894-95 .<br />
1893-94 .<br />
1892-93 .<br />
1891-92 .<br />
54,494 17 74,149 122 8,920 214,236 39,185<br />
17,200 156 57,786 12.257 1-58 086<br />
3.590 572 63.979 3,928 12,217 111,619 24.850<br />
35.129 287 62,448 10,175<br />
60,145 8,749 78,103 4,119 13,143 123,093 17,844<br />
136.168 25,252 102,996 2.673 10.300 147.375 31.183<br />
153,234 10,117 91,271 _ ___ 12,600 15,126 164,580 22,384<br />
354,100 34,900 108,627 _ 17,176 8,369 201,356 33,218<br />
465,498 45,084 121,121 5,305 8,635 169,143 21,802<br />
547,811 31.581 128,822 4,628 8,934 129,624 48,929<br />
590,044 34,544 28,244 85,665 2,617 5,867 211,943 101,833<br />
451,907 61,878 11,690 129,082 3,611 6,885 189,947 181,520<br />
598,225 79,720 131,406 116,779 6,656 7,421 161,721 39.406<br />
481,178 15,465 79,251 72,056 56,637 5,204 182,706 13,036<br />
399,815 23,371 86,494 11,623 22,890 12,555 169,554 19,048<br />
412,046 49,034 57,855 9,807 53,417 9,922 202,379 3,619<br />
378,678 25,351 55,232 16,565 56,901 11,261 197,599 16,577<br />
521,801 30,980 61,575 8,520 38,344 9,741 231,467 16,110<br />
400,693 33,617 66,909 8,500 19,988 6,911 199,615 19,833<br />
376,613 30,461 60,565 4,100 12,231 9,753 176,640 40,211<br />
389,823 22,885 72,104 1,667 11,587 12,135 196,598 89,355<br />
630<br />
5,008<br />
36,051<br />
24,325<br />
76,789<br />
51,010<br />
50,638<br />
74,720<br />
64,287<br />
103,250<br />
92,098<br />
38,294<br />
371,940<br />
255,822<br />
11<br />
60,800<br />
39,644<br />
1,420<br />
2,551<br />
28,570<br />
13,298<br />
214,460<br />
106,002<br />
358<br />
784<br />
260<br />
1,342<br />
1,500<br />
70,357<br />
314<br />
3.716<br />
3,410<br />
1,025<br />
2,634<br />
990<br />
593<br />
1,328<br />
1,972<br />
6,368<br />
3,846<br />
2,514<br />
1,<br />
2,997<br />
391,243<br />
287.557<br />
220.735<br />
234.529<br />
305.826<br />
455.967<br />
540,669<br />
763,068<br />
879.366<br />
98S.864<br />
.,178,215<br />
091,684<br />
,195,783<br />
,009,416<br />
824,266<br />
,119,103<br />
964,032<br />
922,384<br />
796,874<br />
,084,561<br />
,055,757<br />
N o t e .— S h ip m e n t s o f flo u r t o H a w a ii a n d P a c ific I s la n d s in c lu d e U . S . G o v e r n m e n t s h ip m e n t s .
Digitized for FRASER<br />
http://fraser.stlouisfed.org/<br />
<strong>Federal</strong> <strong>Reserve</strong> <strong>Bank</strong> <strong>of</strong> <strong>St</strong>. <strong>Louis</strong><br />
EEPOET OF FLOUR AND GRAIN REMAINING IN THE STATE<br />
OF CALIFORNIA ON DATES MENTIONED<br />
COMPARATIVE STATEMENT.<br />
F lou r<br />
B bls.<br />
W h eat<br />
Ctls.<br />
B a rley<br />
Ctls.<br />
Oats<br />
Ctls.<br />
Beans<br />
Sacks<br />
R y e<br />
Ctls.<br />
1912, D e c . 1---------------------- 170,387 1,876,620 5,497,520 386,460 1,351,782 34,560<br />
J u n e 1 _____________ 197,964 1,062,260 716,840 61,380 583,756 6,360<br />
1911, D e c . 1_______________ 178,118 2,734,480 3,750,780 552,660 1,196,126 13,020<br />
J u n e 1__________ ___ 141,934 1,669,460 896,560 315,400 409,070 6,700<br />
1910, D e c . 1________________ 145,741 3,483,260 608,280 827,920 1,002,698 25,960<br />
J u n e 1________________ 211,381 853,940 982,120 124,340 367,823 6,800<br />
1909, D e c . 1________________ 84,189 1,945,580 5,207,960 395,940 1,196,170 11,200<br />
J u n e 1____ _________ 120,661 707,820 272,220 21,420 348,556 860<br />
1908, D e c . 1_______________ 107,137 1,528,300 3,829,000 274,940! 1,001,650 11,540<br />
J u n e 1________________ 105,388 606,360 609,000 84,620 237,999 8,780<br />
1907, D e c . 1 ______________ 92,008 2,460,440 3,370,080 234,780 815,251 16,640<br />
J u n e l ______________ 73,945 1,525,896 1,344,889 48,324 408,144 7,733<br />
1906, D e c . 1________________ 83,541 3,975,966 4,377,947 236,498 846,520 19,283<br />
J u n e 1 ___________ 70,610 1,501,231 465,275 __ __ 303,463 _____<br />
1905, D e c . 1________________ 142,373 3,579,580 3,445,500 292,100 596,455 34,420<br />
J u n e 1_______ ______ 120,533 780,100 220,960 25,620 201,835 5,980<br />
1904, D e c . l ________________ 128,146 3,930,860 3,361,720 221,600 557,589 26,040<br />
J u n e l ------------------------ 165,004 2,190,920 1,191,300 57,560 326,313 14,120<br />
1903, D e c . 1 _____________ 147,718 5,436,920 4,471,300 327,800 659,908 39,880<br />
J u n e 1________________ 145,004 1,010,400 601,820 100,200 333,073 17,960<br />
1902, D e c . 1 _____________ 106,413 6,154,060 2,947,040 343,460 752,874 53,740<br />
J u n e 1________________ 177,173 2,505,780 567,080 112,320 312,746 53,800<br />
1901, D e c . 1 --------------------- 140,747 12,023,680 4,467,300 304,520 476,874 168,480<br />
J u n e 1 — -------------- 174,777 3,746,820 746,220 43,580 118,000 80,060<br />
1900, D e c . 1- — _______ 144,108 12,401,980 3,893,840 200,280 243,034 151,040<br />
J u n e 1------------------------ 95,099 8,367,840 2,108,520 147,980 114,088 54,240<br />
1899, D e c . 1- ---------------- 112,136 15,998,280 4,778,880 235,700 268.117 54,140<br />
J u n e 1 --------------------- 70,906 3,394,160 232,420 23,460 308,973 10,560<br />
1898, D e c . 1 . ----------------- 122,833 6,494,800 1,264,200 186,000 513,459 38,440<br />
J u n e 1 ---------------------- 87,380 3,152,680 943,060 109,380 561,263 54,300<br />
1897, D e c . 1 ______________ 115,992 9,132,640 3,136,020 106,160 713,749 35,240<br />
J u n e 1 ----------------- 94,960 1,733,880 758,600 81,980 505,730 21,360<br />
1896, D e c . 1______ _______ 111,078 7,495,380 3,008,980 189,360 700,963 81,340<br />
J u n e 1 ______________ 101,991 2,655,340 1,043,540 78,500 369,396 17,100<br />
1895, D e c . 1________________ 82,107 10,941,760 4,072,560 193,220 557,948 125,500<br />
J u n e 1------------------------ 51,607 6,306,340 714,440 108,960 65,819 4,480^<br />
1894, D e c . 1______________ 73,950 13,040,330 1,965,230 213,590 198,180 63,985<br />
J u n e 1 ____— — 80,310 7,646,090 1,370,305 106,915 124,300 6,585<br />
1893, D e c . 1 _ ___ 99,031 14,234,419 3,907,011 253,508 22,967<br />
83,327 4,485,923 1,309,102 57,240 9,725<br />
1892, 92,024 12,153,772 3,797,654 263,243 57,988<br />
J u n e 1 ------ --------- 120,517 2,100,149 913,049 48,786 128,182 5,831<br />
1891, D e c . 1 . ----------------- 140,043 9,964,575 2,883,602 168,404 275,126 39,545<br />
J u n e 1 ______________ 121,166 1,626,562 352,882 45,074 46,682 14,136<br />
1890, D e c . 1 . — . 118,123 12,168,993 1,615,655 61,085 174,291 37,150<br />
44
Digitized for FRASER<br />
http://fraser.stlouisfed.org/<br />
<strong>Federal</strong> <strong>Reserve</strong> <strong>Bank</strong> <strong>of</strong> <strong>St</strong>. <strong>Louis</strong><br />
ACREAGE AND PRODUCTION OF BARLEY IN CALIFORNIA<br />
C om p iled b y the U. S. D ep a rtm en t o f A g ricu ltu re.<br />
Y ea r A cre a g e A v e r<br />
. Y ie ld p er A cre<br />
B ushels<br />
P ro d u ctio n<br />
Centals<br />
1912......... ...................................... 1,253,000 30. 18,043,200<br />
1911............................................... 1,260,000 29.5 17,841,600<br />
1910.......... .................................... 1,306,387 31.0 19,438,040<br />
1909.......... ..................................... 1 180,800 26.5 15,009,600<br />
1908.......... .................................... 1,082,000 23.5 12,204,960<br />
1907.......... .................................... 1,040,000 28.9 15,028,000<br />
1906.......... ..................................... 1,425,000 27.2 18,760,000<br />
1905.......... .................................... 1,237,533 21.5 12,771,340<br />
1904.......... .................................... 1,237,533 22.7 13,484,160<br />
1903.......... .................................... 1,201,488 25.7 14,821,556<br />
1902.......... .................................... 1,144,274 26.0 14,280,539<br />
1901.......... ..................................... 1,089,785 26.0 13,600,526<br />
1900.......... .................................... 889,591 16.7 7,130,961<br />
1899.......... .................................... 855,376 26.0 10,675,092<br />
1898.......... ..................................... 872,833 10.5 4,399,078<br />
1897.......... ..................................... 881,649 23.0 9,733,404<br />
1896.......... .................................... 918,384 21.6 9,521,805<br />
1895.......... .................................... 937,127 20.3 9,131,365<br />
1894.......... .................................... 737,895 5,323,681<br />
1893.......... .................................... 760,716 8,215,732<br />
1892.......... .................................... 845,240 9,737,164<br />
SHIPMENT OF BEANS, FISCAL YEAR 1911-1912.<br />
By Sea—<br />
From San Francisco, Foreign......................................................... 23,975<br />
“ “ Atlantic ..................................................... 120,286<br />
“ “ Hawaiian Islands .................................. 16,701<br />
By Rail—<br />
From California .................................. ............................................. 1,198,440<br />
Total, 1911-12.............................................................................. 1,369,402<br />
“ 1910-11.............................................................................. 1,420,515<br />
“ 1909-10 ............................................................................. 1,744,328<br />
“ 1908-09 .................................. - ........................................ 1,479,771<br />
“ 1907-08 ................................... .......................................... 1,420,003<br />
“ 1906-07 ...... ....................................................................... 1,446,887<br />
“ 1905-06.................................................................... -........ 1,105,120<br />
“ 1904-05 .................................. - ......................................... 982,970<br />
“ 1903-04 ............................................................................. 1,097,576<br />
“ 1902-03 ............................................................................ 965,850<br />
“ 1901-02 .......... .................................................................. 851,872<br />
“ 1900-01 ............................................................................. 378,550<br />
1899-1900 ......................................................................... 441,526<br />
“ 1898-99 ............................................................................. 430,615<br />
“ 1897-98 ............................................................................. 578,174<br />
“ 1896-97 ................................................................. ............ 719,747<br />
“ 1895-96-.......................................................................... 556,077<br />
45
Digitized for FRASER<br />
http://fraser.stlouisfed.org/<br />
<strong>Federal</strong> <strong>Reserve</strong> <strong>Bank</strong> <strong>of</strong> <strong>St</strong>. <strong>Louis</strong><br />
EXPORTS OF LUMBER (IN M FEET) FROM SAN FRANCISCO— YEAR 1912<br />
M onth<br />
Central<br />
Ami rica &<br />
Panam a<br />
S outh<br />
A m e rica<br />
! M e x ico<br />
C hina<br />
1<br />
1 Jap an<br />
Australasia |<br />
1<br />
P h ilip p in e<br />
Isla n d s<br />
I<br />
E u rop e<br />
P a cific<br />
Islands<br />
South<br />
A frica<br />
H a w a iia n<br />
Isla n ds<br />
V a riou s<br />
A tla n tic<br />
T ota l<br />
January............................ 253 2(50 234 741 52 354 88 245 42 2,269<br />
February....... 283 324 144 3Q 1,701 111 38 333 288 3,2(54<br />
March . 1,(585 20 37 2 103 54 37 323 59 2.320<br />
April 2 SO 422 84 179 440 139 7 1,551<br />
May.......... 3,805 28 2,799 150 108 12 181 1,042 25 25 8,511<br />
June...... 163 103 5 103 10 51 139 206 2<br />
839<br />
Total for six months 2,894 4,994 630 3 46 5,626 377 513 754 837 1,979 34 67 18,754<br />
July......................................<br />
August................—..............<br />
September..........................<br />
October..............................<br />
November............ ..............<br />
December............................<br />
1,708 90 7 3,241 250 377 547 6,220<br />
2,380 18(5 130 1,953 10 381 1 20 5,070<br />
79 94 431 2,639<br />
200 20 614 8 4,085<br />
151 108 72 9 1,688 101 491 609 650<br />
3,879<br />
91 541 108 644 152 48 23 147 1,754<br />
100 189 47 76 4 103 290 719<br />
Total for six months 4,509 1,208 804 9 10,241 503 252 1,024 609 2,539 1 28 21,727<br />
Total for year....... ......... 7,403 6,202 1,470 3 55 15,867 880 765 1,788 1,446 4,468 35 95 40,481<br />
Year 1906..........................<br />
Year 1907..-........ ..............<br />
Year 1908..........................<br />
3,099<br />
2,6(52<br />
1,115<br />
1,477<br />
767<br />
1,056<br />
1,942<br />
5,388<br />
9,123<br />
35<br />
8<br />
3?<br />
188<br />
1(51<br />
7,623<br />
4,807<br />
12,608<br />
173<br />
2,082<br />
370<br />
714<br />
2,223<br />
405<br />
853<br />
909<br />
3,212<br />
1,643<br />
3,558<br />
Year 1909........................... 954 975 11,822 53 29 9,876 65 419 1,285 3,798<br />
.......................... 1,086 2,951 1,926; 36Year 11,988 1910 261 1,040 1,064 6,323<br />
Year 1911.......................... 4,965 2,685 1,258 57 8 17,821 2,284 3,176 2,782 333 4,037<br />
Year 1912........................... 7,403 6,202 1,470 55 15,867 .880 765 1,788 1,446 4,468<br />
1,384<br />
1,868<br />
429<br />
1,079<br />
36<br />
35<br />
19,577<br />
19,071<br />
33,264<br />
754 30,029<br />
27,754<br />
3,911 41,353<br />
95 40,481
Digitized for FRASER<br />
http://fraser.stlouisfed.org/<br />
<strong>Federal</strong> <strong>Reserve</strong> <strong>Bank</strong> <strong>of</strong> <strong>St</strong>. <strong>Louis</strong><br />
RECEIPTS LUMBER AT SAN FRANCISCO<br />
FROM<br />
Year<br />
California<br />
Oregon<br />
and<br />
Wash.<br />
Rail<br />
Total.<br />
1912<br />
January..........................<br />
February.........................<br />
March..............................<br />
April................................<br />
M ay......... .......................<br />
June................................<br />
Total for six months.<br />
July................................<br />
August........... .................<br />
September......................<br />
October............................<br />
November........... .........<br />
December....____ ______<br />
Total for six months..<br />
1912 Total ............<br />
Year 1911...<br />
Year 1910-<br />
Year 1909...<br />
Year 1908-<br />
Year 1907-<br />
Year 1906-<br />
26,739 38,374 1,450 66.563<br />
30,085 53,674 1,020 84,779<br />
31,419 54,410 1,670 87,499<br />
30,646 45,835 3,040 79,521<br />
30,427 63,106 3,430 96,963<br />
27,617 61,297 1,500 90,414<br />
176,933 316,696 12,110 505,739<br />
26,441 58,316 1,860 86,617<br />
27,797 66,546 1,020 95,363<br />
25,938 61,492 1,463 88,893<br />
27,054 52,143 2,080 81,277<br />
29,522 51,994 2,020 83,636<br />
26,472 45,120 1,590 73,182<br />
163,324 335,611 10,033 508,968<br />
340,257 652,307 22,143 1,014,707<br />
324,251 634,251 958,502<br />
332,499 675,145 ................ 1,007,594<br />
324,913 651,469 ............. 976,382<br />
298,780 582,524 .......... ...... 881,304<br />
429,934 749,277 ................ 1,179,277<br />
395,839 702.298 1,098,137<br />
RECEIPTS OF SALMON, CODFISH, W HALE BONE AND W HALE<br />
OIL AT SAN FRANCISCO<br />
Year<br />
1912......... ..............<br />
1911.......................<br />
1910............. ..........<br />
1909..... ..................<br />
1908........................<br />
1907......... .............<br />
1906.......................<br />
1905_____ _____ _<br />
1904............. .........<br />
1903.... ...................<br />
Salmon Codfish Whalebone Whale Oil<br />
Cases Bbls. Number Pounds Bbls.<br />
1,692,067<br />
1,229,420<br />
1,537,902<br />
1,517,506<br />
1,355,758<br />
1,255,836<br />
1,316,612<br />
1,417,433<br />
1,435,157<br />
22,525<br />
6,619<br />
11,190<br />
26,479<br />
28,358<br />
16,726<br />
15,579<br />
20,597<br />
14,820<br />
1.724.000<br />
1.778.000<br />
1.437.000<br />
1.080.000<br />
2,160,000<br />
1,862,000<br />
2.382.000<br />
2.897.000<br />
1.889.000<br />
75,844<br />
57,500<br />
55,115<br />
21,000<br />
45,700<br />
127,800<br />
34,170<br />
33,550<br />
75,688<br />
64,790<br />
1,276<br />
6,316<br />
2,748<br />
4,525<br />
2,200<br />
600<br />
1,935<br />
2,073<br />
3,180<br />
6,487<br />
47
Digitized for FRASER<br />
http://fraser.stlouisfed.org/<br />
<strong>Federal</strong> <strong>Reserve</strong> <strong>Bank</strong> <strong>of</strong> <strong>St</strong>. <strong>Louis</strong><br />
STATEMENT OF LUMBER CHARTERS FROM THE NORTH<br />
January 1, 1912 to January 31, 1913.<br />
From Shipping Points on Puget Sound, Columbia River and Grays<br />
Harbor. Dollars and Cents per M Feet Board Measure<br />
San Francisco San Pedro Guay mas<br />
Hawaiian<br />
Isles<br />
West Coast<br />
f. o.<br />
West Coast<br />
Direct<br />
1912<br />
January....<br />
February...<br />
March.......<br />
April.........<br />
May..........<br />
June..........<br />
July...........<br />
August.....<br />
September.<br />
October....<br />
November.<br />
December..<br />
1913<br />
January....<br />
$4.25 $4.50<br />
4.50 4.75<br />
4.75<br />
$4.75 $5.00<br />
5.25<br />
5.25 5.50<br />
$7.50<br />
$6.50<br />
6.75<br />
4.75 5.50<br />
7.25<br />
4.75 5.25 7.25<br />
4.75 5.00 5.50 5.75 7.25<br />
4.75 5.00 5.50 5.75 7.50<br />
4.75 5.00 5.50 7.50<br />
4.75 5.00 5.50 8.00<br />
4.75 5 50 7.50<br />
4.75 5.50 7.50<br />
4.75 5.50 7.50<br />
4.75 5.50<br />
52/6<br />
52/6<br />
55/<br />
55/<br />
60/<br />
57/6<br />
60/<br />
62/6<br />
65/<br />
63/9<br />
65/<br />
63/9<br />
65/<br />
53/9<br />
55/<br />
57/6<br />
62/6<br />
62/6<br />
65/<br />
65/<br />
65/<br />
65/<br />
50/<br />
52/6<br />
55/ 56/3<br />
70/ Lebu.<br />
60/ 62/6<br />
62/6<br />
61/3 62/6<br />
62/6 63/9<br />
61/3 62/6<br />
60/ 61/3
Digitized for FRASER<br />
http://fraser.stlouisfed.org/<br />
<strong>Federal</strong> <strong>Reserve</strong> <strong>Bank</strong> <strong>of</strong> <strong>St</strong>. <strong>Louis</strong><br />
STATUM MNT OP LUMBER CHARTERS FROM THE NORTH<br />
January 1, 1912 to January 31, 1913.<br />
From Shipping Points on Puget Sound, Columbia River and Grays<br />
Harbor. Shillings and Pence per M Feet Board Measure<br />
Sydney Newcastle Melbourne Adelaide Brisbane<br />
Zealand<br />
New<br />
South<br />
Africa<br />
United<br />
Kingdom<br />
1912<br />
January....<br />
February...<br />
March.......<br />
April.........<br />
May..........<br />
June..........<br />
July...........<br />
August..... .<br />
September.<br />
October.... .<br />
November.<br />
1913<br />
January....<br />
69/6 72/6<br />
42/6 47/6 46/3 71/3<br />
48/9 57/6 72/6 73/9 80/<br />
48/9<br />
47/6 51/3<br />
52/6<br />
53/ 57/6<br />
58/9<br />
61/3<br />
57/6 61/3<br />
52/6<br />
53/<br />
48/6 75/<br />
72/6 73/9 72/6 73/9<br />
62/6<br />
65/<br />
66/3 70/<br />
63/9 65/<br />
80/<br />
75/ 85/<br />
80/<br />
80/ 83/9<br />
*87/6<br />
*90/<br />
80/<br />
81/3<br />
80/<br />
80/<br />
83/9 85/<br />
57/6 61/3 70/ 70/ 63/9<br />
66/3 80/ 82/6 83/9<br />
*British Columbia Loading.
Digitized for FRASER<br />
http://fraser.stlouisfed.org/<br />
<strong>Federal</strong> <strong>Reserve</strong> <strong>Bank</strong> <strong>of</strong> <strong>St</strong>. <strong>Louis</strong><br />
RECEIPTS OF COAL (IN TONS) AT SAN FRANCISCO FOR YEAR 1912.<br />
£! s<br />
§1<br />
o 03<br />
Ph<br />
d<br />
g o<br />
January..........................<br />
February........................<br />
March.............................<br />
April...............................<br />
May.................................<br />
June................................<br />
Total for six months.<br />
July...........................<br />
August.........................<br />
September......................<br />
October.........................<br />
November......... ............<br />
December.......................<br />
Total for six months.<br />
Total Year .........<br />
14,693<br />
11,950<br />
30,372<br />
18,543<br />
4,850<br />
20,806<br />
101,214<br />
12,010<br />
26,449<br />
16,073<br />
4,490<br />
9,017<br />
4,500<br />
72,539<br />
173,753<br />
9,779<br />
1,617<br />
3,048<br />
4,971<br />
10,866<br />
9,258<br />
500<br />
4,704<br />
2,983<br />
5,847<br />
4,844<br />
6,633<br />
3,614<br />
650<br />
250<br />
39,539 500 28,625 900<br />
1,201<br />
16,175<br />
17,789<br />
7,479<br />
6,521<br />
5,735<br />
1,550<br />
60C<br />
1,632<br />
4,866<br />
2,959<br />
3,972<br />
4,341<br />
3,434<br />
100<br />
200<br />
54,900 2,150 21,204 300<br />
94,439 2,150 500 49,829 1,200<br />
11,171<br />
5,436<br />
22,378<br />
13,403<br />
52,<br />
22,623'<br />
11,549<br />
11,403<br />
12,225<br />
6,400<br />
5,502<br />
69,702<br />
122,090<br />
1,080<br />
1,320<br />
660<br />
1,510<br />
1,260<br />
1,260<br />
7,090<br />
1,470<br />
2,130<br />
2,370<br />
2,240<br />
2,670<br />
1,110<br />
11,990<br />
19,080<br />
42,077<br />
18,620<br />
45,363<br />
52,246<br />
37,012<br />
34.938<br />
230,256<br />
38.939<br />
61,169<br />
52,144<br />
31,106<br />
29,149<br />
20,281<br />
232,785<br />
463,041<br />
Year<br />
190 5<br />
190 6 ....................<br />
190 7 .............<br />
190 8 ...........<br />
190 9<br />
191 0<br />
191 1<br />
191 2<br />
324,873<br />
311,099<br />
205,956<br />
167,415<br />
179,187<br />
166,443<br />
200,646<br />
173,753<br />
77,998<br />
72,638<br />
387,740<br />
228,174<br />
97,281<br />
154,603<br />
160,626<br />
94,439<br />
67,542<br />
37,215<br />
18,582<br />
15,110<br />
2,564<br />
1,076<br />
23,725<br />
73,398<br />
5<br />
39,077<br />
2,100<br />
2,150<br />
6,170<br />
14<br />
500<br />
152,718<br />
110,670<br />
87,346<br />
29,426<br />
25,557<br />
65,085<br />
59,128<br />
49,829<br />
77,210<br />
42,975<br />
26,445<br />
24,885<br />
24,470<br />
13,572<br />
4,655<br />
1,200<br />
12,137<br />
11,455<br />
83,883<br />
171,875<br />
76,081<br />
86,744<br />
154,789<br />
122,090<br />
10,930<br />
19,080<br />
736,203<br />
586,052<br />
883,550<br />
655,801<br />
402,581<br />
534,258<br />
593,964<br />
463,041
Digitized for FRASER<br />
http://fraser.stlouisfed.org/<br />
<strong>Federal</strong> <strong>Reserve</strong> <strong>Bank</strong> <strong>of</strong> <strong>St</strong>. <strong>Louis</strong><br />
.RECEIPTS OF COKE AT SAN FRANCISCO YEAR 1912<br />
Great Britain Australia Total<br />
Tons<br />
Tons<br />
Tons<br />
January..................................... 1,247<br />
1,047<br />
2,294<br />
February...... 1........................... 1,272<br />
1,272<br />
March........................................ 1,772 1,772<br />
April.......................................... 1,305<br />
1 305<br />
May................................. ’ 484<br />
484<br />
June........................................... 2,050 1,100 3,150<br />
Total six months................. 8,130 2,147 10,277<br />
July.............................. 2,491 2,491<br />
August..... ................................<br />
September...... :................... .<br />
October....................................<br />
8,068<br />
3,652<br />
8,699<br />
1,4-51<br />
1,463<br />
9,519<br />
5,115<br />
8,699<br />
November........................ 991 30 1,021<br />
December.................................. 7,057 7,057<br />
Total six months................. 30,958 2,914 33,902<br />
Total year 1912................... 39,088 5,091 44,179<br />
RECEIPTS OF PIG IRON AT SAN FRANCISCO FROM FOREIGN<br />
PORTS<br />
Year 1912.................................... ..................... ............................. 8,044 Tons<br />
“ 1911....................................... ...... ......................................... 13,919 “<br />
“ 1910....................................................................................... 15,447 ‘ ‘<br />
“ 1909............................................. ...... 9,049 “<br />
“ 1908................................. ............ .......................................... 20,347 “<br />
“ 1907..... ....................................... ......................................... 19,275 “<br />
“ 1906............................................. .......................................... 14,289 “<br />
51
Digitized for FRASER<br />
http://fraser.stlouisfed.org/<br />
<strong>Federal</strong> <strong>Reserve</strong> <strong>Bank</strong> <strong>of</strong> <strong>St</strong>. <strong>Louis</strong><br />
TOXXAGE MOVEM ENT— PORT OF SAN FRANCISCO YEAR 1012.<br />
ARRIVALS<br />
From<br />
<strong>St</strong>eam<br />
Tons<br />
Xo. i Sail<br />
Vessels-<br />
Tons<br />
Xo.<br />
Vessels<br />
Total<br />
Australia....................... ...! 94,890 1 291 31,117 26: 126,007<br />
Alaska........................... -.1 26,201 i 26 55,00o I 3 j 81,266<br />
Atlantic P orts........... ...; 77,950 | 25 8,629 | 3 i 86,579<br />
Belgium........................ .. : 43,811 i 12 12,395 1 6 56,206<br />
: 107 2,987 1! 225.981<br />
China............................. : 76.809 : 20 1 76,809<br />
Chile.............................. 93,134! 25 1,680 o ] 94,814<br />
j<br />
Great Britain............. 15,200 4 12,242 6 27.442<br />
Germany....................... ..; 41,977 13 3,905 9 ' 45,882<br />
.j 314,638 96 18,765 25! 333,403<br />
Holland........................ .. | 6.060 2 7,719 9 13,779<br />
Hongkong. 58 314.604<br />
h „ K , * : 5.048; 1 5,048<br />
Tta.lv _ !......... .<br />
Japan............................. 80,755 po 3,156 2 83,911<br />
M exico........................... 292,794 75<br />
1 293,171<br />
Panama...... ................... 202,556 96 4,504 3: 207.060<br />
Peru.................. 42,578 12 42,578<br />
New Zealand .. 5,472 9 5.-172<br />
Philippine Islands j 7°.56° 20<br />
72,562<br />
2,4.15<br />
2,415<br />
Sea in distress. .................<br />
Siberia___ ____ __<br />
Tahiti______________ 1.939 ] 1,939<br />
Ecuador__ ... _______ . .<br />
Elsewhere................... 14,385 5 14,385<br />
Total........................... 2,046,417 651 164,896 137 2,211,313<br />
Coastwise................... 4,124,024 436,214 4,560,238<br />
Grand total........... . 6,170.441 601.110 6,771,551<br />
TONNAGE MOVEMENT ARRIVALS<br />
Year<br />
Foreign<br />
Domestic<br />
& Eastern<br />
Total<br />
1904............................ .................... 1,169,545 2,081,848 3,251,393<br />
1905.... ........................ .................... 1.068,533 2,086,900 3,155,438<br />
1906......... .............. . .................... 1,106,325 2,683,085 3,789,410<br />
1907............................ 1,409,482 3,252,608 4,662,090<br />
1908............................. .................... ; 1,3S0,988 3,205,667 4,586,655<br />
1909......... ................... ....................| 1,256,734 3,705,883 4.962,617<br />
1910............................ ....................! 1,454,814 4,259,318 5,714,132<br />
1911......................... .................... 1,653,117 4,696,212 6.349,329<br />
Ini”..................... .................... 1 2,046,417 4,124,024 6,771,551
Digitized for FRASER<br />
http://fraser.stlouisfed.org/<br />
<strong>Federal</strong> <strong>Reserve</strong> <strong>Bank</strong> <strong>of</strong> <strong>St</strong>. <strong>Louis</strong><br />
TONNAGE MOVEMENT— POET OF SAN FEANCISCO YEAE 1912.<br />
DEPASTURES<br />
For<br />
<strong>St</strong>eam<br />
Tons<br />
No.<br />
Vessels<br />
Sail<br />
Tons<br />
No.<br />
Vessels<br />
Total<br />
Australia.......................... 113,323<br />
Alaska.............................. 25,820<br />
Atlantic P orts............... 10,267<br />
34 113,323<br />
27 47,978 ■47 73,798<br />
1 2,052 1 12,319<br />
Belgium................I..........<br />
British Columbia.......... 333,366 169 993 1 334,359<br />
China................................. 36,135 8<br />
36,135<br />
Chile.................................. 110,153 30 762 1 110,915<br />
France............................<br />
Great Britain.................. 73,298 23 24,680 12 97,978<br />
Germany........................ 48,406 15<br />
48,406<br />
Hawaii............................. . 379,067 132 32,358 32 411,425<br />
Holland.....................<br />
Hongkong................. 300,447 51 300,447<br />
India.................................<br />
Italy..................................<br />
Japan................................ 125,568 38 4,734 1 130,302<br />
M exico.............................. 132,595 47 91 1 132,686<br />
Panama........................... 194,722 91 2,511 2 197,233<br />
Peru............................<br />
12,158 5<br />
12,158<br />
New Zealand............<br />
Philippine Islands .. 57,656 16 57,656<br />
Pacific Islands .. 2,246 5 2,246<br />
South A frica ................. 1,885 1 1,862 1 3,747<br />
Siberia.........................<br />
Tahiti......................<br />
Various foreign ............ 8,372 2 2,021 2 10,393<br />
Total................... 1,963,238 122,288 2,085,526<br />
Coastwise.................... 4,138,163 486,744<br />
4,624,907<br />
Grand total................. 6,101,401 690 609,032 106 6,710,433<br />
53
Digitized for FRASER<br />
http://fraser.stlouisfed.org/<br />
<strong>Federal</strong> <strong>Reserve</strong> <strong>Bank</strong> <strong>of</strong> <strong>St</strong>. <strong>Louis</strong><br />
NAVAL CONSTRUCTION<br />
The following is a complete list <strong>of</strong> warships built for the United<br />
<strong>St</strong>ates Navy by the Union Iron Works at San Francisco.<br />
N AM E<br />
D isp la cem<br />
en t<br />
T on s<br />
T y p e<br />
H orse<br />
p o w e r<br />
Speed<br />
K n ots<br />
L a u n ch ed<br />
4,040<br />
6,660 18.20 Ju ly 19,1888<br />
4,088<br />
10,604 20.17 O ct. 26,1889<br />
4,350<br />
5,810 16 A p ril 28,1891<br />
5,870 P rotected C ruiser................... 17,313 21.68 N o v . 5,1892<br />
10,500 12,000 16 O ct. 26,1893<br />
1,000 1,040 12 M a rch 18,1897<br />
1,000 1,003 12 M arch 18,1897<br />
240 5,600 30.60 J u ly 16,1898<br />
11,500 12,766 18.54 N o v . 26.1898<br />
C h ey e n n e.............. 2,700 H a r b o r D efen se M o n ito r ... 2,900 12.70 Sept. 8,1900<br />
P e r r y ....................... 420 T o rp e d o B o a t D estroyer.... 8,000 29 O ct. 27,1900<br />
P r e b le ..................... 420 T o rp e d o B o a t D estroyer.... 8,000 29 M a rch 2,1901<br />
12,440 A rm o re d B a ttle sh ip ............. 14,600 18 M ay 18,1901<br />
P a ul J o n e s............ 420 T o rp e d o B o a t D estroyer.... 7,840 28.90 June 14,1902<br />
120 70 8.50 July 31,1902<br />
120 S u b m a rin e B o a t..................... 70 8,50 Jan . 14,1903<br />
3,500 4,500 16.50 June 2,1903<br />
13,800 23,000 22.20 A p ril 28,1904<br />
13,400 23,000 22.24 J u ly 21,1904<br />
M ilw a u k e e ............ 9,700 P rotected C ruiser................... 21,000 23.07<br />
C on <br />
tra ct<br />
Sept. 10,1904<br />
F - l ............. 400 Subm a rin e B o a t................■.... 780 14 Sept. 6, 1911<br />
M arch 18,1912<br />
M ay 6,1913<br />
•June 4, 1913<br />
F-2 400 780 14<br />
i i i ............::...... 467 ...........d o ..................................... 950 14<br />
H -2 ............. 467 .......... d o ....... .............................. 950 14<br />
K -3 ............... 521 ......... d o ....................................... 950 14<br />
K -7 ............. 519 900 14<br />
K -8 ......................... 519 ...........d o ...................................... 900 14<br />
*Lost, N o v e m b e r 7,1899, o n the n o r th co a st o f L u zon , P h ilip p in e Isla n d s.<br />
SHIPBUILDING SUMMARY.<br />
F R O M U. S. C U S T O M H O U S E R E C O R D S<br />
The following is a classified list <strong>of</strong> new vessels built on the Pacific<br />
Coast and documented at San Francisco for a series <strong>of</strong> years past.<br />
Y E A R<br />
VESSELS<br />
TO N N A GE<br />
T ota l<br />
Vessels<br />
<strong>St</strong>eam Sail G ross N et<br />
9 0 9 9,899 5,397<br />
17 0 17 15,756 9,874<br />
25 2 27 4,513 2,761<br />
19 2 21 387 275<br />
43 1 44 20,018 15,908<br />
22 22 27,549 17,412<br />
14 2 16 7,208 4,719<br />
19 3 22 9,030 7,375<br />
18 6 24 8 239 5,429<br />
21 4 25 21,025 14,210<br />
21 21 42 26,226 20,095<br />
1901................................................................... 25 16 41 11,519 9,669<br />
33 18 51 29,221 22,779<br />
13 7 20 6,675 5,701<br />
1898................................................................... 39 8 47 17,337 10,532<br />
4 6 10 961 705<br />
7 8 15 3,393 2,384<br />
1895................................................................... 6 16 22 1,584 1,350<br />
3 14 .17 2,577 2,095<br />
1893................................................................... 6 15 21 2,897 2,394<br />
23 54 79 9,885 8,915<br />
9 35 44 8,939 8,585<br />
16 29 45 •12,063 10,175<br />
28 18 46 8,544 ’ 7,091<br />
31 27 58 21,921 17,360<br />
23 31 54 17,629 13.908<br />
54
Digitized for FRASER<br />
http://fraser.stlouisfed.org/<br />
<strong>Federal</strong> <strong>Reserve</strong> <strong>Bank</strong> <strong>of</strong> <strong>St</strong>. <strong>Louis</strong><br />
INSURANCE<br />
<strong>St</strong>atistics <strong>of</strong> the Fire and Marine Insurance business transacted in<br />
California as reported by the <strong>St</strong>ate Insurance Commissioner.<br />
1912 1911<br />
FIRE INSURANCE<br />
Amount w ritten.......................................... $1,037,122,915.31 $966,664,270.00<br />
Premiums received................... ; ............... 16,258,040.76 16,154,903.11<br />
Losses paid................................................... 5,569,008.87 4,604,219.19<br />
Ratio <strong>of</strong> losses to premiums..................... 34.3 28.5<br />
MARINE INSURANCE<br />
Amount w ritten.......................................... $472,543,482.00 $412,159,573.00<br />
Premiums received..................................... 2,667,902.00 2,321,318.35<br />
Losses paid .................................................. 779,238.00 1,375,225.59<br />
Ratio <strong>of</strong> losses to premiums.................... 29.2 59.2<br />
This business was apportioned as follows:<br />
TO COMPANIES OF THIS STATE<br />
Fire Insurance—<br />
Amount w ritten.................................. $55,894,586.78 $35,051,042.00<br />
Premiums received............................ 951,016.18 867,818.64<br />
Losses paid............................................ 321,597.00 259,944.19<br />
Ratio <strong>of</strong> losses to premiums............. 33.8 29.9<br />
Marine Insurance—<br />
Amount written.................................. $99,294,159.00 $82,474,412.00<br />
Premiums received ............................ 631,839.56 479,534.03<br />
Losses paid........... ................................ 169,273.26 255,283.63<br />
Ratio <strong>of</strong> losses to premiums............. 26.8 53.2<br />
TO COMPANIES OF OTHER STATES<br />
Fire Insurance—<br />
Amount written.................................. $658,001,997.53 $614,231,878.00<br />
Premiums received............................ 10,269,270.76 10,160,270.53<br />
Losses p a id .......................................... 3,562,447.33 2,904,969.86<br />
Ratio <strong>of</strong> losses to premiums............. 34.7 28.5<br />
Marine Insurance—<br />
Amount w ritten.................................. $97,963,702.00 $70,899,408.60<br />
Premiums received............................ 890,594.49 757,729.16<br />
Losses paid............................................ 256,144.21 439,650.80<br />
Ratio <strong>of</strong> losses to premiums............. 28.7 58.0<br />
TO COMPANIES OF FOREIGN COUNTRIES<br />
Fire Insurance—<br />
Amount, written................................. $323,226,331.00 $317,381,350.00<br />
Premiums received............................ 5,037,753.82 5,126,813.84<br />
Losses paid............................................ 1,684,963.92 1,439,305.14<br />
Ratio <strong>of</strong> losses to premiums............. 33.4 28.0<br />
Marine Insurance—<br />
Amount written.................................. $275,285,621.00 $258,785,752.40<br />
Premiums received.......................... 1,145,467.95 1,084,055.16<br />
Losses paid............................................ 353,820.53 680,291.16<br />
Ratio <strong>of</strong> losses to premiums............. 30.8 62.7
Digitized for FRASER<br />
http://fraser.stlouisfed.org/<br />
<strong>Federal</strong> <strong>Reserve</strong> <strong>Bank</strong> <strong>of</strong> <strong>St</strong>. <strong>Louis</strong><br />
INTERNAL REVENUE COLLECTIONS<br />
During the past years the collections <strong>of</strong> Internal Revenue in the<br />
San Francisco District were as follows:<br />
1912.................................................................................................. $7,782,197.40<br />
1911............................................................................................... 7,143,523.85<br />
1910.................................................................................................. 6,823,477.68<br />
1909.................................................................. ............................... 5,934,401.04<br />
1908.................................................................................................. 6,623,558.01<br />
1907.................................................................................................. 4,878,978.23<br />
1906.................................................................................................. 4,542,255.87<br />
1905.................................................................................................. 4,135,621.17<br />
1904.................................................................................................. 3,181,653.83<br />
1903.......... ....................................................................................... 2,794,597.21<br />
1902.................................................................................................. 2,892,760.33<br />
1901............:..................................................................................... 3,677,092.46<br />
1900........................................................................ ........................ 4,019,086.30<br />
1899.................................................... ............................................. 3,686,417.20<br />
1898.................................................................................................. 3,023,902.20<br />
1897.................................................................................................. 2,490,471.20<br />
1896.................................................................................................. 2,410,019.46<br />
1895.................................................................................................. 2,067,946.28<br />
1894............................ ........-............................................................. 1,692,796.07<br />
1893.................................................................................................. 1,686,592.23<br />
1892.................................................................................................. 1,818,351.43<br />
1891.................................................................................................. 1,887,561.23<br />
1890.—.................................................................................................. 1,858,852.48<br />
Classified, the collections during the last three years were as follows:<br />
For 1912 1911 1910<br />
Lists....................................... $1,023,654.14<br />
Beer........................................ 797,125.00<br />
Spirits.................................... 5,302,261.91<br />
Cigars and Cigarettes..... .... 324,571.46<br />
Snuff.............................-......... 178.87<br />
Tobacco.................................. 20,731.12<br />
Specials.................................. 312,330.74<br />
Playing Cards....................... 1,065.86<br />
Export <strong>St</strong>amps.....................<br />
42.30<br />
Case Goods............................<br />
236.00<br />
$ 986,571.66<br />
731,036.75<br />
4,801,260.75<br />
299,508.09<br />
219.91<br />
22,569.58<br />
301,088.19<br />
1,030.92<br />
46.00<br />
192.00<br />
$ 899,525.01<br />
740,429.50<br />
4,584,042.76<br />
277,307.92<br />
224.99<br />
18,080.58<br />
301,344.04<br />
858.08<br />
62.20<br />
124.00<br />
1,478.60<br />
Totals............................. $7,782,197.40 $7,143,523.85 $6,823,477.68<br />
56
Digitized for FRASER<br />
http://fraser.stlouisfed.org/<br />
<strong>Federal</strong> <strong>Reserve</strong> <strong>Bank</strong> <strong>of</strong> <strong>St</strong>. <strong>Louis</strong><br />
CALIFORNIA FRUIT AND VEGETABLE STATISTICS<br />
From California Fruit Grower<br />
FEESH DECIDUOUS FEUIT<br />
EAILEOAD SHIPMENTS— CAELOADS<br />
From north <strong>of</strong> Tehachapi in actual carloads— apples not included.<br />
Variety— 1906 1907 1908 1909 1910 1911 1912<br />
Apricots...... 16 71 231J 2084 289| 2234 1954<br />
Cherries....... 150 98 2084 249f 2504 2164 2444<br />
Grapes.......... 2,052 3,460 3,8164 5,875 4,9474 6,3744<br />
Peaches........ 584 699 1,9804 2,599 2,5174 2,027<br />
6,3574<br />
1,6214<br />
3,1344<br />
1,7754<br />
Sundry......... 21 18 15 204 17 164 154<br />
Pears............<br />
Plums...........<br />
1,513<br />
1,220<br />
1,039<br />
1,039<br />
2,7014<br />
1,763<br />
2,638<br />
1,526|<br />
2,361<br />
1,5524<br />
2,324f<br />
1,366<br />
Total cars. 5,556 6,424 10,716 13,117 11,936 12,5484 13,3431<br />
CALIFOENIA CITEUS FEUIT SHIPMENTS<br />
(Includes Southern, Central and Northern California)<br />
Season ' Cars<br />
1911-12........................................................................................................ 40,290<br />
1910-11........................................................................................................ 46,394<br />
1909-10........................................................................................................ 33,099<br />
1908-09......................................................................................................... 40,516<br />
1907-08......................................................................................................... 32,729<br />
1906-07........................................................................................................ 29,820<br />
1905-06......................................................................................................... 27,610<br />
1904-05......................................................................................................... 31,422<br />
1903-04......................................................................................................... 29,399<br />
1902-03.............................. .......................................................................... 23,871<br />
1901-02......................................................................................................... 19,180<br />
1900-01......................................................................................................... 24,900<br />
1899-00......................................................................................................... 18,400<br />
1898-99........................................................................................................ 10,875<br />
1897-98........................................................................................................ 15,400<br />
1896-97........................................................................................................ 7,350<br />
1895-96....................... ;........................................................... .................... 6,915<br />
1894-95......................................................................................................... 7,575<br />
57
Digitized for FRASER<br />
http://fraser.stlouisfed.org/<br />
<strong>Federal</strong> <strong>Reserve</strong> <strong>Bank</strong> <strong>of</strong> <strong>St</strong>. <strong>Louis</strong><br />
Fruits—<br />
CALIFORNIA CANNED FRUIT AND VEGETABLE PACK<br />
(Copyright, 1913, by Howard C. Rowley, Editor, California Fruit Grower)<br />
(Compiled Yearly by California Fruit Grower from Individual Packers’ Reports)<br />
Apples.............................................................. . 9,500<br />
Apricots........................................................... 772,775<br />
Blackberries.................................................— 55,375<br />
Cherries, Royal Ann..........................-......... 215,640<br />
Cherries, black................................. -............ 52,670<br />
Cherries, white.............................................. 51,025<br />
Grapes.............................................................. 40,960<br />
Loganberries......... - ..................-................... 16,965<br />
Nectarines.......................................................<br />
Pears................................................................. 832,350<br />
Peaches, free.................................................. 480,660<br />
Peaches, cling............. .................................. 1,469,275<br />
Plums..............................-................................ 148,990<br />
Raspberries...................................................... 8,520<br />
<strong>St</strong>rawberries................................................... 25,800<br />
Other fruits...................................... -............ 23,565<br />
1912 1911 1910<br />
Cases Cases Cases<br />
Nos. 2+ and<br />
3, etc.<br />
(all grades)<br />
Total fruits (cases)............................. 4,204,070 629,830 3,529,896 652,754 3,242,942 765,607<br />
Grand total fruits..................-............. 4,833,900 4,182,650<br />
4,008,549<br />
Vegetables—<br />
Asparagus........................................... -........... 714,900<br />
Beans................................................................ 76,690<br />
p eas........................................ .......................... 251,275<br />
Tomatoes......................................................... 1,396,900<br />
Other vegetables.... ...................................... 66,390<br />
N o 8 N os. 2} a n d N o. 8 N os. 2i and N o. 8<br />
(g a llo n s ) 3, etc. (g a llo n s ) 3, etc. (g a llo n s )<br />
(a ll grades) (a ll grades) (a ll g ra d es) (a llg r a d e s ) (a llg r a d e s )<br />
70,750 8,750 56,550 6,280 .70,550<br />
125,230 708,500 149,825 544,530 198,630<br />
46,630 35,250 42,575 26,425 35,600<br />
21,820 99,700 11,740 123,240 13,050<br />
4,050 26,860 2,005 18,110 1,510<br />
6,690 49,730 8,770 33,410 5,875<br />
6,225 62,115 8,800 39,285 6,360<br />
4,415 12,106 7,011 6,977 5,662<br />
5 18 ......... 1<br />
41,850 579,960 38,960 568,125 51,230<br />
103,140 582,200 156,200 553,000 195,825<br />
160,980 1,210,525 142,200 1,233,200 163,425<br />
26,300 143,350 22,490 65,550 14,810<br />
570 2,950 675 9,335 791<br />
8,670 6,505 1,210 13,225 848<br />
2,510 1,390 3,725 2,250 1,440<br />
4,300 684,960 2,105 614,050 3,225<br />
7,665 53,110 12,710 41,610 4,640<br />
18,150 162,570 22,205 140,855 26,920<br />
224,200 1,306,190 209,260 1,159,875 190,435<br />
29,025 39,575 23,970 49,075 19,960<br />
Total vegetables (cases).................... 2,506,155 283,340 2,246,405 . . . 270,250 2,005,465 245,180<br />
Grand total vegetables....................... 2,789,495 2,516,655<br />
2,250,645<br />
Grand total pack (cases).................. 7,623,395 6,699,305 6,259,194<br />
i
Digitized for FRASER<br />
http://fraser.stlouisfed.org/<br />
<strong>Federal</strong> <strong>Reserve</strong> <strong>Bank</strong> <strong>of</strong> <strong>St</strong>. <strong>Louis</strong><br />
FRUIT AND VEGETABLE PACK<br />
Cases<br />
Year Fruits Vegetables<br />
1912...............................................................................4,833,900 2,789,495<br />
1911...............................................................................4,182,650 2,516,655<br />
1910...............................................................................4,008,549 2,250,645<br />
1909........................................................................... ...3,047,001 1,242,720<br />
1908...............................................................................4,734,663 1,501,885<br />
1907...............................................................................2,982,955 1,941,755<br />
1906...............................................................................3,109,225 1,747,595<br />
1905...............................................................................3,283,296 1,192,455<br />
1904...............................................................................2,839,733' 961,783<br />
1903...............................................................................2,733,504 1,343,574<br />
1902...............................................................................2,252,790 1,151,268<br />
1901...............................................................................2,677,072 .1,076,058<br />
1900...............................................................................2,775,896 803,617<br />
CALIFORNIA CURED FRUIT OUTPUT<br />
1907 1908 1909 1910 1911 1912<br />
Tons Tons Tons Tons Tons Tons<br />
A p p les........... ........ 3,300 3,350 3,000 3,000 3,500 3,600<br />
Apricots......... ........ 1,100 19,000 14,000 15,250 11,000 19,750<br />
Figs................. ........ 4,500 2,900 4,000 8,775 5,500 5,000<br />
Peaches ......... ........ 15,000 23,000 20,000 25,000 14,000 30,000<br />
Prunes............ ........ 53,000 28,500 75,000 40,000 95,000 102,500<br />
Raisins........ . ........ 75,000 65,000 70,000 62,500 65,000 95,000<br />
Various other ....... 1,200 3,000 2,500 1,750 8,750 3,000<br />
Total tons .. ........ 153,100 144,750 188,500 151,275 197,750 258,850<br />
CALIFORNIA RAISIN PACK<br />
Year<br />
1912..<br />
L911-.<br />
1910.<br />
1909.<br />
1908..<br />
1907..<br />
1906..<br />
1905..<br />
1904.<br />
1903..<br />
1902..<br />
1901..<br />
1900..<br />
1899..<br />
1898..<br />
1897.<br />
1896..<br />
1895..<br />
1894..<br />
1893..<br />
Pounds<br />
190.000.000<br />
130.000.000<br />
125.000.000<br />
140.000.000<br />
130.000.000<br />
150.000.000<br />
100.000.000<br />
90.000.000<br />
80.000.000<br />
120,000,000<br />
108,000,000<br />
74.000.000<br />
94.325.000<br />
71.568.000<br />
80.631.000<br />
93.704.000<br />
68,250,600<br />
91.360.000<br />
103,000,000<br />
85.000.000<br />
59
Digitized for FRASER<br />
http://fraser.stlouisfed.org/<br />
<strong>Federal</strong> <strong>Reserve</strong> <strong>Bank</strong> <strong>of</strong> <strong>St</strong>. <strong>Louis</strong><br />
CRUDE OIL PRODUCTION<br />
ANNUAL OUTPUT<br />
Y e a r B a r r e l s V a l u e Y e a r B a r r e l s V a l u e<br />
1870... 3,600 $ 5,125 1892... 385,049 561,333<br />
1871... 5,200 7,370 1893... 470,179 608,092<br />
1 8 72... 6,500 9,876 1894... 783,078 1,064,521<br />
1873... 7,200 10,920 1895. .. 1,245,339 1,000,235<br />
1 8 74... 7,700 11,540 1896... 1,257,780 1,180,793<br />
1875... 8,400 12,090 1897... 1,911,569 1,918,269<br />
1 8 76... 9,600 15,410 1898... 2,249,088 2,376,420<br />
1877... 12,750 18,140 1899... 2,677,875 2,660,793<br />
18 78... 15,227 22,780 1900... 4,329,950 4,152,928<br />
18 79... 19,858 29,672 1901... 8,754,500 7,487,600<br />
1880... 42,399 68,450 1902... 13,973,500 10,269,385<br />
1881... 99,862 130,678 1903... 24,337,828 16,521,400<br />
1882... 128,636 172,730 1904... 28,476,025 19,896,702<br />
1883... 142,857 207,540 1905... 35,671,000 23,381,150<br />
1884... 262,000 428,600 1906... 36,474,000 26,029,155<br />
1885... 325,000 613,920 1907... 38,265,200 28,708,750<br />
1886... 377,145 642,785 1908... 45,546,500 32,109,620<br />
1887... 678,572 1,357,144 1909... 56,982,670 39,887,920<br />
1888... 690,333 1,380,666 1910... 77,699,683 46,752,512<br />
1889... 303,220 368,048 1911... *79,148,145 37,920,820<br />
1 8 90... 307,360 384,200 1912... 94,074,439 42,410,000<br />
1891... 323,600 401,264<br />
*In 1911, 5,500,000 barrels <strong>of</strong> petroleum were consumed in the oil<br />
fields for fuel. This figure should be added to get the actual total<br />
produced. The figures for previous years do not include oil consumed<br />
for fuel in the fields.<br />
Valuations are based on selling prices at tidewater.<br />
FUEL OIL<br />
Exports by Sea<br />
To<br />
1912 1911<br />
Gallons Values Gallons Values<br />
Panama..................................<br />
Chile........................................<br />
Peru........................................<br />
Guatemala..............................<br />
Canada....................................<br />
French Oceania.....................<br />
Salvador.................................<br />
German Oceania...................<br />
M exico....................................<br />
England..................................<br />
Nicaragua..............................<br />
Philippines.............................<br />
Aus. & Tasmania...................<br />
Costa Eica..............................<br />
35,199,131<br />
49,086,392<br />
6,339,072<br />
2.898.000<br />
7.896.000<br />
5,374<br />
4,898<br />
1,740<br />
315<br />
3,781,559<br />
72,095<br />
14,210<br />
538<br />
$ 519,067<br />
666,888<br />
91,235<br />
42,600<br />
150,400<br />
328<br />
140<br />
160<br />
6<br />
53,447<br />
3,944<br />
966<br />
16<br />
36,734,880<br />
19,454,000<br />
3,000,329<br />
1,092,000<br />
672,000<br />
4,756<br />
4,655<br />
3,278<br />
220<br />
220<br />
$524,784<br />
292,200<br />
41,367<br />
15,600<br />
9,600<br />
334<br />
240<br />
98<br />
16<br />
10<br />
Totals.............................. 105,299,320 $1,529,197 60,966,338 $884,249<br />
60
Digitized for FRASER<br />
http://fraser.stlouisfed.org/<br />
<strong>Federal</strong> <strong>Reserve</strong> <strong>Bank</strong> <strong>of</strong> <strong>St</strong>. <strong>Louis</strong><br />
PRODUCTION BY DISTRICTS<br />
(F r o m C a lifo rn ia D e r r ic k .)<br />
Producing Fields 1912<br />
Barrels<br />
1911<br />
Barrels<br />
1910<br />
Barrels<br />
Kern River..................................... 12,446,445 14 078,390 14,776,435<br />
M cK ittrick..................................... 6,462,350 5 447,532 5,471,613<br />
M idway........................................... 25,948,945 21 584,566 11,174,207<br />
Sunset.............................................. 5,590,824 5 559,069 9,218,904<br />
Coalinga.......................................... 19,446,122 18 324,701 18,651,470<br />
Watsonville.................................... 43,920 40,850 36,660<br />
Arroyo Grande.............................. 1,950 20,500 22,310<br />
Lompoc........................................... 1,013,880 795,000 698,210<br />
Santa Maria.................................. 5,788,086 6 670,074 6,909,620<br />
Summerland................................... 65,715 71,255 74,725<br />
Santa Paula................................... 740,173 515,675 492,147<br />
Newhall........................................... 119,712 146,110 160,428<br />
Salt Lake.......... ............................ 2,662,776 2 794,233 3,263,104<br />
Los Angeles................................... 410,661 429,528 466,514<br />
W hittier-Coyote........................... 1,125,769 1 069,437 1,198,260<br />
Puente.............................................. 29,650 32,895 38,960<br />
Fullerton-Brea Canyon............... 6,764,360 5 978,823 5,044,001<br />
Lost Hills ..................................... 1,313,076 154,960 2,115<br />
Totals......................................<br />
Avge. Daily Yield, bbls.............<br />
Districts<br />
90,074,439<br />
246,779<br />
PRODUCTION BY WELLS<br />
1911<br />
Producing<br />
Wells<br />
83,744,044<br />
229,435<br />
1910<br />
Producing<br />
Wells<br />
77,699,683<br />
212,876<br />
1909<br />
Producing<br />
Wells<br />
Kern River.................................... 1,605 1,566 1,324<br />
M cK ittrick..................................... 178 189 134<br />
Midway........................................... 447 318 119<br />
Sunset.............................................. 196 138 107<br />
Coalinga...................................... .<br />
Watsonville....................................<br />
736 733<br />
3<br />
569<br />
4<br />
Arroyo Grande.............................. 4 6 3<br />
Lompoc............................................ 20 20 16<br />
Santa Maria................................... 154 149 133<br />
Summerland................................... 131 134 112<br />
Santa Paula................................... 264 ' 250 243<br />
Newhall........................................... 76 77 70<br />
Salt Lake....................................... 245 261 226<br />
Los Angeles.................................. 415 416 450<br />
W hittier-Coyote........................... 141 140 134<br />
Puente......................................... 56 55 54<br />
Fullerton-Brea Canyon.............. 250 237 221<br />
Various............................................ 4 14 17<br />
Totals...................................... 4,942 4,706 3,936<br />
The production <strong>of</strong> the <strong>St</strong>ate varies in gravity from 9° Beaume, the<br />
lowest gravity in the Sunset field, to 38° B., the highest gravity in<br />
the Newhall field.<br />
The bulk <strong>of</strong> the kerosene used on the Pacific Coast is now being<br />
refined from California oil. The lubricating oils used on the Pacific<br />
Coast are practically all <strong>of</strong> California production.<br />
61
Digitized for FRASER<br />
http://fraser.stlouisfed.org/<br />
<strong>Federal</strong> <strong>Reserve</strong> <strong>Bank</strong> <strong>of</strong> <strong>St</strong>. <strong>Louis</strong><br />
CALIFORNIA PROPERTY<br />
Showing the <strong>St</strong>ate rate <strong>of</strong> taxation on each $100 <strong>of</strong> valuation from the<br />
organization <strong>of</strong> the <strong>St</strong>ate Government.<br />
Y E A R S<br />
Cotal Assessed<br />
V a lu e o f all<br />
P ro p e rty in<br />
C a lifo rn ia<br />
V a lu e o f<br />
P erson a l<br />
P rop erty<br />
P ercen t<br />
age o f<br />
P erson a l<br />
P ro p e rty<br />
<strong>St</strong>ate<br />
R ate o f<br />
T a x a tio n<br />
1850.<br />
1851.<br />
1852.<br />
185a.<br />
1854.<br />
1855.<br />
1856.<br />
1857.<br />
1858.<br />
1859.<br />
1860.<br />
1861.<br />
1862.<br />
1863.<br />
1864.<br />
1865.<br />
1866.,<br />
1867.<br />
1868.,<br />
1869.<br />
1870.<br />
1871.<br />
1872.<br />
1873..<br />
1874.<br />
1875.<br />
1876..<br />
1877..<br />
1878..<br />
1879..<br />
1880..<br />
1881..<br />
1882..<br />
1883..<br />
1884..<br />
1885..<br />
1886..<br />
1887..<br />
1888..<br />
1.889..<br />
1890..<br />
1891..<br />
1892..<br />
1893..<br />
1894..<br />
1895..<br />
1896..<br />
1897..<br />
1898..<br />
1899..<br />
1900..<br />
1901..<br />
1902..<br />
1903..<br />
1904..<br />
1905..<br />
1906..<br />
1907..<br />
1908..<br />
1909..<br />
1910..<br />
1911..<br />
1912..<br />
f 57,670,689 $ 13,968,797 24.22 $0.50<br />
49,231,052 20,935,116 42.52 .65<br />
64,579,375 24,213,395 37.49 .65<br />
95,335,646 33,674,000 35.32 .60<br />
111,191,630 39,040,428 35.11 .60<br />
103,887,193 34,858,319 33.56 .60<br />
115,007,440 40,942,699 35.60 .70<br />
126,059,461 59,149,630 46.92 .70<br />
125,955,877 54,185,728 43.01 .60<br />
131,060,279 56,580,344 43.17 .60<br />
148,193,540 68,369,383 46.06 .60<br />
147,811,617 73,350,591 49.62 .60<br />
160,369,071 74,014,666 46.15 .77<br />
174,104,955 80,496,645 46.23 .92<br />
179,164,730 78,117,375 43.60 1.25<br />
183,534,312 79,782,436 43.47 1.15<br />
200,368,826 92,490,635 46.15 1.13<br />
212,205,339 100,105,600 47.17 1.13<br />
237,483,175 105,1] 2,083 44.26 1.00<br />
260,563,879 104,723,592 40.19 .97<br />
277,538,134 . 108,001,588 38.90 .865<br />
267,868,126 86,174,230 32.17 .865<br />
637,232,823 219,942,323 30.40 .50<br />
528,747,043 118,425,520 22.20 .50<br />
611,495,197 210,779,127 34.46 .649<br />
618,083,315 199,243,292 32.07 .605<br />
595,073,177 140,431,866 25.27 .735<br />
586,953,022 128,780,824 21.77 .63<br />
584,578,036 118,304,451 20.23 .55<br />
549,220,968 112,325,850 20.45 .625<br />
666,399,985 174,514,906 26.18 .64<br />
659,835,762 160,058,309 24.24 .655<br />
608,642,036 134,048,419 22.02 .596<br />
765,729,430 167,338,644 ' 21.85 .497<br />
821,078,767 166,394,997 20.26 .452<br />
859,512,384 172,760,681 27.90 .544<br />
816,446,700 151,937,132 18.60 .56<br />
956,740,805 165,663,387 17.31 .608<br />
1,107,952,700 173,273,458 15.63 .504<br />
1,111,550,979 170,661,836 15.35 .722<br />
1,101,137,290 169,489,475 15.39 .58<br />
1,239,647,063 189,599,783 15.29 .446<br />
1,275,816,228 187,008,874 14.66 .434<br />
1,216,700,283 173,853,273 14.59 .576<br />
1,205,918,403 163,581,104 •13.56 .493<br />
1,138,282,013 157,726,988 13.85 .685<br />
1,266,593,065 142,353,345 11.24 .429<br />
1,089,814,836 120,592,875 11.07 .51<br />
1,130,885,697 128,855,959 11.39 .488<br />
1,193,764,673 164,070,620 13.74 .601<br />
1,218,292,457 184,380,015 15.13 .498<br />
1,241,705,803 189,506,344 15.26 .48<br />
1,290,750,465 200,164,271 15.50 .382<br />
1,598,603,226 269,488,904 16.85 .561<br />
1,550,511,761 239,623.282 15.45 .535<br />
1,624,991,742 239,062,273 14.71 , .49<br />
1,594,781,905 238,006,160 14.92 .476<br />
1,878,661,035 288,172,950 15.34 .445<br />
1,994,511,229 275,481,764 13.81 .40<br />
2,438,656,554 317,805,084 13.03 .364<br />
2,373,897.092 278,669,645 11.74 .353<br />
2,458,804,7-13 252,884,962 10.28 .05*<br />
2,919,342,8*9 313,100,040 10.72 .044<br />
’ M eth od o f ta x a tio n c h a n g e d in 1911.<br />
62
Digitized for FRASER<br />
http://fraser.stlouisfed.org/<br />
<strong>Federal</strong> <strong>Reserve</strong> <strong>Bank</strong> <strong>of</strong> <strong>St</strong>. <strong>Louis</strong><br />
CALIFORNIA’S GOLD<br />
(A ll figu res on m in era ls fro m <strong>St</strong>ate M in in g B u re a u .)<br />
Gold was discovered by James W . Marshall 011 January 24, 1848, at<br />
Sutter’ s Mill, near Coloma, El Dorado County.<br />
Year Production Year Production<br />
1848............. $ 245,301 1881............................ $19,223,155<br />
1849.... 10,151,360 1882 17,146,416<br />
1850............. 41,273,106 1883............................ 24,316,873<br />
1851.............. 75,938,232 1884............................ 13,600,000<br />
1852................. 81,294,700 1885 12,661,044<br />
1853............. 67,613,487 1886 ...<br />
14,716,506<br />
1854.............. 69,433,931 1887............................ 13,588,614<br />
1855............................ 55,485,395 1888 12,750,000<br />
1856............. 57,509,411 1889<br />
11,212,913<br />
1857............... 43,628,172 1890............................ 12,309,793<br />
1858............. 46,591,140 1891.......................... . 12,728,869<br />
1859............. 45,846,599 1892............................ 12,571,900<br />
1860.......................... 44,095,163 1893............................ 12,422,811<br />
1861............. 41,884,995 1894............................ 13,923,281<br />
1862.............. 38,854,668 1895 15,334,317<br />
1863................ 23,501,736 1896............................ 17,181,562<br />
1864.............. 24,071,423 1897............................ 15,871,401<br />
1865.... 17,930,858 1898............................ 15,906,478<br />
1866........... 17,123,867 1899............................ 15,336,031<br />
1867.............. 18,265,452 1900............................ 15,863,355<br />
1868............ 17,555,867 1901............................ 16,989,044<br />
1869.. 18,229,044 1902............................ 16,910,320<br />
1870........... 17,458,133. 1903............................ 16,471,264<br />
1871.. 17,477,885 1904............................ 19,109,600<br />
1872........... 15,482,194 1905............................ 19,197,043<br />
1873........... 15,019,210 1906........................... 18,732,452<br />
1874.... 17,264,836 1907............................ 16,727,928<br />
1875............. 16,876,009 1908_______________ 18,761,559<br />
1876.............. 15,610,723 1909............................ 19,284,105<br />
1877............ 16,501,268 1910..................:........ 19,715,440<br />
1878.... 18,839,141 1911............................ 19,738,908<br />
187 9 .<br />
19,626,654 1912........................... 20,000,000<br />
188 0<br />
20,030,761<br />
Total product in 65 years....................... ................ ............. $1,548,252,144<br />
SILVER<br />
Year Production Year Production<br />
1888.......... $1,700,000 1901 $1,229,356<br />
1889............. 754,793 1902<br />
616,412<br />
1890........... 1,060,613 1903<br />
517,444<br />
1891...,......... 953,157 1904<br />
873,525<br />
1892............. 463,602 1905 678,494<br />
1893............. 537,157 1906 . 817,830<br />
1894............... 297,332 1907 751.646<br />
1895............... 599,789 1908<br />
873,057<br />
1896.... 422,464 1909..<br />
896,250<br />
1897............. 452,789 1910<br />
993.646<br />
1898............. 414,055 1911<br />
673,336<br />
1899................ 504,012 1912<br />
750,000<br />
1900..................<br />
1,510,344<br />
68
Digitized for FRASER<br />
http://fraser.stlouisfed.org/<br />
<strong>Federal</strong> <strong>Reserve</strong> <strong>Bank</strong> <strong>of</strong> <strong>St</strong>. <strong>Louis</strong><br />
M INERAL PRODUCTS<br />
Salt<br />
Coal<br />
Year Tons Value Year Tons Value<br />
1887....... 28,000 $112,000 1887....... 50,000 $150,000<br />
1888....... 30,800 92,400 1888....... 95,000 380,000<br />
1889....... 21,000 63,000 1889....... 121,280 288,232<br />
1890....... 8,729 57,085 1890....... 110,711 283,019<br />
1891___ 26,094 90,303 1891....... 93,301 204,902<br />
1892....... 23,570 104,788 1892....... 85,178 209,711<br />
1893....... 50,500 213,000 1893....... 72,603 167,555<br />
1894....... 49,131 140,087 1894....... 59,887 139,862<br />
1895....... 53,031 150,576 1895....... 79,858 193,790<br />
1896....... 64,743 153,244 1896___ 70,649 161,335<br />
1897....... 67,851 157,520 1897____ 87,449 196,255<br />
1898....... 93,421 170,855 1898....... 143,045 337,475<br />
1899....... 82,654 149,588 1899....... 160,941 420,109<br />
1900....... 89,338 204,754 1900....... 176,956 535,531<br />
1901___ 126,218 366,376 1901....... 150,724 401,772<br />
1902....... 115,208 205,876 1902....... 88,460 248,622<br />
1903....... 102,895 211,365 1903___ 93,026 265,383<br />
1904....... 95,968 187,300 1904....... 79,062 376,494<br />
1905....... 77,118 141,925 1905....... 46,500 144,500<br />
1906....... 101,650 213,228 1906....... 24,850 61,600<br />
1907....... 88,063 310,967 1907....... 23,734 55,849<br />
1908....... 121,764 281,469 1908....... 18,496 55,503<br />
1909....... 155,680 414,708 1909....... 49,389 216,913<br />
1910....... 174,920 395,417 1910....... 11,033 23,484<br />
1911....... 173,332 324,255 1911....... 11,047 18,297<br />
1912....... 14,848 39,092<br />
Clay (Pottery)<br />
Year Tons Value<br />
1887....... 75,000 $37,500<br />
1888....... 75,000 37,500<br />
1889....... 75,000 37,500<br />
1890........ 100,000 50,000<br />
1891..... 100,000 50,000<br />
1892....... 100,000 50,000<br />
1893....... 24,856 67,284<br />
1894....... 28,475 35,073<br />
1895....... 37,660 39,685<br />
1896....... 41,907 62,900<br />
1897....... 24,592 30,290<br />
1898....... 28,947 33,747<br />
1899....... 40,600 42,700<br />
1900....... 59,636 60,956<br />
1901....... 55,679 39,144<br />
1902....... 67,933 74,163<br />
1903....... 90,972 99,907<br />
1904....... 84,149 81,952<br />
1905....... 133,805 130,146<br />
1906....... 167,267 162,283<br />
1907....... 160,385 254,454<br />
1908....... 208,042 325,147<br />
1909....... 299,424 465,647<br />
1910___ 249,028 324,099<br />
1911 224,576 252,759<br />
Gypsum<br />
Year Tons Value<br />
1887....... 2,700 $27,000<br />
1888....... 2,500 25,000<br />
1889....... 3,000 30,000<br />
1890....... 3,000 30,000<br />
1891....... 2,000 20,000<br />
1892....... 2,000 20,000<br />
1893....... 1,620 14,280<br />
1894....... 2,446 24,584-<br />
1895___ 5,158 51,014<br />
1896....... 1,310 12,580<br />
1897....... 2,200 19,250<br />
1898___ 3,100 23,600<br />
1899....... 3,663 14,950<br />
1900....... 2,522 10,088<br />
1901....... 3,875 38,750<br />
1902....... 10,200 53,500<br />
1903....... 6,914 46,441<br />
1904....... 8,350 56,592<br />
1905....... 12,880 54,500<br />
1906....... 21,000 69,000<br />
1907___ 8,900 57,700<br />
1908....... 34,600 155,400<br />
1909....... 30,700 138,176<br />
1910...... 45,294 129,152<br />
1911 31,457 101,475<br />
64
Digitized for FRASER<br />
http://fraser.stlouisfed.org/<br />
<strong>Federal</strong> <strong>Reserve</strong> <strong>Bank</strong> <strong>of</strong> <strong>St</strong>. <strong>Louis</strong><br />
M INERAL PRODUCTS<br />
Copper<br />
Borax<br />
Year Pounds Value Year Pounds V alue<br />
1887....... 1,600,000 $ 192,000 1887....... 2,029,380 $ 116,689<br />
1888....... 1,570,021 235,303 1888....... 2,809,088 196,636<br />
1889....... 151,505 18,180 1889....... 1,939,650 145,473<br />
1890....... 23,347 3,502 1890....... 6,402,034 480,152<br />
1891....... 3,397,455 424,675 1891....... 8,533,337 640,000<br />
1892..... 2,960,944 342,808 1892....... 11,050,495 838,787<br />
1893....... 239,682 21,571 1893....... 7,910,563 593,292<br />
1894....... 738,594 72,486 1894..:.... 11,540,099 807,807<br />
1895....... 225,650 21,901 1895....... 11,918,000 595,900<br />
1896....... 1,992,844 199,519 1896....... 13,508,000 675,400<br />
1897........ 13,638,626 1,540,666 1897....... 16,000,000 1,080,000<br />
1898....... 21,543,229 2,475,168 1898...... 16,600,000 1,153,000<br />
1899....... 23,915,486 3,990,534 1899___ 40,714,000 1,139,882<br />
1900....... 29,515,512 4,748,242 1900....... 51,674,000 1,013,251<br />
1901....... 34,931,788 5,501,782 1901....... 14,442,000 982,380<br />
1902....... 27,860,162 3,239,975 1902....... 34,404,000 2,234,994<br />
1903....... 19,113,861 2,520,997 1903..... 68,860,000 661,400<br />
1904.'...... 29,974,154 3,969,995 1001__ 91,294,000 698,810<br />
1905....... 16,997,489 2,650,605 1905...... 97,068,000 1,019,158<br />
1906....... 28,726,448 5,522,712 1906....... 116,346,000 1,182,410<br />
1907___ 32,602,945 6,341,387 1907....... 106,825,000 1,200,913<br />
1908..... 40,868,772 5,350,777 1808....... 44,400,000 1,117,000<br />
1909....... 65,727,736 8,478,142 1909...... 33,257,000 1,163,960<br />
1910....... 53,721,032 6,680,641 1910___ 33,656,000 1,177,960<br />
1911....... 36,838,024 4,604,753 1911....... 101,890,000 1,456,672<br />
1912....... 5,000,000 1912....... 1,500,000<br />
Asphalt<br />
Year Tons Value<br />
1887....... 4,000 $ 16,000<br />
1888....... 3,100 39,500<br />
1889....... 3,000 30,000<br />
1890....... ■3,000 30,000<br />
1891....... 4,000 40,000<br />
1892....... 7,550 75,500<br />
1893....... 9,150 161,250<br />
1894..... 11,698 233,800<br />
1895....... 25,525 170,500<br />
1896....... 20,914 362,590<br />
1897....... 22,697 404,350<br />
1898....... 25,690 482,175<br />
1899....... 15,060 308,130<br />
1900....... 12,575 253,950<br />
1901....... 21,634 313,219<br />
1902....... 34,511 349,344<br />
1903....... 41,670 503,659<br />
1904....... 56,187 672,910<br />
1905....... 40,304 285,290<br />
1906....... 77,756 777,560<br />
1907....... 79,718 1,058,400<br />
1908....... 105,443 1,082,376<br />
1909...... 136,664 1,707,159<br />
1910....... 184,967 2,125,122<br />
1911 2,250,000<br />
Bituminous Rock<br />
Year Tons Value<br />
1887....... 36,000 $ 160,000<br />
1888...... 50,000 257,000<br />
1889....... 40,000 170,000<br />
1890....... 40,000 160,000<br />
1891....... 39,962 154,164<br />
1892___ 24,000 72,000<br />
1893....... 32,000 192,036<br />
1894....... 31,214 115,193<br />
1895....... 38,921 121,586<br />
1896....... 49,456 122,500<br />
1897....... 45,470 128,173<br />
1898....... 46,836 137,575<br />
1899....... 40,321 116,097<br />
1900....... 25,306 71,495<br />
1901..... 24,052 66,354<br />
1902....... 33,490 43,411<br />
1903....... 21,944 53,106<br />
1904....... 45,280 175,680<br />
1905....... 24,753 60,436<br />
1906....... 16,077 45,204<br />
1907....... 24,122 72,835<br />
1908...... 30,718 109,818<br />
1909....... 34,123 116,436<br />
1910....... 87,547 165,711<br />
1911 75,125 117,279<br />
65
Digitized for FRASER<br />
http://fraser.stlouisfed.org/<br />
<strong>Federal</strong> <strong>Reserve</strong> <strong>Bank</strong> <strong>of</strong> <strong>St</strong>. <strong>Louis</strong><br />
M INERAL PRODUCTS<br />
Cement<br />
Clay Brick<br />
Year Barrels Value Year Per M Value<br />
1887....... 4,500 14,000 1887....... 88,500 154,3/o<br />
1888...... 4,200 13,500 1888....... 90,500 756,960<br />
1889___ 4,800 14,200 1889....... 94,300 758,418<br />
1890....... 4,500 13,600 1890....... 100,200 780,275<br />
1891___ 5,000 15,000 1891....... 98,800 761,460<br />
1892....... 5,200 15,600 1892....... 97,400 759,860<br />
1893____ 7,100 18,750 1893....... 103,900 801,750<br />
1894...... 8,000 21,600 1894...... 81,675 457,125<br />
1895 ...... 16,383 32,556 1895___ 131,772 672,360<br />
1896___ 9,500 28,250 1896....... 24,000 524,740<br />
1897..... 18,000 66,000 1897....... 97,468 563,240<br />
1898....... 50,000 150,000 1898........ 100,102 571,362<br />
1899....... 60,000 180,000 1899....... 125,950 /54,130<br />
1900...... 52,000 121,000 1900....... 137,191 905,210<br />
1901...... 71,800 159,842 1901....... 130,766 860,488<br />
1902___ 171,000 423,600 1902....... 169,851 1,306,215<br />
1903...... 640,868 968,727 1903....... 214,403 1,999,546<br />
1904___ 969,538 1,539,807 1904....... 281,750 1,994,740<br />
1905....... 1,265,553 1,791,916 1905....... 286,618 2,273,786<br />
1906..... . 1,286,720 1,941,250 1906....... 277,672 2,538,848<br />
1907....... 1,631,563 2,585,577 1907....... 362,167 3,438,951<br />
1908....... 1,629,615 2,359,692 1908....... 332,872 2,506,495<br />
1909...... 3,779,205 4,969,437 1909....... 333,846 3,059,929<br />
1910....... 5,453,193 7,485,715 1910...... 340,883 2,934,731<br />
1911...... 6,371,369 9,085,625 1911...... 327,474 2,638,121<br />
1912..... 10,500,000<br />
Mineral Water<br />
Marble<br />
Year Gallons Aralue Year Cubic Feet Value<br />
1887....... 618,162 144,368 1887 ...... 2,790 5,000<br />
1888....... 1,112,202 252,990 1888....... 6,972 15,500<br />
1889....... 808,625 251,241 1889....... 32,970 87,030<br />
1890....... 258,722 89,786 1890....... 31,625 80,000<br />
1891.....- 334,553 135,959 1891....... 37,490 100,000<br />
1892....... 331,875 162,019 1892....... 40,310 115,000<br />
1893...... 383,179 90,667 1893..... 18,620 40,000<br />
1894___ 402,275 184,481 1894....... 38,441 98,326<br />
1895....... 701,397 291,500 1895 ..... 14,864 56,566<br />
1896...... 808,843 337,434 1896....... 7,889 32,415<br />
1897....... 1,508,192 345,863 1897....... 4,102 7,280<br />
1898....... 1,429,809 213,817 1898....... 8,050 23,594<br />
1899....... 1,338,537 406,691 1899....... 9,682 10,550<br />
1900....... 2,456,115 268,607 1900...... 4,103 5,891<br />
1901....... 1,555,328 559,057 1901....... 2,945 4,630<br />
1902....... 1,701,142 621,477 1902....... 19,305 37,616<br />
1903....... 2,056,340 558,201 1903....... 84,624 97,354<br />
1904....... 2,430,320 496,946 1904....... 55,401 94,208<br />
1905....... 2,194,150 538,700 1905....... 73,303 129,450<br />
1906..... 1,585,690 478,186 1906.... 31,400 75,800<br />
1907....... 2,924,269 544,016 I9D7....... 37,512 118,066<br />
1908....... 2,789,715 560,507 1908....... 18,653 47,665<br />
1909___ 2,449,834 465,488 1909....... 79,(i00 238,400<br />
1910....... 2,335,259 522,009 1910....... 18,960 50,200<br />
1911 2,(537,669 590,654 1911 20,201 54,103<br />
66
Digitized for FRASER<br />
http://fraser.stlouisfed.org/<br />
<strong>Federal</strong> <strong>Reserve</strong> <strong>Bank</strong> <strong>of</strong> <strong>St</strong>. <strong>Louis</strong><br />
MINERAL PRODUCTS<br />
Lead<br />
Lime and Limestone<br />
Year Tons Y alue Year Value<br />
1887....... 580 $52,200 1887.............................. $368,750<br />
1888....... 450 38,250 1888.............................. 381,750<br />
1889....... 470 35,720 1889.................... ..... 416,780<br />
1890....... 400 36,000 1890............................ 350,000<br />
1891....... 570 49,020 1891..................... ....... 300,000<br />
1892...... 680 54,400 1892______ 300,000.<br />
1893....... 333 24,975 1893.............................. 301,276<br />
1894....... 475 28,500 1894.............................. 337,975<br />
1895'..... 796 49,364 1895.............................. 457,784<br />
1896....... 646 38,805 1896 ....................... 332,617<br />
1897....... 298 20,264 . 1897.............................. 291,456<br />
1898....... 328 23,907 1898 ................ 278,558<br />
1899....... 360 30,642 1899.............................. 343,760<br />
1900....... , 520 41,600 1900.............................. 315,231<br />
1901....... 360 28,820 1901.............................. 434,133<br />
1902....... 175 12,230 1902................... .......... 460,140<br />
1903....... 55 3,960 1903 ................ 592,268<br />
1904....... 62 5,270 1904.................... ......... 658,956<br />
1905....... 266 25,083 1905 ................ 878,647<br />
1906....... 169 19,307 1906.............................. 925,887<br />
1907....... 164 16,690 1907 ..................... 1,162,417<br />
1908....... 562 46,663 1998 .............. ....... 676,507<br />
1909....... 1,343 144,897 1909 ........ 997,745<br />
1910....... 1,508 134,082 1910.............................. 1,058,891<br />
1911 - ... 702 0-;,173> 1911 843,786<br />
1912............................. 750,000<br />
Granite<br />
All Minerals<br />
Year Value Year Total Value<br />
1887...'........................ $ 150,000 1887 $19,785,868<br />
1888................................ 57,000 1888......................... .... 19,469,320<br />
1889........................... . 1,329,018 1889 16,681,731<br />
1890................ .... .......... 1,200,000 1890..................... ........ 18,039,666<br />
1891........................... . 1,300,000 1891 18,872,413<br />
1892................................ 1,000,000 1892.............................. 18,300,168<br />
1893.............................. 531,322 1893 18,811,261<br />
is*. U....................... ........ 228,816 1894........ ............... 20,203,294<br />
1895................... ......... 224,329 1895............ ....... ......... 22,844,663<br />
1896..................... .......... 201,004 1896 ................ 24,291,398<br />
1897.................... .......... . 188,024 1897............ ...... ........ . 25,142,441<br />
1898........................ ....... 147,732 1898...................... .. 27,289,079<br />
1899............................ . 141,070 1899 29,313,460<br />
1900..................... ........ 295,772 1900..____ ___ _______ 32,622,945<br />
1901.................... ...... . 519,285 1901.................... ......... 34,355,981<br />
1902........... .......... .... 255,239 1902.___ ___ _______ 35,069,105<br />
1903.................... ....... . 678,670 1903............ ....... ...... 37,759,040<br />
•1904.......... ........... ....... 467,472 1904............... ........ ..... •43,778,348<br />
1905.................. ........... 353,837 1905___ _______ _____ 43,069,227<br />
1906... ............... ....... 344,083 1906................. ....... .. 46,776,085<br />
19.17............................... 373,376 1907................... ..... 55,697,949<br />
1908................................ 512,923 1908.............................. 66,363,198<br />
1909................................ 376,834 1909........ ............... ... 81,017,552<br />
1910............................... 417,898 1910.............................. 88,419,079<br />
1911................................ 355,742 1911.............................. *87,497,879<br />
’ A sp h a lt a m o u n tin g to $2,'250,000 in lu ll n o t in c u ded as in all p reviou s years<br />
67
Digitized for FRASER<br />
http://fraser.stlouisfed.org/<br />
<strong>Federal</strong> <strong>Reserve</strong> <strong>Bank</strong> <strong>of</strong> <strong>St</strong>. <strong>Louis</strong><br />
BUTTER, EGGS, CHEESE— 1912<br />
BUTTER EGGS CHEESE<br />
Mo.<br />
Lbs.<br />
Receipts<br />
Extras<br />
Doz.<br />
Extras<br />
Lbs.<br />
Fancy<br />
High Low Receipts High Low Receipts High Low<br />
Jan ... 1,380,700 36* 33* 1,207,720 36* 28 549,000 17 15<br />
Feb ... 1,414,900 36* 32 2,075,040 31 20 665,700 17* 15*<br />
Mch... 1,826,700 33 30 2,410,200 22 20 662,400 19* 17*<br />
A pril. 2,480,300 29* 24 2,307,832 22 20* 1,050,400 18 14<br />
May... 2,505,100 26* 24 2,376,210 21 20 1,258,800 14 13<br />
June.. 2,526,000 30 26 1,813,252 24 21 1,721,300 14 13*<br />
July... 2,844,200 29 26* 1,778,290 26 24 1,351,400 14* 14<br />
.^ug... 2,368,300 33* 29 1,359,990 30* 25 1,440,800 14* 14<br />
Sept... 1,958,500 35 32* 1,013,734 41* 31 831,300 16 14<br />
O ct.... 2,035,900 35* 32* 954,820 52* 35 956,000 18 16<br />
N ov... 1,819,900 33* 32* 849,660 53 43* 700,500 19 17*<br />
D e c ... 1,696,500 35 32* 1,019,950 40* 27 757,800 17*' 14*<br />
Total.. 24,887,000 19,166,698 11,945,400<br />
1912.... 24,887,000 19,166,698 11,945,400<br />
1911.... 21,118,350 17,613,442 9,630,680
Digitized for FRASER<br />
http://fraser.stlouisfed.org/<br />
<strong>Federal</strong> <strong>Reserve</strong> <strong>Bank</strong> <strong>of</strong> <strong>St</strong>. <strong>Louis</strong><br />
NORMAL CLIMATOLOGICAL DATA FOR SAN FRANCISCO, CALI<br />
FORNIA FOR FORTY-ONE YEARS<br />
Compiled by the United <strong>St</strong>ates Weather Bureau.<br />
d<br />
s3 a><br />
M arch<br />
A p ril<br />
M ay<br />
June<br />
July<br />
A ug.<br />
Sept.<br />
-4-> O<br />
O<br />
N ov.<br />
Dec.<br />
Tem perature<br />
M ean fo r M on th .... 50° 52° 54° 55° 57° 59° 59° 59° 61° 60° 56° 52c<br />
H ig h est m e a n ..... )<br />
Y e a r......................... )<br />
55°<br />
1873<br />
57°<br />
1886<br />
58°<br />
1885<br />
59°<br />
1880<br />
60°<br />
1890<br />
62°<br />
1888<br />
62°<br />
1885<br />
63°<br />
1894<br />
65°<br />
1889<br />
64°<br />
1887<br />
59°<br />
1894<br />
54°<br />
1885<br />
L o w e s t m e a n ?<br />
Y ea r......................... J<br />
H ig h e s t ..................1<br />
D a te a n d Y e a r.... C<br />
46°<br />
1890<br />
78°<br />
26th<br />
1889<br />
48°<br />
1887<br />
80°<br />
18th<br />
1899<br />
49°<br />
1897<br />
80°<br />
7th<br />
1892<br />
52°<br />
1896<br />
88°<br />
14th<br />
1888<br />
53°<br />
1898<br />
97°<br />
28th<br />
1887<br />
56°<br />
1894<br />
100°<br />
29th<br />
1891<br />
56°<br />
1901<br />
98°<br />
7th<br />
1905<br />
56°<br />
1891<br />
92°<br />
22d<br />
1891<br />
58°<br />
1899<br />
101°<br />
8th<br />
1904<br />
57°<br />
1881<br />
94°<br />
8th<br />
1899<br />
53°<br />
1897<br />
83°<br />
16th<br />
1895<br />
49°<br />
1895<br />
72°<br />
8th<br />
1893<br />
L o w e s t ...................1<br />
D ate a n d Y e a r.... C<br />
P recip itation<br />
29°<br />
15th<br />
1888<br />
33°<br />
5th<br />
1887<br />
33°<br />
3d<br />
1896<br />
40°<br />
7th<br />
1891<br />
42°<br />
16th<br />
1906<br />
46°<br />
4th<br />
1908<br />
47°<br />
31st<br />
1893<br />
46°<br />
8th<br />
1903<br />
48°<br />
30th<br />
1906<br />
45°<br />
14th<br />
1881<br />
38°<br />
27th<br />
1896<br />
34°<br />
24th<br />
1879<br />
M ean fo r M o n th ..., 4.53 3.50 3.05 1.85 0.76 0.21 0.02 0.01 0.31 0.31 2.72 4.44<br />
G reatest fa ll.........)<br />
Y e a r.........................j<br />
24.36 12.52<br />
1862 1878<br />
8.75<br />
1879<br />
10.06<br />
1880<br />
3.52<br />
1883<br />
2.57<br />
1884<br />
0.23<br />
1886<br />
0.21<br />
1864<br />
5.07<br />
1904<br />
7.28<br />
1889<br />
11.78 15.16<br />
1885 1866<br />
L ow est f a l l ...........)<br />
Y e a r........................ }<br />
0.58<br />
1852<br />
0.00<br />
1864<br />
0.25<br />
1898<br />
0.00<br />
1857<br />
0.00<br />
*<br />
0.00<br />
*<br />
0.00<br />
*<br />
0.00<br />
*<br />
0.00<br />
*<br />
0.00 0.00<br />
1890<br />
0.00<br />
1876<br />
G rea test ra in fa ll 1<br />
in 24 h ou rs, d ate j-<br />
a n d y e a r ..............<br />
A v e ra g e N o. d a y s )<br />
w ith .01 o f a n in . [-<br />
o r m o r e ................ )<br />
Clouds & Weather<br />
4.67<br />
29th<br />
1881<br />
3.60<br />
4th&<br />
5th<br />
1887<br />
3.61<br />
4th&<br />
5th<br />
1879<br />
2.43<br />
23d &<br />
24th<br />
1896<br />
1.29<br />
4th &<br />
5th<br />
1889<br />
1.23<br />
llth &<br />
12th<br />
1884<br />
0.23 0.06 3.09<br />
29th&<br />
16th<br />
23d<br />
30th<br />
1886 1896 1904<br />
2.03<br />
17th&<br />
18th<br />
1889<br />
3.98 3.14<br />
18th-<br />
23d<br />
19th<br />
1874 1871<br />
11 10 10 7 4 2 1 0 2 4 7 11<br />
A v e ra g e N o. )<br />
C lear d a y s .......) 11 10 11 12 13 14 12 10 14 16 15 12<br />
A v e ra g e N o. )<br />
p a rtly c lo u d y [<br />
d a y s ...................)<br />
10 10 11 12 12 11- 14 15' 12 11 9 10<br />
A v e ra g e N o. )<br />
C lo u d y d a y s ... I 10 8 9 6 6 5 6 6 4 4 6 9<br />
W ind<br />
P re v a ilin g d ir e ct’n N SW W W W W SW SW W W W SE<br />
H ig h est v e lo c ity .'!<br />
D ir e c tio n ........"...... !<br />
D a te......................... [<br />
Y e a r ........................ J<br />
57<br />
SE<br />
3d<br />
1901<br />
49<br />
S<br />
25th<br />
1902<br />
60<br />
S<br />
1st<br />
1902<br />
47<br />
N W<br />
23d<br />
1871<br />
45<br />
W<br />
11th<br />
1897<br />
48<br />
SW<br />
30th<br />
1873<br />
41<br />
W<br />
15th<br />
1898<br />
42<br />
SW<br />
2d<br />
1893<br />
40<br />
W<br />
27th<br />
1899<br />
44<br />
N E<br />
20th<br />
1906<br />
64<br />
NE<br />
30th<br />
1906<br />
60<br />
SE<br />
23d<br />
1892<br />
* M a n y years.<br />
* FROSTS<br />
Average date <strong>of</strong> first “ K illing” in autumn, December 10th.<br />
Average date <strong>of</strong> last “ K illing” in spring, January 25th.<br />
69
RAIN FALL IN SAN FRANCISCO.<br />
Compiled by U. S. Weather Bureau.<br />
S T A T IO N S .<br />
J u ly .<br />
A u g .<br />
S ept.<br />
O ct.<br />
N ov.<br />
Dec.<br />
T o ta l<br />
6 M os.<br />
Jan .<br />
4 ®ft<br />
M ar.<br />
p.<br />
M a y.<br />
June.<br />
T o ta l<br />
6 M os.<br />
T o ta l<br />
S eason .<br />
1849-50_________________ 3.14 8.66 e ^ o k s .o o 8.34 1.77 4.53 .46 i s . i o ^ . i o<br />
1851-52__________________ .02 1.03 .21 2.12 7.10 10.48 .58 .14 6.68 .26 .32 7.98 18.46<br />
1852-53__________________ .80 5.31 L3.20 19.31 3.92 1.42 4.86 5.31; .38 15.95 35.26<br />
1853-54__________________ .04 .46 .12 2.28 2.32 5.22 3.88 8.04 3.51 3.12 .02 ~ 0 8 18.65 23.87<br />
1854-55__________________ .01 .15 2.43 .3.4 .87 3.80 3.67 4.77 4.64 5.00 1.88 19.96 23.76<br />
1855-56 ........................ .67 5.76 6.43 9.40 .50 1.60 2.94 .76 .03 15.23 21.66<br />
1856-57__________________ .02 .07 .45 2.79 3.75 7.08 2.45 8.59 1.62 .05 .12 12.83 19.91<br />
1857-58__________________ ’ 05 .93 3 .In 4.14 8.13 4.36] 1.83 5.55 "l~ 55 .34 .05 13.68 21.81<br />
1858-59_________________ 165 .1 6 ____ 2.74 .69 6.14 9.78 1.281 6.32 3.02 .27 1.55 _ 12.44 22.22<br />
1859-60_________ _______ _ .02 .03 .05 7.28 1.57 8.95 1.64 1.60 3.99 3.14 2.86 .09 13.32 22.27<br />
1860-61__________________ T21 _ .91 .58 6.16 7.86 2.47 3.72 4.08 .51 1.00 .08 11.88 19.73<br />
1861-62__________________ _ .02 _ 4.10 9.54 13.66 24.36 7.53 2.20 .73 .74 .05 35.61 49.27<br />
1862-63 . ^ .52 .15 2.35 3.02 3.63 3.19 2.06 1.61 .23 10.72 13.74<br />
1863-64__________________ .03 2.55 1.80 4.38 1.83 1.52 1.57 .78 5.70 10.08<br />
1864-65__________________ 721 .01 ".13 6.68 8.91 15.94 5.14 T 3 4 .74 .94 .63 _ 8.79 24.73<br />
1865-06__________________ .24 .26 4.19 .58 5.27 10.88 2.12 3.04 .12 1.46 .04 17.66 22.93<br />
1866-67__________________ _ __ .11 ____ 3.35 15.16 18.62 5.16 7.20 1.58 2.36 _ _ 16.30 34.92<br />
1807-68__________________ _ .04 .20 3.41 10.69 14.34 9.50 6.13 6.30 2.31 .03 .23 24.50 38.84<br />
18f>8-(i9. . . . . .15 1.18 4.34 5.67 6.35 3.90 3.14 2.19 .08 .02 15.68 21.35<br />
1869-70__________________ .12 1.29 1.19 4.31 6.91 3.89 4.78 2.00 1.53 .20 12.40 19.31<br />
1870-71_________ ________ _ .03 _ .43 3.38 3.84 3.07 3.76 1.31 1.89 .23 .01 10.27 14.11<br />
1871-72__________________ _ .02 _ .07 2.81 14.36 17.26 4.00 6.90 1.59 .81 .18 .04 13.52 30.78<br />
1872-73__________________ .01 .04 .11 2.79 5.9-5 8.90 1.58 3.94 .79 .43 _ .02 6.76 15.66<br />
1873-74__________________ .01 .03 _ .83 1.16 9.72 11.80 5.66 2.21 3.36 .90 .66 .14 12.93 24.73<br />
1874-75__________________ _ _ .02 2.69 6.55 .33 9.59 8.01 .32 1.30 .10 .22 1.02 10.97 20.56<br />
1875-76______ _____ ______ .24 7.27 4.15 11.66 7.55 4.92 5.49 1.29 .24 .04 19.53 31.19<br />
1876-77_________________ .01 .01 .38 3.36 .25 4.01 4.32 1.18 1.08 .26 .18 .01 7.03 11.04<br />
1877-78............................... .02 _ _ .65 1.57 ¥.66 4.90 LI. 97 12.52 4.56 1.06 .16 .01 30.28 35.18<br />
1878-79__________________ .01 T r .55 1.27 .57 .58 2.98 3.52 4.90 8.75 1.89 2.35 .05 21.46 24.44<br />
1879-80 __________ ______ .01 .02 T r .78 4.03 4.46 9.30 2.23 1.87 2.08 10.06 1.12 _ 17.36 26.66<br />
1880-81________________ _ _ .05 .33 12.33 12.71 8.69 4.65 .90 2.00 .22 .69 17.15 29.86<br />
1881-82__________________ .25 .54 1.94 3.85 6.58 1.68 2.96 3.45 1.22 .21 .04 9.56 16.14<br />
1882-83__________________ .26 2.66 4.18 2.01 9.11 1.92 1.04 3.01 1.51 3.52 .0! 11.01 20.12<br />
1883-84._______ _________ _ _ .42 1.48 1.60 .92 4.42 3.94 6.65 8.24 6.33 .23 2.57 27.96 32.38<br />
1884-85__________________ T r .04 .33 2.55 .26 7.68 10.86 2.53 .30 1.01 3.17 .04 .19 7.24 18.10<br />
1885-86 _________________ .06 T r .11 .72 11.78 4.99 17.66 7.42 .24 2.07 5.28 .37 .01 15.39 33.05<br />
1886-87— ______________ .23 T r .01 1.48 .84 2.07 4.63 1.90 9.24 .84 2.30 .06 .07 14.41 19.04<br />
1887-88. _____________ T r .01 .29 T r .99 3.34 4.63 6.81 .94 3.60 .11 .38 .27 12.11 IP. 74<br />
1888-89_________________ .01 .01 .98 .13 3.99 5.80|10.92 1.2S .72,7.78 .96,2.17 .03 12.94 23.86<br />
1889-90__________________ .01 T r T r 7.28 2.90 13.81124.00 9.61 5.16'4.73 1.18,1.07 .10 21.8r>45.85:<br />
1890-91__________________ .02 .31 _ __ 3.25 3.58 .98 7.26:1.96 2.44 1.25 .11 14.00117.58<br />
1891-92____________ _____ .10 •02 .77 .04 .56 5.62 7.11 2.42 2.90 2.85 1.39 1.86 T r 11.42 18 53<br />
1892-93__________________ _ .021.65 3.91 5.08)10.66 3.05 2.75 4.08 1.03 .15 .03 11.09j21.75<br />
1893-94____________ . .02 .21 .16 4.18 2.25 6.82 5.99 2.69 .60 .50 1.31 .56 11.65 18.47<br />
1894-95_________________ T r ___!1.05:i.73 .88 9.01 12.67 6.99 2.31 1.89 1.24 .60 13.03l25.70<br />
z 895-96_________________ .01 .77 .11 1.78 1.43 4.10 8.14 .28 2.85 5.16 .72 17.15i21.25<br />
1896-97______________ .04 .09 .5211.55 4.56 4.34 11.10 2.26 4.41 4.56 .27 .61 ~22 12.33 23.43<br />
1897-98. _______ ___ T r T r .10,1.70 1.05 1.22 4.07 1.12 2.13 .24 .19 1.44 .19 5.31 9.38<br />
1898-99__________________ T r 1.06 .86 .46 1.62 4.00 3.67 .10:7.61 .62 .86 .01 12.87116.87<br />
1899-1900_______________ _ T r _ 3.92 3.79 2.65 10.36 4.11 .64 1.91 1.08 .32 .05 8.11 18.47<br />
1900-01 _____ T r T r .46 1.48 3.91 1.37 7.22 5.79 5.03 .80' 1.64 .6!) T r 13.95 21.17<br />
1901-02 ____ . T r T r .781 .64 3.48 .90 5.89 1.23 7.27 2 .6 ' .98 1.05 T r 13.18 18.98<br />
1902-03____________ T r T r Tr|1.70 1.98 2.32 6.00 3.73 1.76 6.23- .56 T r T r 12.28 18.28<br />
1903-04____________ T r T r .17 4.25 1.63 6.05 1.05 5.89|6.01[ 1.29 .30 T r 14.54 20.59<br />
1904-05__________________ .02 .06 '>.07 2.37 1.07 1.59 10.18 4.04, 2.70 3.15 1.33 2.05 .00 13.27 23.45<br />
1905-06 ___________ T r T r T r .92 2.05 2.97 3.90 4.30 5.021 .92 2.75 .56 17.45 20.42<br />
1906-07__________________ .08 .11 .18 .03 1.59 6.30 8.89 4.41 3.02 8.42 .11 .04 1.2S 17.28 26.17<br />
1907-08__________________ T r .02 .11 1.36 .04 3.66 5.19 4.88 5.39 .90 .22 .76 .01 12.16 17.35<br />
1908-09 _________________ .02 .01 .13 .61 1.34 2.15 4.26 10.51 7.53 3.27' T r T r T r 21.31 25.57<br />
1909-10 _____ T r 0 .80 1.23 2.43 3.59 10.05 3.24 2.09 3.78 .31 .03 .02 9.47 19.53<br />
1910-11 T r 0 .0r .65 .48 1.73 2.91 13.79 3.02 4.57! .8° .28 .0- 22.58 ■25.49<br />
1850-51 _________________ _ .33 _ .92 1.05 2.30 .72; .54 1.941 1.23 .67 .02 5.12 7.42<br />
1911-12_________________ T r _ T r .28 .60 2.54 3.42,1 2.47: .41 1.1011.38 1.47 .81 10.64 14.06<br />
1912-13 _ _ _ T r 1.25 .49 1.94 1.30 4.98!<br />
~<br />
T r in d ica te s a tra ce o f p re cip ita tio n .<br />
70<br />
Digitized for FRASER<br />
http://fraser.stlouisfed.org/<br />
<strong>Federal</strong> <strong>Reserve</strong> <strong>Bank</strong> <strong>of</strong> <strong>St</strong>. <strong>Louis</strong>
Digitized for FRASER<br />
http://fraser.stlouisfed.org/<br />
<strong>Federal</strong> <strong>Reserve</strong> <strong>Bank</strong> <strong>of</strong> <strong>St</strong>. <strong>Louis</strong><br />
NORMAL CLIMATOLOGICAL DATA FOR SACRAMENTO, CALI<br />
FORNIA FOR FORTY-ONE YEARS<br />
Compiled by the United <strong>St</strong>ates Weather Bureau.<br />
Jan.<br />
F eb.<br />
M arch<br />
A p ril<br />
M ay<br />
June<br />
July<br />
A u g.<br />
Sept.<br />
O ct.<br />
N ov.<br />
D ec.<br />
Temperature<br />
M ean fo r M on th 46° 50° 55° 59° 64° 70° 74° 73° 70° 63° 54° 48<br />
H ig h est m e a n , , )<br />
Y e a r.........................)<br />
L ow est m ean )<br />
Y ea r......................... \<br />
H ig h e st.................. I<br />
Date a n d Y ea r.... f<br />
L o w e s t ................... 1<br />
D ate a n d Y ea r.... f<br />
53°<br />
1873<br />
42°<br />
1883<br />
72°<br />
30th<br />
1899<br />
19°<br />
14th<br />
1888<br />
55°<br />
1877<br />
46°<br />
1880<br />
76°<br />
28th<br />
1889<br />
21°<br />
13th<br />
1884<br />
60°<br />
1885<br />
49°<br />
1880<br />
80°<br />
30th<br />
1882<br />
29°<br />
15th<br />
1880<br />
63°<br />
1857<br />
53°<br />
1896<br />
89°<br />
24th<br />
1910<br />
35°<br />
4th<br />
1910<br />
70°<br />
1865<br />
58°<br />
1860<br />
103°<br />
30th<br />
1910<br />
39°<br />
9th<br />
1896<br />
77°<br />
1853<br />
65°<br />
1894<br />
106°<br />
30th<br />
1891<br />
44°<br />
1st<br />
1890<br />
81°<br />
1854<br />
69°<br />
1859<br />
110°<br />
8th<br />
1905<br />
47°<br />
3d<br />
1901<br />
77°<br />
1888<br />
66°<br />
1873<br />
76°<br />
1853<br />
65°<br />
1854<br />
110° 106°<br />
11th 11th<br />
1898 ■ 1888<br />
48°<br />
30th<br />
1887<br />
44°<br />
18th<br />
1882<br />
78°<br />
1853<br />
58°<br />
1881<br />
98°<br />
3d<br />
1885<br />
36°<br />
14th<br />
1881<br />
58°<br />
1894<br />
49°<br />
1880<br />
51°<br />
1861<br />
43°<br />
1890<br />
81° 69°<br />
5th 8,9th<br />
1898 1893<br />
27°<br />
28th<br />
1880<br />
24°<br />
14 th<br />
1883<br />
Precipitation<br />
M ean fo r M on th .... 3.83 2.80 2.85 1.74 0.80 0.12 0.03 0.01 0.18 0.76 2.09 4.37<br />
G reatest fa ll.........\<br />
Y e a r ........................)<br />
15.04<br />
18G2<br />
8.50 10.00<br />
1854 1850<br />
14.20<br />
1880<br />
3.25<br />
1889<br />
1.45<br />
1884<br />
0.63<br />
1860<br />
0.20<br />
1896<br />
3.62<br />
1904<br />
6.02<br />
1889<br />
11.34 13.40<br />
1885 1852<br />
L ow est f a l l ...........1<br />
Y e a r .........................)<br />
0.15<br />
1889<br />
0.04<br />
1899<br />
0.04<br />
1898<br />
T<br />
1875<br />
0.00 0.00<br />
*<br />
0.00<br />
*<br />
0.00 0.00 0.00 0.00<br />
1890<br />
0.00<br />
1876<br />
G reatest ra in fa ll 1<br />
in 24 h o a rs, d ate r<br />
a n d y e a r ..............<br />
2.06<br />
29th<br />
1881<br />
2.48<br />
4th&<br />
5th<br />
1887<br />
2.94<br />
8 th &<br />
9th<br />
1884<br />
7.24<br />
21st<br />
1880<br />
1.94<br />
5th<br />
1889<br />
0.82<br />
llth &<br />
12th<br />
1884<br />
0.04<br />
4th<br />
1895<br />
0.20<br />
30th<br />
1896<br />
2.15<br />
23d<br />
1904<br />
1.86<br />
21st &<br />
22d<br />
1889<br />
4.29<br />
17th &<br />
18th<br />
1885<br />
2.96<br />
2d<br />
1880<br />
A v era ge N o. d a y s )<br />
w ith 01 o f an in . >•<br />
o r m o r e ................ )<br />
9 8 5 6 4 1 0 0 2 3 5 10<br />
Cloud.s & Weather<br />
A v era ge N o. '[<br />
C lear days. , )<br />
A v era g e N o. j<br />
p a rtly C lou d y r<br />
d a y s ....................)<br />
A v era ge N o. )<br />
C lo u d y d a y s ... ><br />
12 12 14 15 20 24 29 29 25 22 19 11<br />
9 9 9 10 8 5 2 2 4 7 6 9<br />
10 7 8 5 3 1 0 0 1 2 5 11<br />
W ind<br />
P re v a ilin g d ir e ct’n SE SE SE S S S S s S SE SE SE<br />
H ig h est v e lo c ity<br />
D ir e c tio n ............. !<br />
D a t e ....................... [<br />
Y’ e a r ....................... J<br />
60<br />
SE<br />
3d<br />
1901<br />
60<br />
SE<br />
25th<br />
1902<br />
65<br />
SE<br />
10th<br />
1904<br />
46<br />
S<br />
7th<br />
1902<br />
48<br />
SE<br />
fith<br />
1912<br />
42<br />
N W<br />
12th<br />
1886<br />
40<br />
N W<br />
2d<br />
1903<br />
38<br />
sw<br />
9th<br />
1908<br />
40<br />
N W<br />
11th<br />
1903<br />
48<br />
S<br />
20th<br />
1894<br />
48<br />
S<br />
30th<br />
1892<br />
60<br />
SE<br />
9th<br />
1894<br />
* M a n y y ears'<br />
FROSTS<br />
Average date <strong>of</strong> first “ Killing” in autumn, November 15th.<br />
Average date <strong>of</strong> last “ Killing” in spring, February 16th.<br />
71
Digitized for FRASER<br />
http://fraser.stlouisfed.org/<br />
<strong>Federal</strong> <strong>Reserve</strong> <strong>Bank</strong> <strong>of</strong> <strong>St</strong>. <strong>Louis</strong><br />
NORMAL CLIMATOLOGICAL D ATA FOR RED BLUFF, CALI<br />
FORNIA FOR FORTY-ONE YEARS<br />
Compiled by the United <strong>St</strong>ates Weather Bureau.<br />
Temperature<br />
1<br />
Jan.<br />
F eb.<br />
M arch<br />
A p ril<br />
M ay<br />
June<br />
'3<br />
A ug.<br />
| Sept.<br />
Oct.<br />
N ov.<br />
J D ec.<br />
M ean fo r M on th .... 45° 49° 55° 59° 67° 75° 82° . 81° 73° 64° 54° 47°<br />
H igh est m ean . \<br />
Y e a r......................... J<br />
L ow est m ean ?<br />
Y e a r .........................5<br />
H ig h e s t ..................1<br />
D ate a n d Y e a r.... C<br />
L o w e s t ...................(<br />
D ate a n d Y ea r.... f<br />
50°<br />
1881<br />
39°<br />
1890<br />
77°<br />
27th<br />
1899<br />
18°<br />
14th<br />
1888<br />
54°<br />
1886<br />
43°<br />
1887<br />
82°<br />
25th<br />
1888<br />
22°<br />
14th<br />
1884<br />
61°<br />
1885 ; fe88<br />
48°<br />
1897<br />
86°<br />
9th<br />
1892<br />
28°<br />
16th<br />
1880<br />
52°<br />
1896<br />
96°<br />
24th<br />
1898<br />
34°<br />
15th<br />
1896<br />
73°<br />
1897<br />
60°<br />
1899<br />
110°<br />
29th<br />
1887<br />
37°<br />
7th<br />
1879<br />
81°<br />
1878<br />
69°<br />
1894<br />
110°<br />
30th<br />
1891<br />
44°<br />
1st<br />
1898<br />
86°<br />
1887<br />
78°<br />
1884<br />
115°<br />
8th<br />
1887<br />
53°<br />
1st<br />
1881<br />
84°<br />
1885<br />
74°<br />
1889<br />
114°<br />
22d<br />
1891<br />
. 52°<br />
27 th<br />
1881<br />
81°<br />
1888<br />
60°<br />
1882<br />
108°<br />
1st<br />
1891<br />
46°<br />
12th<br />
1893<br />
71°<br />
1887<br />
56°<br />
1881<br />
97°<br />
5th<br />
1892<br />
32°<br />
14th<br />
1881<br />
59°<br />
1894<br />
50°<br />
1897<br />
88°<br />
3d<br />
1890<br />
26°<br />
30th<br />
1880<br />
50°<br />
1886<br />
42°<br />
1891<br />
79°<br />
5th<br />
1885<br />
25°<br />
13th<br />
1884<br />
P recipitation<br />
M ean fo r M on th .... 4.74 3.57 3.19 2.06 1.34 0.50 0.02 0.04 0.63 1.30 2.95 5.40<br />
G reatest fa ll.........<br />
Y e a r ........................ $ 20.71 16.66 12.84<br />
1878 1878 1906<br />
L ow est f a l l ...........}<br />
Y e a r .........................)<br />
G reatest r a in fa ll 1<br />
in 24 hours, date f-<br />
a n d y e a r ..............J<br />
A v era g e N o. d a y s )<br />
w it h .01 o f an in . ><br />
o r m o r e ................ )<br />
Clouds & Weather<br />
0.51<br />
1887<br />
5.11<br />
16th<br />
1878<br />
0.01<br />
1899<br />
4.12<br />
2d &<br />
3d<br />
1909<br />
T<br />
1885<br />
2.17<br />
9th<br />
1884<br />
7.05<br />
1880<br />
0.03<br />
1909<br />
2.03<br />
20th<br />
1880<br />
3.11<br />
1906<br />
0.18<br />
.1884<br />
1.67<br />
9th &<br />
10th<br />
1890<br />
2.61<br />
1880<br />
0.00<br />
*<br />
0.84<br />
3d &<br />
4th<br />
1888<br />
0.17<br />
1891<br />
0.54<br />
1896<br />
0.00 0.00<br />
*<br />
4.86<br />
1904<br />
0.10 0.54 3.86<br />
29th&<br />
9th<br />
23d<br />
30th<br />
1891 1896 1904<br />
8.41<br />
1889<br />
0.00 0.00<br />
1887<br />
1.70<br />
20th<br />
1889<br />
17.05 12.85<br />
1885 1880<br />
0.00<br />
1890<br />
4.73<br />
9th &<br />
10th<br />
1885<br />
11 9 11 9 6 3 1 2 2 6 6 11<br />
0.52<br />
1883<br />
5.09<br />
19th<br />
1879<br />
A v e ra g e N o. ?<br />
C lear d a y s.........3<br />
A v e ra g e N o. )<br />
p a rtly c lo u d y ><br />
d a y s ....................)<br />
13 13 9 13 16 22 28 29 25 20 17 11<br />
9 9 11 11 10 6 3 2 4 8 7 9<br />
A v era g e N o. 1<br />
C lo u d y d ays ... ) 9 7 11 6 5 2 0 0 1 3 6 11<br />
W ind<br />
P revailin g d ir e ct’n N N N S S S S S N W N N N<br />
H ig h e st v elocity "!<br />
D ir e c tio n ............... 1<br />
D a t e ........................ (<br />
Y ea r.........................J<br />
60<br />
N<br />
9th<br />
1880<br />
52<br />
N<br />
18th<br />
1880<br />
42<br />
S<br />
9th<br />
1884<br />
48<br />
NW<br />
15th<br />
1880<br />
40<br />
S<br />
6th<br />
1889<br />
42<br />
S<br />
14th<br />
1888<br />
36<br />
S<br />
8th<br />
1887<br />
26<br />
S<br />
31st<br />
1889<br />
40<br />
N<br />
30th<br />
1882<br />
46<br />
N<br />
14th<br />
1878<br />
44<br />
N<br />
27th<br />
1885<br />
52<br />
N<br />
19th<br />
1879<br />
* M any years.<br />
FROSTS<br />
Average date <strong>of</strong> first “ Killing” in autumn, November 20th.<br />
Average date <strong>of</strong> last “ Killing” in spring, March 15th.
Digitized for FRASER<br />
http://fraser.stlouisfed.org/<br />
<strong>Federal</strong> <strong>Reserve</strong> <strong>Bank</strong> <strong>of</strong> <strong>St</strong>. <strong>Louis</strong><br />
NORMAL CLIMATOLOGrlCAL DATA FOR FRESNO, CALIFORNIA,<br />
FOR TW ENTY YEARS<br />
Compiled by the United <strong>St</strong>ates Weather Bureau.<br />
Jan.<br />
Feb.<br />
M arch<br />
A p ril<br />
M ay<br />
June<br />
July<br />
A u g.<br />
Sept.<br />
Oct.<br />
N o v .<br />
D ec.<br />
Tem perature<br />
M ean fo r M on th ... 45° 51° 54° 61° 67° 75° 82° 81° 74° 63° 55° 46°<br />
H ig h est m ea n ?<br />
Y e a r ......................... J<br />
L ow est m ean \<br />
Y e a r ......................... j<br />
H ig h e st..................<br />
D ate a n d Y e a r.... C<br />
L o w e s t ................... (<br />
D ate a n d Y e a r.... C<br />
Precip itation<br />
51°<br />
1896<br />
42°<br />
1898<br />
72°<br />
8th<br />
1911<br />
20°<br />
1st<br />
1888<br />
55°<br />
1906<br />
47°<br />
1890<br />
83°<br />
26th<br />
1888<br />
24°<br />
6th<br />
1899<br />
60°<br />
1910<br />
49°<br />
1897<br />
87°<br />
31st<br />
1900<br />
28°<br />
1st<br />
1888<br />
67°<br />
1888<br />
55°<br />
1896<br />
101°<br />
25th<br />
1898<br />
34°<br />
5th<br />
1895<br />
72°<br />
1897<br />
63°<br />
1899<br />
110°<br />
31st<br />
1910<br />
38°<br />
1st<br />
1899<br />
80°<br />
. 1889<br />
69°<br />
1894<br />
112°<br />
30th<br />
1891<br />
42°<br />
14th<br />
1907<br />
86°<br />
1906<br />
79°<br />
1895<br />
115°<br />
8th<br />
1905<br />
51°<br />
8th<br />
1891<br />
86°<br />
1888<br />
75°<br />
1899<br />
113°<br />
11th<br />
1898<br />
50°<br />
31st<br />
1887<br />
83°<br />
1888<br />
68°<br />
1893<br />
111°<br />
24th<br />
1888<br />
44°<br />
22d<br />
1895<br />
69°<br />
1888<br />
60°<br />
1899<br />
100°<br />
3d<br />
1887<br />
36°<br />
17th<br />
1892<br />
59°<br />
1894<br />
51°<br />
1906<br />
84°<br />
4th<br />
1908<br />
27°<br />
25th<br />
1898<br />
M ean fo r M o n th .... 1.76 1.35 1.69 0.63 0.58 0.10 T 0.01 0.29 0.65 0.99 1.60<br />
49°<br />
1896<br />
44°<br />
1895<br />
74°<br />
2d<br />
1907<br />
23°<br />
21st<br />
1897<br />
G reatest fa ll.........)<br />
Y e a r......................... )<br />
4.44<br />
1909<br />
4.35<br />
1884<br />
4.22<br />
1893<br />
3.42<br />
1884<br />
1.69<br />
1884<br />
1.16<br />
1893<br />
0.07<br />
1896<br />
0.15<br />
1896<br />
1.78<br />
1904<br />
3.21<br />
1904<br />
9.54<br />
1885<br />
4.09<br />
1894<br />
L o w e st f a l l ...........1<br />
Y e a r......................... S<br />
0.34<br />
1889<br />
0.00<br />
1885<br />
0.17<br />
1887<br />
0.00<br />
1898<br />
0.00<br />
1897<br />
0.00 0.00<br />
*<br />
0.00<br />
*<br />
0.00 0.00<br />
1890<br />
0.08<br />
1884<br />
0.33<br />
1900<br />
G reatest r a in fa ll!<br />
1.46<br />
in 24 h ou rs, d ate j*<br />
4th&<br />
a n d y e a r .............. J<br />
5th<br />
1895<br />
A v e ra g e N o. d a y s )<br />
w ith .01 o f a n in. !•<br />
or m o r e ................ ;<br />
Clouds & Weather<br />
1.48<br />
9th<br />
1893<br />
1.22<br />
20th<br />
1893<br />
1.68<br />
24th<br />
1896<br />
1.02<br />
7 th<br />
1905<br />
0.74<br />
5th<br />
1894<br />
0.06<br />
25th<br />
1896<br />
0.15<br />
30th<br />
1896<br />
1.12<br />
29th<br />
1890<br />
2.38<br />
6th<br />
1904<br />
1.33<br />
16th<br />
1888<br />
2.10<br />
29th-<br />
30th<br />
1891<br />
8 6 8 3 3 1 ' 0 0 1 3 4 9<br />
A v e ra g e N o. ^<br />
C lear d a y s.......5<br />
A v e ra g e N o .........)<br />
p a rtly c lo u d y [<br />
d a y s .................. )<br />
A v e ra g e N o. 1<br />
C lo u d y d a y s... 3<br />
9 15 13 . 19 21 26 29 25 25 20 17 9<br />
8 7 10 8 7 3 2 6 3 7 7 9<br />
14 6 8 3 3 1 0 0 2 4 6 13<br />
W ind<br />
P revailin g d ir e ct’n N W N W N W N W N W NW N W N W W N W NW N W<br />
H ig h est v e lo c ity .')<br />
D ir e c tio n ...............I<br />
D a t e ........................ f<br />
Y ea r.........................J<br />
32<br />
N W<br />
16th<br />
1895<br />
30<br />
N W<br />
10th<br />
1894<br />
38<br />
SE<br />
2d<br />
1896<br />
34<br />
N W<br />
15th<br />
1906<br />
36<br />
W<br />
18th<br />
1902<br />
30<br />
N W<br />
17th<br />
1891<br />
24<br />
E<br />
4th<br />
1896<br />
24<br />
N<br />
4th<br />
1891<br />
32<br />
N W<br />
23d<br />
1906<br />
25<br />
W<br />
16th<br />
1892<br />
30<br />
W<br />
30th<br />
1892<br />
25<br />
N W<br />
29th<br />
1887<br />
* M a n y years.<br />
FROSTS<br />
Average date <strong>of</strong> first “ Killing” in autumn, December 1st.<br />
Average date <strong>of</strong> last “ Killing” in spring, March 19th.<br />
73
Digitized for FRASER<br />
http://fraser.stlouisfed.org/<br />
<strong>Federal</strong> <strong>Reserve</strong> <strong>Bank</strong> <strong>of</strong> <strong>St</strong>. <strong>Louis</strong><br />
NORMAL CLIMATOLOGICAL DATA FOE LOS ANGELES, CALI<br />
FORNIA FOR TH IRTY-FIVE YEARS<br />
Compiled by the United <strong>St</strong>ates Weather Bureau.<br />
1<br />
Jan.<br />
Feb.<br />
M arch<br />
A p ril<br />
June<br />
July<br />
A ug.<br />
Sept.<br />
Oct.<br />
N ov.<br />
£ 0)<br />
fi<br />
Temperature<br />
M ean fo r M on th .... 54° 55° 57° 60° 63° 67° 71° 71° 70° 64° 60° 56°<br />
H ig h est m ean.. 1<br />
Y e a r.........................)<br />
L ow est m ean \<br />
Y e a r .........................\<br />
H ig h e st..................)<br />
Date a n d Y ea r j<br />
L o w e s t ...................(<br />
D ate a n d Y ea r.... C<br />
58°<br />
1896<br />
49°<br />
1890<br />
87°<br />
9th<br />
1896<br />
30°<br />
29th<br />
1880<br />
60°<br />
1896<br />
51°<br />
1888<br />
88°<br />
16th<br />
1896<br />
28°<br />
6th<br />
1883<br />
62°<br />
1885<br />
52°<br />
1880<br />
99°<br />
29th<br />
1879<br />
31°<br />
9th<br />
1893<br />
64°<br />
1910<br />
56°<br />
1896<br />
100°<br />
23d<br />
1910<br />
36°<br />
28th<br />
1901<br />
66°<br />
1885<br />
60°<br />
1894<br />
103°<br />
25th<br />
1896<br />
40°<br />
16th<br />
1883<br />
71°<br />
1883<br />
63°<br />
1894<br />
105°<br />
7th<br />
1890<br />
46°<br />
13th<br />
1894<br />
74°<br />
1891<br />
65°<br />
1880<br />
109°<br />
25th<br />
1891<br />
49°<br />
12th<br />
1888<br />
75°<br />
1885<br />
68°<br />
1900<br />
106°<br />
19th<br />
1885<br />
49°<br />
30th<br />
1901<br />
74°<br />
1888<br />
60°<br />
1880<br />
108°<br />
21st<br />
1885<br />
44°<br />
23d<br />
1880<br />
68°<br />
1890<br />
60°<br />
1886<br />
102°<br />
3d<br />
1885<br />
40°<br />
22d<br />
1892<br />
66°<br />
1890<br />
56°<br />
1880<br />
96°<br />
3d<br />
1890<br />
61°<br />
1890<br />
53°<br />
1891<br />
89°<br />
29th<br />
1897<br />
34° 30°<br />
19th 14th<br />
1886 18/8<br />
Precipitation<br />
M ean fo r M on th .... 2.90 3.09 2.85 1.17 0.47 0.08 0.02 0.04 0.05 0.80 1.26 3.53<br />
G reatest fa ll.........?<br />
Y e a r ........................)<br />
L ow est f a l l ...........)<br />
Y e a r .........................)<br />
G reatest r a in fa lll<br />
in 24 hours, d ate j-<br />
a n d y e a r..............<br />
A v era g e N o. d a y s )<br />
w ith .01 o f a n in . >•<br />
or m o r e ................)<br />
Clouds &■ W eather<br />
7.83 13.37 12.36<br />
1890 1884 1884<br />
0.20<br />
1887<br />
4.17<br />
25th-<br />
26th<br />
1890<br />
T 0.01<br />
1885<br />
3.94<br />
14 th-<br />
15th<br />
1887<br />
3.18<br />
3d &<br />
4th<br />
1884<br />
5.06<br />
1880<br />
T<br />
1909<br />
2.20<br />
9th &<br />
10th<br />
1884<br />
2.06<br />
1892<br />
0.00<br />
1886<br />
1.76<br />
2d &<br />
3d<br />
1892<br />
1.39<br />
1884<br />
0.00<br />
*<br />
0.87<br />
13th<br />
1884<br />
0.24<br />
1886<br />
0.00<br />
*<br />
0.24<br />
14th<br />
1886<br />
0.28<br />
1889<br />
1.23<br />
1911<br />
6.95<br />
1889<br />
0.00 0.00 0.00<br />
1891<br />
0.61<br />
31st<br />
1889<br />
0.71<br />
30th<br />
1894<br />
3.62<br />
21st<br />
1889<br />
6.53 15.80<br />
1900 188 J<br />
0.00 T<br />
1900<br />
3.75 4.30<br />
28 th & 11th-<br />
29th 12th<br />
1892 1889<br />
6 6 7 6 3 1 0 0 0 3 3 7<br />
A v era g e N o. ?<br />
C lear d a y s.........)<br />
A v era g e N o. )<br />
p a rtly C lou d y >•<br />
d a y s .................... )<br />
A v era g e N o ..........?<br />
C lou d y d a y s.....)<br />
17 14 12 11 11 10 12 14 17 18 19 17<br />
8 9 12 12 14 17 18 16 12 10 8 9<br />
6 5 7 7 6 3 1 1 1 3 3 5<br />
W ind<br />
P revailin g d ir e ct’n NE NE W W W ' ' W W W W W W NE<br />
H ig h est v e lo c it y !<br />
D ir e c tio n ............... 1<br />
D a t e ........................ j<br />
Y e a r.........................j<br />
48<br />
NE<br />
8th<br />
1882<br />
42<br />
W<br />
23d<br />
1912<br />
46<br />
SW<br />
12th<br />
1881<br />
42<br />
W<br />
12th<br />
1883<br />
36<br />
N W<br />
1st<br />
1904<br />
34<br />
SW<br />
14th<br />
1907<br />
25<br />
W<br />
14 th<br />
1894<br />
24<br />
NE<br />
13th<br />
1904<br />
38<br />
S<br />
22d<br />
1908<br />
34<br />
N E<br />
7th<br />
1887<br />
43<br />
NE<br />
9th<br />
1881<br />
38<br />
W<br />
8th<br />
1911<br />
*Many yeais.<br />
FROSTS<br />
Average date <strong>of</strong> first “ Killing” in autumn none reported.<br />
Average date <strong>of</strong> last “ Killing” in spring, March 19th.<br />
74
Digitized for FRASER<br />
http://fraser.stlouisfed.org/<br />
<strong>Federal</strong> <strong>Reserve</strong> <strong>Bank</strong> <strong>of</strong> <strong>St</strong>. <strong>Louis</strong><br />
MONTHLY AND SEASONAL PRECIPITATION AT CERTAIN<br />
STATIONS IN CALIFORNIA DURING SEASON OF 1912-1913.<br />
STATIO N S<br />
Compiled by United <strong>St</strong>ates Weather Bureau<br />
July<br />
fee<br />
<<br />
Sept.<br />
Oct,<br />
E x t r e m e N o r t h e r n<br />
C o u n t ie s :<br />
E u r e k a _______________ 10.17 5.73 4.73 5.92 1.98 1.29i .05 -.08 2.40 1.55 6.86 5.83 46.59<br />
M o n t a g u e ____________ 1.31 .79| 1.87 1.46 2.45 1.68 .07 .34 2.30 .54 2.35 1.13 16.29<br />
A lt u r a s ______ ______ .99 .38 1.53 2.71 1.07 .90 .64 .53 .87 .24 .59 .58 11.03<br />
S a c r a m e n t o V a lle y :<br />
R e d d i n g _____ __ 7.20 2.03 6.78 4.96 2.85 1.51 .02 0 3.62 1.41 5.73 2.73 38.84<br />
C h ic o ________________ 3.27 .69 3.70 2.14 1.80 .12 T r 0 4.84 1.23 3.14 1.02121.95<br />
W i llo w s _______________ 1.95 .26 4.54 1.86 1.16! .19 T r 0 3.37 .48 1.83 .42 16.06<br />
M a r y s v ille __________ 2.781 .62 3.06 1.85 1..15I .32 0 0 2.40 .75 1.78 .75 15.46<br />
S a c r a m e n t o _ ______ 2.74 .23! 1.97 1.69 .94 .58 0 0 1.25 .58 .80 .23 11.01<br />
D a v is v ille _____________ 2.08 .20 2.65 1.37 a .12 .74 0! 0 1.22 .25 1.08 .33 11.04<br />
V a c a v ille ____________ 2.73 .31 3.66 1.83 1.43; 0<br />
0 1.11 .47 3.69 .95 16.18<br />
0<br />
N o r t h e r n C o a s t V a l<br />
le y :<br />
U k ia h _________________ 5.73 1.73 5.44 3.81 1.78; .44 0 0 2.93 1.89 7.05 5.45 36.25<br />
S a n ta R o s a __________ 3.39 1.09 4.69 1.54 2-88! 1.14 0 0 2.99 1.47 5.11 1.78 26.08<br />
N ov.<br />
D e c .<br />
Jan.<br />
Feb.<br />
M arch<br />
A p ril<br />
M ay<br />
June<br />
5<br />
Reproduced from the Unclassified I Declassified Holdings <strong>of</strong> the National Archives<br />
S a n J o a q u in V a lle y :<br />
S t o c k t o n ______________ 2.56 .16 1.57 1.54 1.32 .25 T r 0 1.39 .40 .62 .24 10.05<br />
N e w m a n _____________ 1.95 .01 2.14 .99 .98 .11 0 0 .14 .16 .24 .04 6.76<br />
M e r c e d ________________ 1.55 0 2,64 1.67 .35 .04 T r 0 .13 .20 .58 .34 7.50<br />
S t o r e y ________________ .35 0 2.72 1.81 .40 0 0 0 0 0 1.00 0 6.28<br />
F r e s n o ________________ .72 T r 3.02 1.88 .41 T r T r 0 .10 .01 .85 .35 7.32<br />
V is a lia ________ „ __ 2.21 1.12 0 0 0 0 0 0 .30 .80<br />
B a k e r s fie ld _______ _ .54 6 2.19 1.16 0 0 0 0<br />
S ie r r a F o o t h i l ls :<br />
O r o v ille ______________ 3.81 .86 6.79 2.36 2.20 .25 T r 0 3.43 1.00 3.18 .90 24.78<br />
A u b u r n _______________ 3.75 .27 2.91 1.66 .90 .45 0 0 1.72 1.21 2.53 1.21 16.61<br />
L e m o n C o v e ______ _ .91 T r 5.12 3.11 1.17 0 0 0 T r 0 .55 .48 11.34<br />
P o r t e r v i l l e ____ _____ 1.30 .11 3.12 2.33 .14 0 T r 0 0 .12 .61 .49 8.22<br />
S a n ta C la r a V a lle y :<br />
S a n J o s e ______________ 1.36 .30 2.80 1.95 .70 .46 T r 0 .71 .21 .29 .43 9.21<br />
H o ll i s t e r _____________ 1.77 .18 2.25 2.30 .87 T r 0 0 .15 .22 .57 .42 8.73<br />
S a lin a s V a lle y :<br />
S a lin a s _______________ 2.31 .18 2.85 2.89 .70 .10 0 0 .07 .41 .33 .56 10.40<br />
K in g C i t y ____ ______ 2.83 0 3.03 2.78 .60 0 0 0 .02 0 .28 0 9.54<br />
P a s o R o b l e s _________ 1.40 0 5.14 2.89 .91 0 0 0 .04 0 .35 .12 10.85<br />
S o u t h C o a s t V a lle y s :<br />
S a n L u is O b i s p o ------ 2.80 .02 5.65 2.27 2.08 0 T r 0 .04 T r .79 .24 13.89<br />
S a n ta M a r ia ____ 1.34 0 4.13 .69 1.60 0 0 0 0<br />
S a n ta B a r b a r a ______ .42 0 9.48 2.12 1.58 T r T r T r T r .28 .21 T r 14.09<br />
O ja i V a lle y . - ------ .24 0 8.43 1.91 1.12 T r T r 0 0 .55 .20 .03 12.48<br />
S o u t h e r n C a lifo r n ia :<br />
L o s A n g e l e s _________ .07 0 6.99 1.66 .12 0 T r 0 0 .56 .35 .03 9.78<br />
R e d la n d s _________ .37 0 5.87 2.85 1.73 0 .16 T r .03 1.11 .34 .01 12.47<br />
S a n J a c i n t o ____ .15 0 7.29 3.24 1.18 0 0 .50 0 1.33 .48 0 14.17<br />
S a n D ie g o ------- - .66 0 5.72 2.13 .17 .16 .14 .26 0 .89 .40 .03 10.56<br />
I m p e r ia l V a lle y :<br />
B r a w le y — ------------ 0 0 .75 T r .45 .25 T r T r 0 T r T r .10 1.55<br />
T r in d ic a t e s a t r a c e o f p r e c ip it a t io n .<br />
75
Digitized for FRASER<br />
http://fraser.stlouisfed.org/<br />
<strong>Federal</strong> <strong>Reserve</strong> <strong>Bank</strong> <strong>of</strong> <strong>St</strong>. <strong>Louis</strong><br />
M ONTHLY AND SEASONAL TEMPERATURE AT CERTAIN STA<br />
TIONS IN CALIFORNIA DURING SEASON OF 1912-1913.<br />
Compiled by United <strong>St</strong>ates Weather Bureau<br />
ST A TIO N S.<br />
M a y<br />
June<br />
A n n 'l<br />
E x t r e m e N o r t h e r n<br />
C o u n t ie s :<br />
E u r e k a ______________<br />
M o n t a g u e __________<br />
A lt u r a s --------------------<br />
S a c r a m e n to V a lle y :<br />
R e d d in g - ____________<br />
C h ic o ________________<br />
W i llo w s _____________<br />
M a r y s v ille _________<br />
S a c r a m e n t o ________<br />
D a v is v ille __________<br />
V a c a v ille ___________<br />
N o r t h e r n C o a s t V a l<br />
le y :<br />
TJkiah _______________<br />
S a n ta R o s a ________<br />
S a n J o a q u in V a lle y :<br />
S t o c k t o n ____________<br />
N e w m a n ------------------<br />
M e r c e d ______________<br />
S t o r e y ______________<br />
F r e s n o ______________<br />
V is a lia ______________<br />
B a k e r s fie ld -------------<br />
49.6 48.9 46.3 48.4 52.lj 54.8 55.2<br />
34.4 42.01 41.0 45.5 54.8 62.1 69.2<br />
32.o! 36.6 35.4! 40.9 51.1 59.2 64<br />
47.2 52.7<br />
47.2! 51.4<br />
47.3| 53.0<br />
47.81 53.0<br />
47.4 53.1<br />
46.2<br />
48.41<br />
51.2<br />
53.5<br />
48.21 50.8<br />
50.0 51.2<br />
46. s! 52.2 52.0;<br />
53.3! 58.8 59.8<br />
46.6! 47.9 52.1<br />
43.6! 47.7 49.2i<br />
48.5 53.0 53.2<br />
48.6<br />
49.5: 58.2 57.6'<br />
52.2! 56.3 67.1, 75.8 80.0, 79.4,<br />
50.8 54.2 64.3' 72.7 78.0! 76.2;<br />
51.3 55.5, 67.0, 74.8 80.2, 79.9<br />
52.4 55.4| 65.0: 72.3 75.6 74.8<br />
'51.4 54.4' 63.6 69.2 71.6 71.6<br />
50.4 53.8 .63.7 69.6<br />
51.8 54.2 64.0 70.4<br />
57.2; 57.2: 50.8<br />
66.l! 59.5 45.6<br />
63.4 55.6:<br />
72.2, 61.0<br />
69.41 59.1<br />
75.31 65.8<br />
69.6: 59.2<br />
69.5 60.6<br />
73.0, 73.3 68.2! 57.3<br />
73.3! 73.2; 69.8: 59.0<br />
49.8 52.0 60.81 66.4 70.9 70.4 1 65.5 54.4<br />
49.8; 51.3 58.5; 63.2 63.6; 65.4 64.1. 56.7<br />
03.8<br />
55.6<br />
52.2<br />
56.8<br />
50.6<br />
70.2 71.2; 70.9, 68.4 .58.6<br />
74.9j 81.4 81.61 76.4 72,5 62.6<br />
67.2! 76.4 81.4! 77.4! 74.2 61.0<br />
63.6! 71.8 76.6 74.21 71.4 ! 58.8<br />
67.4<br />
60.4<br />
71.8<br />
75.2 79.8<br />
70.2! 70.9<br />
76.7 80.2<br />
77.7 73.21 61.6<br />
7 0 .4 _____| 54.0<br />
75.61 73.2' 62.9<br />
52.4 46.6 51.6<br />
42.4 34.2 49.7<br />
41.1 30.4 46.2<br />
53.4 48.1 62.1<br />
51.4 45,7 60.0<br />
55.4 47.8 62.8<br />
53.0 45.8 60.3<br />
52.4 46.9 59.3<br />
50.0 43.8 58.3<br />
52.3 45.6 59.6<br />
49.7 44.6 57.0<br />
51.8 46.6 56.0<br />
,50.6 44.! 58.7<br />
53.0 45.2 65.3<br />
54.7 48.4 61.9<br />
51.8 43.4 58.7<br />
55.2 45.5 62.3<br />
49.6 48.0<br />
57.4 47.2 64.1<br />
S ie r r a F o o t h i l ls :<br />
O r o v ille ________<br />
A u b u r n ________<br />
L e m o n C o v e<br />
P o r t e r v i l l e _____<br />
47.4<br />
47.2<br />
53.2<br />
52.0<br />
52.2<br />
50.2<br />
55.0<br />
55.0<br />
52.2! 56.0<br />
47.0; 49.8<br />
65.5<br />
60.7<br />
69.2<br />
72.2<br />
73.1 76.8<br />
73.8 74.0<br />
76.8 80.0<br />
75.8 81.2<br />
75.0, 70.0<br />
74.2' 67.6<br />
79.2! 74.4<br />
78.9! 74.6<br />
52.6 45.9 60.6<br />
45.6 46.8 57.9<br />
56.3 47.8 64.2<br />
55.7 46.2 63.9<br />
S a n ta C la r a V a lle y :<br />
S a n J o s e ----------------<br />
H o llis t e r __________<br />
S a lin a s V a lle y :<br />
S a lin a s ______________<br />
K in g C i t y ___________<br />
P a s o R o b l e s ________<br />
S o iith C o a s t V a lle y s :<br />
San L u is O b i s p o ___<br />
S a n ta M a r i a ________<br />
S a n ta B a r b a r a _____<br />
O ja i V a l l e y _________<br />
S o u th e r n C a lifo r n ia :<br />
L o s A n g e le s ________<br />
R e d la n d s ___________<br />
S a n J a c in t o ________<br />
S a n D i e g o ___________<br />
I m p e r ia l V a lle j':<br />
B r a w le y ------------------<br />
50.0<br />
50.4<br />
52.7<br />
52.0<br />
51.4 52.2 60.0<br />
50.2 51.5 58.8<br />
53.6 53.6 52.3; 52.3<br />
43.3 44.0 55.8 61.<br />
48.8: 52.8 49.9; 51.8! 60.6<br />
54.2, 55.1<br />
65.0! 64.7<br />
64.4; 63.6<br />
____ I 59.6<br />
76.2 78.4<br />
66.2 68.0<br />
50.6; 51.5; 58.3 60.9: 62.3<br />
65.1:<br />
63.8<br />
65.7<br />
65.4<br />
57.4<br />
58.0<br />
63.3, 66.4 59.6<br />
80.1 71.3, 64.4<br />
67.4 66.2 56.6<br />
63.2! 64.5; 59.6<br />
53.6<br />
54.0<br />
56.4<br />
60.0<br />
52.2<br />
47.8! 57.1<br />
45.8 56.5 ■<br />
4 7 .7 _____<br />
53.4 63.1<br />
42.0! 56.9<br />
58.4 51.2! 57.5<br />
55^1 57.6 52.8 54^6 59". 21 60^7 63^5 63.4 ! 63.7 61.2 58.7 52.4 58.6<br />
53.8 55.6 51.5 53.6 60.9 65.3 70.0 68.5 68.4 62.4 60.4 51.6, 60.2<br />
59.0 59.8 54.2 56.4 62.9 65.4 68.8 69.2 68.6 65.2 65.1 56.6 62.6<br />
53.6 55.7 50.8 54.6 63.2 69.8 73.6 72.7 1 70.7 61.2 60.0 50.6 61.4<br />
54.8 55.6 52.8 56.6 64.2| 71.7! 74.8 73.9! 71.4 61.2 60.0 50.6 62,3<br />
57.0: 56.2 55.1 56.1 60.6 63.2 66.9 66.4 65.8 63.3 61.2 54.1 60.5<br />
1<br />
55.0 50.0 58.1 65.6 75.0 84.1 86.4 86.2 79.9 68.8 61.8 50.3! 68.4<br />
76
Digitized for FRASER<br />
http://fraser.stlouisfed.org/<br />
<strong>Federal</strong> <strong>Reserve</strong> <strong>Bank</strong> <strong>of</strong> <strong>St</strong>. <strong>Louis</strong><br />
MARINE CASUALTIES TO VESSELS BOUND TO OR<br />
FROM PACIFIC COAST PORTS FOR THE SIX<br />
MONTHS ENDING DEC. 31, 1912.<br />
TOTAL LOSSES YEAR 1912.<br />
Admiral, schooner, from Valparaiso went through the jetty at<br />
mouth <strong>of</strong> Columbia River on January 13, 1912. Was towed <strong>of</strong>f by Tug<br />
Wallula. Later turned bottom up and drifted on Peacock Spit and<br />
became total loss. Crew saved.<br />
Alsen, power schooner, with crew, <strong>of</strong> 6 men reported lost prior to<br />
January 25, 1912.<br />
Armeria, U. S. Lighthouse Tender, was totally wrecked on May<br />
20, 1912, <strong>of</strong>f Cape Henshinbrook Alaska. Crew saved.<br />
Reproduced from the Unclassified / Declassified Holdings <strong>of</strong> the National Archives<br />
C. L. Dwyer, steamer, totally wrecked at Nome prior August 15,<br />
1912.<br />
Carrier Dove, fishing schooner, was totally wrecked on February<br />
14, 1912, at Otter Point. Crew saved by own boats and later picked up<br />
Br. <strong>St</strong>mr. Quadra.<br />
Condor, power schooner, went ashore at North Beach, Oregon, November<br />
17th, 1912. Vessel total loss. Part <strong>of</strong> cargo saved.<br />
Compeer, schooner, was driven ashore during heavy gale at Bristol<br />
Bay on July 18, 1912. Several attempts were made to float vessel without<br />
success.<br />
Dolphin, power fishing schooner, went ashore at Plumper Pass,<br />
February 23, 1912, and was totally wrecked. Crew were picked up by<br />
stamer Joan and landed at Victoria.<br />
E. K. Wood, from Tacoma for San Francisco, went ashore on<br />
Parier Reef, West Coast <strong>of</strong> Vancouver Island, November 17, 1912.<br />
Vessel total loss. Crew saved.<br />
Endeavor, schooner, from Victoria, ran ashore at Ngau Reef Suva<br />
on September 13, 1912. Became total loss. Wreck sold for £350.<br />
G-uard, U. S. steamer, went ashore at Charles Island, San Juan<br />
Groupe, prior to January 10th, 1912. Total loss. Crew saved.<br />
Gulf <strong>St</strong>ream, British Bark from Glasgow, for Victoria, was posted<br />
at Lloyds as missing on February 20, 1912. With all on board.<br />
77
Digitized for FRASER<br />
http://fraser.stlouisfed.org/<br />
<strong>Federal</strong> <strong>Reserve</strong> <strong>Bank</strong> <strong>of</strong> <strong>St</strong>. <strong>Louis</strong><br />
M ARIN E C A S U A L T IE S — CONTINUED.<br />
Hayden Brown, barge, went ashore and was totally wrecked May<br />
12, 1912 on Montague Island, after breaking adrift from Tug Pioneer<br />
May 10, during heavy gale, only 2 <strong>of</strong> crew reached shore. One later<br />
dying from exposure.<br />
Herald, river steamer, took fire at Oakland on November 4, 1912,<br />
and was totally destroyed.<br />
Ida McKay, schooner, from Bandon, for San Francisco, was abandoned<br />
on February 2, 1912, in Lat. 41 °N, Long. 132°W. Crew were<br />
taken <strong>of</strong>f by schooner Azalea and landed at San Pedro. Vessel afterwards<br />
turned turtle.<br />
J. J. Loggie, steamer, from Eureka for San Pedro, went ashore on<br />
October 19, 1912, <strong>of</strong>f Point Arguello. Vessel and cargo total loss. Crew<br />
saved.<br />
Joseph Russ, schooner, was totally wrecked on Chirik<strong>of</strong> Island, S.<br />
W. <strong>of</strong> Kodiak, on April 21, 1912, during heavy gale. Chief Officer<br />
drowned. Vessel high and dry on rocks.<br />
Klitikitat, barkentine, bound out <strong>of</strong> Hilo, went on rocks opposite<br />
Honolii Gulch, Hawaiian Islands, on November 9, 1912, and became a<br />
total loss. Crew saved.<br />
Lillebonne, barge, used as garbage carrier while being towed to<br />
sea on August 29, 1912, when between Point Bonita and Seal Rocks<br />
capsized. One <strong>of</strong> crew drowned. Vessel total loss.<br />
Liscum, U. S. steamer, at Shanghai, August 27, 1912, repairing,<br />
sunk along side <strong>of</strong> dock.<br />
Mary Sachs, schooner, went ashore at Teller (Seward Peninsula)<br />
prior October 23, 1912. Total loss.<br />
Midge, British tug, went ashore at McCaully Point near Victoria,<br />
December 16, 1912. Total loss.<br />
North <strong>St</strong>ar, power schooner, broke down near Coos Bay Bar on<br />
January 20, 1912. Drifted out to sea and capsized. Four <strong>of</strong> crew lost.<br />
Osprey, power schooner, went ashore on north jetty <strong>of</strong> Coos Bay on<br />
November 1, 1912, and became a total loss. All <strong>of</strong> crew lost.<br />
Ruth E. Q-odfrey, from Tocopilla, August 28, 1911, for Port Townsend<br />
was posted as missing on January 9, 1912. With all on board.<br />
Senator, tug owned in Seattle was sunk on December 9, 1912, in<br />
False Bay, following collision with scow which was in tow.<br />
Siver Wave, power schooner, went ashore and became a total loss<br />
at York (Seward Peninsula) prior to October 23, 1912.<br />
Torrisdale, British bark, from Caleta Colosa for Oregon, was driven<br />
ashore on South Jetty <strong>of</strong> Grays Harbor, December 28, 1912. Crew<br />
saved. Vessel total loss.<br />
78
Digitized for FRASER<br />
http://fraser.stlouisfed.org/<br />
<strong>Federal</strong> <strong>Reserve</strong> <strong>Bank</strong> <strong>of</strong> <strong>St</strong>. <strong>Louis</strong><br />
MARINE CASUALTIES— CONTINUED.<br />
Valentine, power schooner, was totally wrecked on night <strong>of</strong> February<br />
29, 1912, on reef one mile o ff Lopaz Island, Puget Sound, duringheavy<br />
gale.<br />
Vida, schooner, was wrecked on Tillamook Bar, on April 28, 1912.<br />
Crew saved.<br />
Welding Bros., fishing steamer, went ashore on W idby Island on<br />
March 21, 1912.<br />
Workman, British steamer, from San Francisco, November 16,<br />
1912, for London ashore December 27, 1912, 15 miles south <strong>of</strong> Rio<br />
Janiero. Part <strong>of</strong> cargo salved, Balance with ship total loss. Crew<br />
saved.<br />
PA R TIA L LOSSES 1912.<br />
A. F. Coats, schooner, was in collision during dense fog January<br />
12, 1912, with British barkentine Everett G. Griggs and had bow<br />
damaged.<br />
Reproduced from the Unclassified I Declassified Holdings <strong>of</strong> the National Archives<br />
Aberdeen, while docking at Seawall on November 10, 1912, ran<br />
into dock and split stem.<br />
Archer, power schooner, at San Francisco, November 19, 1912, from<br />
Roche Harbor had heavy weather on voyage. Engine broke down and<br />
lost some sails.<br />
Acme, steamer, at San Francisco September 4, 1912, from Eureka,<br />
when between Point Gorda and Shelter Cove shipped a heavy sea<br />
which washed overboard 100 cords <strong>of</strong> bark, flooded engine room and<br />
done other slight damages.<br />
Acme, ship from Baltimore, for Puget Sound, put into Montevideo<br />
on September 5, 1912 with cargo heated. Part <strong>of</strong> cargo lightened to<br />
ventilate.<br />
Admiralen, Norwegian steamer, from Sanderford, for Alaska, lost<br />
rudder on April 28, 1912, was towed to San Francisco by steamer<br />
Catania for repairs.<br />
Alaskan, steamer from Kahului, at Salina Cruz, April 4, 1912, had<br />
fire on board during voyage. Vessel and cargo slightly damaged.<br />
Alaskan, steamer, returned to San Francisco November 24, 1912,<br />
with starboard tail shaft broken.<br />
Alert, schooner, bound from Grays Harbor for Honolulu, collided<br />
with barkentine Gardiner City on April 11, 1912, and had jibboom<br />
carried away.<br />
79
Digitized for FRASER<br />
http://fraser.stlouisfed.org/<br />
<strong>Federal</strong> <strong>Reserve</strong> <strong>Bank</strong> <strong>of</strong> <strong>St</strong>. <strong>Louis</strong><br />
M A R IN E C ASU ALTIE S— CONTINUED.<br />
Algoa, British steamer, from Puget Sound for Naples put into .<br />
Colombo, December 14, 1912, with boiler out <strong>of</strong> order.<br />
Alliance, steamer from Columbia River for Coos Bay, lost rudder<br />
on January 7, 1912, 5 a. m., eight miles from Coos Bay. Was picked<br />
up on January 8, by <strong>St</strong>eamer Nome City and towed to Astoria.<br />
Americana, schooner, at San Francisco April 11, 1912, from Newcastle<br />
Australia, lost several sails, two gaffs and sustained considerable<br />
damage about decks during heavy weather on voyage.<br />
Antiope, British bark, at San Francisco March 14, 1912, from Newcastle,<br />
Australia, experienced a hurricane from December 25 to 28,<br />
1911. Vessel was thrown on beam ends, sails blown away and considerably<br />
damaged about decks.<br />
Arago, barkentine, from Coos Bay arrived at San Diego February<br />
18, 1912, leaking badly, sails blown away. Jettisoned part <strong>of</strong> deck<br />
load and burned a portion to keep steam on donkey engine to work<br />
pumps.<br />
Arctic <strong>St</strong>ream, British ship, at East London, February 28, 1912,<br />
from Victoria encountered gales on voyage. Lost sails, deck load<br />
shifted and received sundry damages about deck.<br />
Argyll, steamer, from San Francisco for Seattle, broke tail shaft<br />
on April 13, 1912, <strong>of</strong>f Cape Sebastian.<br />
Argyll, steamer from San Pedro, for Seattle collided with steamer<br />
Gualala on October 15, 1912, <strong>of</strong>f Point Arena, and received slight damage.<br />
Ashtabula, British steamer, at San Francisco, February 10, 1912,<br />
from Shanghai had steam steering gear damaged on voyage. Was<br />
hove too for 16 hours making repairs.<br />
Athena, schooner, from Boston for Seattle arrived at Montevideo<br />
December 28, 1911, leaking.<br />
Balboa, schooner, was in collision with barkentine Koko-Head <strong>of</strong>f<br />
Columbia River on October 16, 1912, and lost one mast.<br />
Bangor, barge, went ashore on Brittina Beach, February 6, 1912.<br />
Was floated on February 25, 1912 and towed to Vancouver for temporary<br />
repairs.<br />
Battle Abbey, British bark, from Newcastle Australia, at San<br />
Francisco May 30, 1912, experienced heavy gales, on May 29, during<br />
which lost several sails and damaged forequarter boat.<br />
80
Digitized for FRASER<br />
http://fraser.stlouisfed.org/<br />
<strong>Federal</strong> <strong>Reserve</strong> <strong>Bank</strong> <strong>of</strong> <strong>St</strong>. <strong>Louis</strong><br />
M A R IN E C A SU A LTIE S— CONTINUED.<br />
Beaver,, steamer, crossing Columbia Eiver bar on November 13,<br />
1912, was struck by heavy sea. After cabin smashed and wireless<br />
equipment destroyed.<br />
Bellerophon, British steamer, from Puget Sound ran aground in<br />
Eiver Mersey, January 28, 1912. Was floated without damage.<br />
Berengere, French ship, May 24, 1912, from Eotterdam for San<br />
Francisco put into Hobart damaged about decks.<br />
Bertha Dolbeer, from San Francisco for Grays Harbor returned<br />
to San Francisco in tow <strong>of</strong> steamer Johan Poulson July 10, 1912 having<br />
been in collision with British steamer Tuscarora <strong>of</strong>f San Francisco<br />
Lightship July 9, and having jibboom and head gear carried<br />
away and other damage about deck.<br />
Bertha Dolbeer, schooner, at San Francisco November 16, 1912,<br />
from Northwest Harbor had heavy weather on voyage, lost steering<br />
gear, broke 2 gaffs, stove in boats and was damaged about decks.<br />
Reproduced from the Unclassified I Declassified Holdings <strong>of</strong> the National Archives<br />
Bertie Minor, schooner, at San Francisco February 13, 1913, from<br />
Coquille Eiver had heavy gales on voyage. Lost 2 jibs and had head<br />
gear considerably damaged.<br />
British Yeoman, British bark, bound from Oregon for Port Natal<br />
put into San Francisco on February 11, 1912, with steering gear badly<br />
damaged in heavy gale on January 24, 1912.<br />
British Yeoman, British bark, lying at Folsom <strong>St</strong>reet wharf took<br />
fire in sail locker December 9, 1912. Fire was extinguished with much<br />
damage to sails and slight damage to vessel.<br />
C. A. Thayer, schooner, from Grays Harbor for San Pedro was<br />
spoken on January 13, 1912, 20 miles S. W. <strong>of</strong> Humboldt Bay, leaking<br />
badly. Was picked up on January 14, 1912, 25 miles <strong>of</strong>f Cape Mendocino<br />
by steamer J. B. <strong>St</strong>etson and towed to San Francisco. Upon arrival<br />
had 26 inches <strong>of</strong> water in hold.<br />
C. T. Hill, schooner, went ashore on the South Spit, % mile below<br />
jetty at entrance <strong>of</strong> Nehalem Eiver, on July 27, 1912.<br />
Calcutta, British bark, at San Francisco, May 2, 1912, from Kobe,<br />
ran into gale on voyage and lost jib and lower topsail.<br />
Californian, steamer, from Puerto Mexico, for Philadelphia,<br />
grounded near lower end <strong>of</strong> Tinicum Islands, March 23, 1912. Floated<br />
later damage if any was slight.<br />
Camino, from Portland for San Francisco, lost propeller on October<br />
19, 1912. Was picked up by steamer Watson and towed to San<br />
Francisco.<br />
81
Digitized for FRASER<br />
http://fraser.stlouisfed.org/<br />
<strong>Federal</strong> <strong>Reserve</strong> <strong>Bank</strong> <strong>of</strong> <strong>St</strong>. <strong>Louis</strong><br />
M A R IN E C ASU ALTIE S— CONTINUED.<br />
Casco, steamer, at San Francisco was run into by steamer Hanalei<br />
on December 9 and had guard and rail on starboard side also several<br />
knees badly damaged.<br />
Catania, steamer, grounder at Astoria on December 19, 1912.<br />
Was towed <strong>of</strong>f undamaged.<br />
Chas. F. Crocker, barkentine, loaded and lying at Astoria January<br />
30, 1912, lost both anchors and went ashore on Clatsop Spit inside No.<br />
10 buoy in smooth water. Was floated with assistance <strong>of</strong> tugs Goliah<br />
and Tatoosh. Damaged slightly about deck.<br />
Chas. F. Crocker, barkentine, bound from Columbia Eiver for Eten<br />
Peru put into San Francisco on February 21, 1912. Had heavy S. E.<br />
gale on February 15, 1912 causing vessel to leak. Had to keep pumps<br />
going continually upon arrival had 3 feet <strong>of</strong> water in hold and one<br />
pump broken. Cargo was discharged and vessel dry docked for repairs.<br />
Chas. Nelson, steamer, while docking in San Francisco on Dec. 13,<br />
ran into steamer Enterprise lying at dock. Nelson had part <strong>of</strong> bridge<br />
and rail on port side damaged also one life boat damaged.<br />
Chas. R. Wilson, schooner, at San Francisco June 17, 1912, had<br />
heavy gale on June 13, during which lost foremost head.<br />
Cheloshin, British steamer, struck rock in Skenna River on April<br />
1, 1912. <strong>St</strong>ove hole in stokehold and bunkers.<br />
City <strong>of</strong> Panama, steamer, from San Francisco at Mazatlan May 7,<br />
1912, had high pressure rink block deranged on voyage. Repairs made<br />
at Mazatlan.<br />
City <strong>of</strong> Panama, from San Francisco for Panama was towed back<br />
to San Francisco on July 10, 1912, with machinery disabled.<br />
City <strong>of</strong> Puebla, steamer, at Seattle March 23, 1912, had small fire<br />
in after hatch this morning. Damage slight.<br />
City <strong>of</strong> Seattle, steamer, from Skagway for Seattle went ashore<br />
August 15, 1912, 2 miles South <strong>of</strong> Ketchikan. Floated same day with<br />
assistance.<br />
City o f Topeka, steamer, while crossing bar at Eureka, December<br />
18, 1912, struck heavily, rudder carried away, also stern frame and<br />
several plates badly damaged. Was towed to San Francisco by<br />
steamer Maverick.<br />
Cleveland, German steamer, while coming to anchor in harbor at<br />
Honolulu on January 24, 1912 swung on United <strong>St</strong>ates <strong>St</strong>eamer Colorado,<br />
and had cabin damaged by gun.<br />
82
Digitized for FRASER<br />
http://fraser.stlouisfed.org/<br />
<strong>Federal</strong> <strong>Reserve</strong> <strong>Bank</strong> <strong>of</strong> <strong>St</strong>. <strong>Louis</strong><br />
M A R IN E C A SU A LTIE S— CONTINUED.<br />
Col. E. L. Drake, steamer, went ashore on Harbor Island, December<br />
20, 1912. Was towed <strong>of</strong>f by steamer Capt. A. F. Lucas undamaged.<br />
Colorado, U. S. steamer, had propeller damaged by being fouled by<br />
German steamer Cleveland in harbor at Honolulu on January 24, 1912.<br />
Coquette, schooner, returned to San Francisco on September 5,<br />
1912, on account <strong>of</strong> foremast head having been carried away.<br />
County <strong>of</strong> Linlithgow, Chili ship from Ant<strong>of</strong>agasta for Victoria<br />
went ashore on Otter Point on December 2, 1912. Was towed <strong>of</strong>f<br />
December 3, slightly damaged. Proceeded to Esquimalt for repairs.<br />
Crown <strong>of</strong> India, British ship, was in collision with British bark<br />
Inverclyde in Columbia River, December 27, 1912, and had several<br />
plates cracked, and fore and main rigging damaged.<br />
Daisy, steamer, at Oakland December 3, 1912, took fire. Was<br />
beached on mud flats after being flooded. Hull and houses much<br />
damaged.<br />
Reproducecnronnh^ncias^^ the National Archives<br />
Daisy Freeman, steamer, from Columbia River for San Francisco<br />
towed back to Astoria October 12, 1912. Leaking badly and deck load<br />
gone. Damage was caused by vessel striking bar. Was dry docked at<br />
Portland for repairs.<br />
Dauntless, schooner, from San Francisco, for Grays Harbor, returned<br />
to San Francisco July 14th, 1912, having been in collision with<br />
steamer Roanoke o ff San Francisco. Had hole 12 feet long and 4<br />
feet wide torn on starboard side below forerigging. Sixteen planks<br />
gone, bulwarks waterways damaged. Also deck damage.<br />
Dauntless, schooner, from Fort Bragg for Honolulu towed into<br />
San Francisco on October 14, 1912, by steamer <strong>St</strong>. Helens. Was in<br />
collision with latter on October 13 during heavy fog. Former had hole<br />
8 feet stove in on port side aft <strong>of</strong> main rigging causing vessel to leak<br />
badly.<br />
David Evans, British schooner, at Victoria November 12, 1912,<br />
from Japan encountered severe weather on voyage lost nearly all sails<br />
and was also damaged slightly about decks.<br />
David Scannel, Fire tug, grounded on Anita reef, on March 15,<br />
1912 was floated leaking slightly.<br />
Defender, schooner, from Honoipu at San Francisco October 28,<br />
1912, had hurricane on voyage. Blew away jib mizzensail, and staysail<br />
and washed overboard every thing movable about deck.<br />
Defiance, schooner, stranded on Empire Spit, Willapa Harbor,<br />
October 19, 1912. Floated with assistance undamaged.<br />
83
Digitized for FRASER<br />
http://fraser.stlouisfed.org/<br />
<strong>Federal</strong> <strong>Reserve</strong> <strong>Bank</strong> <strong>of</strong> <strong>St</strong>. <strong>Louis</strong><br />
M A K iN E C A SU A LTIE S— CONTINUED.<br />
Den <strong>of</strong> Clamis, British steamer, was in collision at entrance <strong>of</strong><br />
Shanghai Harbor on September 26, 1912. With Japanese steamer<br />
Shidzuoka Maru. Slightly damaged.<br />
Dora, steamer, was driven ashore on beach at Seward on December<br />
7, 1912, during heavy gale. Vessel partly filled with water and was<br />
much damaged. Was floated on December 27, 1912 and proceeded to<br />
Seattle under own steam.<br />
Dunsyre, British ship at San Francisco June 3, 1912, carried away<br />
steering gear on April 2, south <strong>of</strong> Pitcairn Island in strong N. E. gale.<br />
Edith, steamer, at Seattle May 15, 1912, lost 2 blades <strong>of</strong> propeller<br />
on May 10, 1912, 600 miles from Cape Flattery.<br />
Edward Sewall, ship, at San Francisco March 10, 1912, from Philadelphia<br />
in Gulf <strong>St</strong>ream on October 9, 1911, encountered a hurricane<br />
lost fore and maintopgallant masts and whole suit <strong>of</strong> sails, broke 2<br />
steel yards and washed overboard everything movable <strong>of</strong>f the deck.<br />
Put back to New York for repairs. On November 4, sailed again and<br />
on November 11 encountered another hurricane losing foresail and three<br />
lower topsails.<br />
Eldorado, schooner, in port at Iquique loading for Honolulu wasdamaged<br />
by collision with British steamer Foxley on February 24,<br />
1912.<br />
Enterprise, steamer, from San Francisco for Hilo broke tail shaft:<br />
on March 25, 1912, 375 miles from San Francisco was picked up and<br />
towed back to port by steamer Lurline.<br />
Enterprise, steamer, lying at dock in San Francisco was run into<br />
by <strong>St</strong>eamer Chas. Nelson. No damage.<br />
Erskine M. Phelps, at San Francisco from Philadelphia, December<br />
30, 1912, had heavy weather on voyage during which lost sails.<br />
Everett G. Griggs, British barkentine, while bound in from Tulcahuano<br />
on January 12, 1912, collided with schooner A. F. Coats in<br />
<strong>St</strong>raits <strong>of</strong> Fuca during dense fog and had bows damaged.<br />
Expansion, schooner, put into Tahiti prior July 10, 1912, while<br />
bound from Grays Harbor for Valparaiso leaking badly. Cargo discharged.<br />
Expansion, schooner, put back August 18, 1912, to Honolulu from<br />
Tahiti for repairs.<br />
FI, IT. S. Submarine, dragged anchor at Port Watsonville October<br />
11, 1912, and went ashore. Two <strong>of</strong> crew drowned. Was floated on<br />
October 19 and towed to San Francisco.
Digitized for FRASER<br />
http://fraser.stlouisfed.org/<br />
<strong>Federal</strong> <strong>Reserve</strong> <strong>Bank</strong> <strong>of</strong> <strong>St</strong>. <strong>Louis</strong><br />
M A R IN E C A SU A LTIE S— CONTINUED.<br />
F. A. Kilburn, steamer, arrived at Eureka August 1, 1912, from<br />
San Francisco, had fire in engine room on voyage up. Same spread to<br />
state rooms on upper deck which were destroyed.<br />
F. A. Kilburn, steamer, bound out from Eureka, on December 2,<br />
1912, struck on bar, carried away rudder sprung a leak. Returned for<br />
temporary repairs.<br />
F. S. Loop, steamer, bound from Tacoma for San Francisco,<br />
snagged propeller prior to April 13, 1912 and was dry docked.<br />
Fairhaven, steamer, from Port Ludlow for San Francisco was in<br />
collision on September 14, 1912 o ff Point Arena damage slight.<br />
Fitzclarence, British steamer, lying at Green <strong>St</strong>reet wharf, San<br />
Francisco, took fire September 11, 1912 in No. 1 and 2 holds. Fire<br />
was got under control by chemicals. Fire extinguished on September<br />
15, 1912. Vessel and cargo much damaged.<br />
Reproduce^ran^i^Uncla^ined^uecrassif^^HWaTng^^TOTeNationaTArch i ves<br />
Forester, schooner, bound from Grays Harbor for Santa Rosalia,,<br />
put into San Francisco February 20, 1912 had heavy gale on February<br />
3, 1912 throwing vessel on beam ends flooding cabin and forecastle and<br />
causing vessel to leak. Deck lashings were cut and about 200,000 lumber<br />
<strong>of</strong> deckload was jettisoned to save vessel. On arrival vessel had<br />
about 8 or 10 feet <strong>of</strong> water in hold. Examination was made and<br />
found cause <strong>of</strong> leak was knot in one <strong>of</strong> bottom planks coming loose.<br />
Fort Bragg, steamer, while leaving Fort Bragg on February 9,<br />
1912, struck submerged rock on port side. Hung on rock for 5 minutes<br />
before floating. On arrival was leaking about foot an hour.<br />
Francis H. Leggett, steamer, carried away steering gear on January<br />
24, 1912, 12 miles South <strong>of</strong> Cape Flattery. Made temporary repairs<br />
and arrived at Astoria on January 26, 1912.<br />
G. W. Watson, schooner, at Papeete, April 3, 1912, from Raymond<br />
after discharging cargo and bound to sea went ashore on reef. On<br />
voyage down lost portion <strong>of</strong> deck load in heavy weather.<br />
Galilee, schooner, from San Francisco for Bering Sea returned to<br />
San Francisco, March 20, 1912 leaking— pumps being unable to keep<br />
vessel free. Returned for repairs.<br />
Gardiner City, barkentine, from San Francisco for Port Gamble,<br />
returned to San Francisco on April 19, 1912 and reported on April 11,<br />
1912 during heavy squall was struck on starboard side at fore rigging<br />
by schooner Alert carrying away starboard fore rigging, stove in bulwarks<br />
and rail also several planks on starboard side. Foremast was<br />
carried away at deckhouse, mainmast at main deck, and mizzenmast<br />
15 feet above poop deck. Spar coming down went through forward<br />
85
Digitized for FRASER<br />
http://fraser.stlouisfed.org/<br />
<strong>Federal</strong> <strong>Reserve</strong> <strong>Bank</strong> <strong>of</strong> <strong>St</strong>. <strong>Louis</strong><br />
M ARIN E C A SU A LTIE S— CONTINUED.<br />
house, and falling mainmast stove in companionway and doors.<br />
did considerable other damage about deck.<br />
Also<br />
General Frisbie, Bay steamer, collided with U. S. <strong>St</strong>eamer Iroquis<br />
in San Francisco Bay on February 2, 1912 during heavy fog <strong>of</strong>f South<br />
end <strong>of</strong> Mare Island. Received slight damage.<br />
Geo. E. Billings, schooner, at San Francisco April 9, 1912 from<br />
Newcastle, Australia, lost sails during heavy gales on February 12,<br />
1912.<br />
Geo. F. Haller, steamer, bound for Bristol Bay, returned to San<br />
Francisco on April 25, 1912 leaking, also broke steam pipe. Was dry<br />
docked for repairs.<br />
Geo. R. Vosburg, steamer, went ashore at entrance <strong>of</strong> Nehalem<br />
River on May 3, 1912. Was towed <strong>of</strong>f on May 13, badly damaged.<br />
Graywood, steamer, ran ashore at West Point, Washington on<br />
September 19, 1912. Floated without assistance. Not damaged.<br />
Gifford, British steamer, from Antwerp for San Francisco, grounded<br />
on Sunk Island, April 11, 1912. Floated with loss <strong>of</strong> both anchors<br />
and chains.<br />
Gualala, steamer, was run into by <strong>St</strong>eamer Argyll on October 15,<br />
1912, <strong>of</strong>f Point Arena; vessel turned over on port side; two men injured.<br />
Later vessel was abandoned by crew and turned bottom up.<br />
Was towed into San Francisco by <strong>St</strong>eamer Brooklyn.<br />
Hanalei, steamer, collided with <strong>St</strong>eamer Casco at San Francisco<br />
on December 9, 1912 and had bow badly stove.<br />
Harlesden, British steamer, loading cotton at Santa Fe wharf had<br />
fire in after hold on March 27, 1912. Same was extinguished by crew.<br />
Damage slight.<br />
Harold, British bark, arrived at Cape Town, November 26, 1912<br />
from Vancouver. Lost deckload on voyage during heavy weather.<br />
Harvard, steamer, at San Pedro April 28, 1912, took fire at dock.<br />
Fire was extinguished, damage about $8^000.<br />
Hawaii, barkentine, from Sydney, at Newcastle, Australia, December<br />
14, 1912 had steering gear disabled.<br />
Hazel Dollar, British steamer, from Victoria for Taku, returned to<br />
Victoria March 27, 1912 with rudder stock broken. Having experienced<br />
a hurricane on March 7, <strong>of</strong>f the Aleutian Islands. Also had blow<br />
flange coupling broken.<br />
Henry K. Hall, schooner, at . San Francisco, March 25, 1912, reports<br />
on March 5, in hurricane lost main and mizzen gaff and several sails.<br />
86
Digitized for FRASER<br />
http://fraser.stlouisfed.org/<br />
<strong>Federal</strong> <strong>Reserve</strong> <strong>Bank</strong> <strong>of</strong> <strong>St</strong>. <strong>Louis</strong><br />
M A R IN E C ASU ALTIE S— CONTINUED.<br />
Homer, steamer, from San Francisco for Seattle, broke port crank<br />
shaft on March 14, 1912. 50 miles northwest <strong>of</strong> Cape Mendocino; returned<br />
to San Francisco for repairs.<br />
Homer, steamer, from Pribil<strong>of</strong> Island at San Francisco, September<br />
27, 1912; broke tail shaft and port engine on September 24, 1912.<br />
Hornelen, Norwegian steamer from Oregon arrived at Auckland on<br />
February 6, 1912, damaged a good deal about decks, loss <strong>of</strong> masts,<br />
and bulwarks, 2 boats smashed and 2 splintered and deck load lost in<br />
hurricane <strong>of</strong>f Tongan Group.<br />
Hugh Hogan, schooner, from San Francisco for Bandon, drifted<br />
ashore on beach below Cliff House on July 14, 1912. Was floated with,<br />
assistance on July 14. Rudder keel, centerboard and one plank forward<br />
damaged.<br />
Hugh Hogan, schooner, arrived at San Francisco November 21,<br />
1912, had heavy gales on voyage causing vessel to leak. <strong>St</strong>eam pump<br />
kept working continually. Upon arrival was leaking about 3 inches<br />
per hour.<br />
Reproduced from the Unclassified I Declassified Holdings <strong>of</strong> the Nationat Archives<br />
Hyades, steamer, from San Francisco for Seattle, struck bottom<br />
at 3 a. m. January 24, 1912, <strong>of</strong>f Double Point. Received some damage<br />
but proceeded.<br />
Iaqua, steamer, from Eureka for San Diego had heavy weather on<br />
March 10, 1912. Lost deck load <strong>of</strong> lumber and had Sampson post<br />
broken.<br />
Iact'ja, steamer, bound out <strong>of</strong> Eureka on August 5, 1912, went<br />
aground at entrance. Was floated with assistance and proceeded.<br />
Ida A, power schooner, went ashore on beach in Drakes Bay on<br />
March 5, 1912; was floated with assistance on April 4, 1912; much<br />
damaged.<br />
Ikala, British steamer, from Oregon for Melbourne put into Suva<br />
December 11, 1912, with machinery disabled.<br />
Ikalis, British steamer, from Oregon for Australia put into San<br />
Francisco on October 23, 1912, having experienced heavy gales, during<br />
which deck load shifted, carrying away life boat, and lost one overboard.<br />
Flooded engine room and did other damage about deck. Put<br />
into San Francisco for repairs.<br />
Independent, fishing steamer, sank at coal bunkers in Seattle on<br />
February 22, 1912, after coaling. Was raised on February 27, 1912 and<br />
beached at Harbor Island for temporary repairs.<br />
87
Digitized for FRASER<br />
http://fraser.stlouisfed.org/<br />
<strong>Federal</strong> <strong>Reserve</strong> <strong>Bank</strong> <strong>of</strong> <strong>St</strong>. <strong>Louis</strong><br />
M A R IN E C ASU A LTIE S— CONTINUED.<br />
Inverclyde, British bark, was in collision December 27, 1912 in<br />
Columbia River with British ship Crown <strong>of</strong> India and had bowsprit<br />
carried away, shrouds and two plates damaged.<br />
Inverness-Shire, British bark, at Greenock January 16, 1912 from<br />
Victoria had hurricane on voyage. Lost sails and was much damaged<br />
about decks.<br />
Iolani, fishing tug, had tail shaft broken outside San Francisco<br />
heads on February 20, 1912. Was towed in by fishing tug Henrietta.<br />
Iroquois, TJ. S. steamer, was in collision with bay steamer General<br />
Frisbie on February 2, 1912, <strong>of</strong>f south end <strong>of</strong> Mare Island. Had guard<br />
rail carried away.<br />
J. J. Loggie, steamer, while bound into Eureka on February 5,<br />
1912, struck the bar. Damaged rudder and is leaking.<br />
J. M. Wilson, Sound steamer, was slightly damaged by collision<br />
with <strong>St</strong>eamer Mongolia December 7, 1912 in Seattle harbor.<br />
James Johnson, barkentine at San Francisco February, 1912<br />
had heavy gale on January 22, 1912 and had main and fore gaff carried<br />
away.<br />
Jordanliill, British ship, from Cardiff at Guaymas February 27,<br />
1912, had heavy weather <strong>of</strong>f Cape Horn causing damage to sails, rigging,<br />
bulwarks and sundry losses and damages about deck.<br />
John A, schooner, put into Kings Cove on July 8, 1912 to repair<br />
rudder which was damaged in heavy weather.<br />
John Palmer, barkentine, from Callao at San Francisco October<br />
29, 1912 had heavy gales on voyage, lost jibtop sail, lower topsail pennant<br />
brace carried away causing lower topsail yard to break. Also<br />
lost several head sails and mizzen sails.<br />
John and Winthrop, whaling bark, at San Francisco October 25,<br />
1912 had heavy gale on September 8, which caused vessel to spring a<br />
leak. Upon arrival vessel was leaking at rate <strong>of</strong> 2 feet per hour.<br />
Kentra, British steamer, from San Francisco for Swansea arrived<br />
at <strong>St</strong>. Vincent, C. V., November 6, 1912, with machinery defective.<br />
High pressure cylinder and cylinder cover cracked, piston and piston<br />
rod bent. Proceeded under compound engine.<br />
Kina, Danish steamer, bound from Portland, grounded on mud<br />
bank on October 24, 1912, below mouth <strong>of</strong> Williamette River. Floated<br />
night <strong>of</strong> October 28, undamaged.<br />
Koko Head, was in collision with Schooner Balboa <strong>of</strong>f Columbia<br />
River on October 16, 1912 and was slightly damaged.<br />
88
Digitized for FRASER<br />
http://fraser.stlouisfed.org/<br />
<strong>Federal</strong> <strong>Reserve</strong> <strong>Bank</strong> <strong>of</strong> <strong>St</strong>. <strong>Louis</strong><br />
M A R IN E C A SU A LTIE S— CONTINUED.<br />
Kumeric, British steamer, from Oregon for China had heavy<br />
weather on voyage in December, 1911. Houses on starboard side stove<br />
in by seas.<br />
Lahaina, barkentine, from Newcastle, Australia at San Francisco<br />
February 1, 1912 lost several sails on voyage.<br />
Lahaina, barkentine, while coming to anchor on October 1, 1912 <strong>of</strong>f<br />
Meiggs W harf fouled Schooner Annie Larsen at anchor. Latter had<br />
head gear and jibboom carried away. Former had after rail and davits<br />
carried away.<br />
Lief E, power schooner, collided with British steamer Prince<br />
George at Seattle October 15, 1912 and was badly damaged.<br />
Lord Curzon, British steamer, put into Yokohama November 20,<br />
1912, short <strong>of</strong> fuel, consumed portion <strong>of</strong> cargo to keep fires going.<br />
Lord Derby, British steamer, lying at Tacoma October 5, 1912, had<br />
fire on board. Was extinguished without damage.<br />
Reproduced from the Unclassified / Declassified Holdings <strong>of</strong> the National Archives<br />
Lurline, Columbia River steamer collided with barge near Rainier 1<br />
on October 19, 1912. Commenced to leak badly and was beached at<br />
mouth <strong>of</strong> Cowlitz River.<br />
Mahukona, schooner at San Francisco November 20, 1912, lost<br />
complete suit <strong>of</strong> sails <strong>of</strong>f Cape Flattery. Vessel also leaking.<br />
Makaweli, barkentine, at Aberdeen May 7, 1912, had end <strong>of</strong> spike<br />
bowsprit carried away by steamer J. B. <strong>St</strong>etson.<br />
Manchuria, steamer, lying at Pacific Mail Dock March 17, 1912,<br />
took fire in hold among cotton and canned goods cargo. Hold was<br />
flooded and fire extinguished late same night. Cargo much damaged<br />
and discharged. Damage to vessel slight.<br />
. Manchuria, steamer, at Hongkong September 28, 1912 from San<br />
Francisco had fire on board on voyage, and was badly damaged.<br />
Maweema, schooner, from Willapa Harbor arrived at San Diego<br />
February 18^ 1912 had heavy gale on voyage. Lost lifeboat, compass,<br />
binnacle box and portion <strong>of</strong> cargo overboard.<br />
Mariposa, steamer, ran into wharf at Valdez August 23, 1912 damaging<br />
same after got ashore on mud bank. Was floated uninjured.<br />
Mary Dodge, schooner, arrived at San Francisco February 23, 1912<br />
went aground on mud banks in Oakland Creek. Was towed <strong>of</strong>f by<br />
tugs undamaged.<br />
Marshfield, steamer, was in collision with steamer South Coast <strong>of</strong>f<br />
Point Bonita August 21, 1912 and was slightly damaged.<br />
89
Digitized for FRASER<br />
http://fraser.stlouisfed.org/<br />
<strong>Federal</strong> <strong>Reserve</strong> <strong>Bank</strong> <strong>of</strong> <strong>St</strong>. <strong>Louis</strong><br />
M A R IN E C A SU A LTIE S— CONTINUED.<br />
Marshfield, steamer, from San Francisco for Hardy Creek returned<br />
to port October 13, 1912 with bow stove in and stern piece carried<br />
away above and below water line, also planking on starboard side<br />
started. Was leaking about 1 foot per hour. Damage was caused by<br />
vessel striking land west <strong>of</strong> Point Bonita.<br />
Mayfair, steamer, from Willapa Harbor arrived at San Francisco<br />
on February 21, 1912 in tow <strong>of</strong> <strong>St</strong>eamer Willapa having broken low<br />
pressure crank shaft <strong>of</strong>f Shelter Cove on February 19, 1912.<br />
Mayflower, schooner, returned to San Francisco on May 12, 1912 in<br />
tow <strong>of</strong> <strong>St</strong>eamer San Pedro waterlogged. San Pedro having struck<br />
vessel on May 11, 1912, 5 miles N. W. <strong>of</strong> Point Reyes. Crew were<br />
taken <strong>of</strong>f by San Pedro.<br />
Melville Dollar, steamer, arrived at Port Townsend bound from<br />
Bellingham for San Francisco returned December 5, 1912 with propeller<br />
badly damaged.<br />
Meteor, schooner, arrived at San Pedro February 19, 1912 from<br />
Grays Harbor had heavy weather <strong>of</strong>f Oregon Coast, blew away several<br />
sails and causing vessel to spring a leak.<br />
Minnesota, steamer, at Seattle March 7, 1912 had fire in bunkers,<br />
same was extinguished without damage to cargo.<br />
Mongolia, Sound steamer, was slightly damaged by collision with<br />
Sound <strong>St</strong>eamer J. M. Wilson in Seattle Harbor on December 7, 1912.<br />
Montara, steamer, bound from Selbys for San Francisco September<br />
26, 1912 grounded on mud bank on North Side <strong>of</strong> Goat Island.<br />
Floated later with assistance. No damage.<br />
Napa Valley, River steamer, bound to Vallejo on June 17, 1912<br />
broke rudder stock when <strong>of</strong>f Oleum. Was towed to San Francisco for<br />
repairs.<br />
Nauplia, German steamer, went ashore December 12, 1912 at Point<br />
Wilson. Was towed <strong>of</strong>f and proceeded to Seattle. Damage slight.<br />
Navigator, tug, was towed into San Pedro on March 12, 1912 with<br />
hawser entangled in propeller.<br />
Newport, steamer, sunk at dock at Balboa on August 16, 1912.<br />
Was fully loaded. Vessels sinking was caused by dock collapsing.<br />
Was floated on November 10, 1912 with assistance <strong>of</strong> British <strong>St</strong>eamer<br />
Salvor. Cargo almost total loss.<br />
Nile, British steamer, while leaving Yokohama on March 7, 1912<br />
for San Francisco steering gear got out <strong>of</strong> order and vessel ran<br />
aground. Floated later undamaged.<br />
90
Digitized for FRASER<br />
http://fraser.stlouisfed.org/<br />
<strong>Federal</strong> <strong>Reserve</strong> <strong>Bank</strong> <strong>of</strong> <strong>St</strong>. <strong>Louis</strong><br />
M A R IN E C A SU A LTIE S— CONTINUED.<br />
Northland, steamer, ran ashore near Ketchikan on September 9,<br />
1912. Was floated with slight damage.<br />
Oceania Vance, schooner from Astoria for San Diego towed into<br />
Port Townsend November 17, 1912 by <strong>St</strong>eamer Riverside with loss <strong>of</strong><br />
main and mizzen masts in gale <strong>of</strong>f Tillamook. Vessel was waterlogged.<br />
Ockley, British steamer, from Oregon and Puget Sound for Hongkong,<br />
put into Mororan December 11, 1912 for fuel. On voyage during<br />
heavy weather lost deck load <strong>of</strong> lumber, had four boats stove and<br />
steering gear damaged. 7<br />
Ockley, British steamer, arrived at Hongkong December 23, 1912<br />
with fore and after peak leaking.<br />
Oregon, schooner, from San Francisco for Bandon returned to San<br />
Francisco on September 23, 1912 on account <strong>of</strong> carrying away spanker<br />
<strong>of</strong>f Point Arena in heavy N. W. gale.<br />
Ottillie Fjord, schooner, at San Francisco September 5, from Bering<br />
Sea lost starboard anchor and 25 fathoms <strong>of</strong> chain on May 10.<br />
On July 30, lost port anchor and 30 fathoms <strong>of</strong> chain.<br />
Oweenee, British ship, dragged anchor at Astoria November 12,<br />
1912 and drifted ashore. Floated November 13, undamaged.<br />
Pearl, launch, with scow in tow went ashore March 1, 1912 at<br />
Port Crescent.<br />
Petroleum No. 2, steamer, went aground in Neah Bay on June 4,<br />
1912 was towed <strong>of</strong>f June 5, by U. S. Tug Snohomish and Tug Pioneer<br />
and towed to Seattle.'<br />
Pleiades, steamer, from San Francisco at Balboa had fire in cargo<br />
on February 27, 1912. Cargo slightly damaged.<br />
Pleiades, steamer, from San Francisco for Balboa went ashore<br />
August 16, 1912, 12 miles north <strong>of</strong> Cape Lazaro. Sand banked around<br />
vessel. Deck load <strong>of</strong> lumber was jettisoned; was floated on September<br />
8, leaking slightly. Arrived at San Francisco leaking in fore and after<br />
peak. Cargo was discharged and dry docked for repairs.<br />
Poltalloch, British steamer, at San Francisco September 19, 1912<br />
from Newcastle, Australia, lost sails during heavy gales on voyage.<br />
Potlatch, Sound steamer, bound from Seattle ran into Schooner<br />
<strong>St</strong>ol<strong>of</strong> on October 10, 1912 and received slight damage.<br />
Portland, steamer, from Norfolk, Va., for San Francisco put into<br />
San Juan prior to February 29, 1912 with machinery damaged.<br />
Prince Albert, British steamer, while leaving Victoria on March<br />
25, 1912 struck rocks. Was floated and discharged cargo.<br />
91
Digitized for FRASER<br />
http://fraser.stlouisfed.org/<br />
<strong>Federal</strong> <strong>Reserve</strong> <strong>Bank</strong> <strong>of</strong> <strong>St</strong>. <strong>Louis</strong><br />
M ARIN E C ASU A LTIE S— CONTINUED.<br />
Prince George, British steamer, collided with power schooner Lief<br />
E. in Seattle harbor on October 15, 1912 and was slightly damaged.<br />
Prince John, British steamer, struck on Mossett Bar, Graham Island<br />
on May 19, 1912. Returned to Victoria leaking for repairs.<br />
Beni, gas launch, ran ashore on Dungeness January 24, 1912. Was<br />
assisted <strong>of</strong>f by U. S. Tug Snohomish on January 25, and turned turtle<br />
while in tow bound for Seattle.<br />
Reliance, tug, went ashore in Powell River on December 9, 1912.<br />
Floated on December 10, slightly damaged.<br />
Robert Dollar, British steamer, arrived at Yokohama on December<br />
18, 1912 with loss <strong>of</strong> part <strong>of</strong> deck load, and bulwarks damaged.<br />
Rochelle, from Oregon for San Francisco returned to Astoria<br />
October 8, 1912 leaking badly. Proceeded to Rainier for repairs.<br />
Roche jaquelin, French bark, at Swansea, February 1, 1912 from<br />
San Francisco had heavy weather on voyage. Lost two boats and received<br />
some damage about deck.<br />
Rosamond, schooner, at Raymond November 3, 1912 had fire on<br />
board. Fore mast, fore sail, boom and gaff damaged.<br />
Rosecrans, steamer, at Gaviota March 12, 1912 parted mooring<br />
lines, anchors dragged and vessel was driven ashore during heavy<br />
gale, had large hole stove in bottom and two <strong>of</strong> crew drowned while<br />
trying to land. Was floated on April 2, with assistance <strong>of</strong> Tugs<br />
Navigator and Sea Rover. Was later towed to San Francisco for<br />
repairs.<br />
Rosecrans, steamer, loading at Gaviota August 27, 1912 took fire<br />
and was seriously damaged. Was towed to San Francisco for repairs.<br />
S. N. Castle, barkentine, from Fanning Island for San Francisco<br />
arrived at Honolulu March 22, 1912 for repairs vessel having been<br />
ashore between Fanning and Washington Islands. Lost anchors and<br />
chains and damaged rudder. Survey held and cargo discharged and<br />
permanent repairs made.<br />
S. N. Castle, barkentine, at Honolulu was badly damaged by fire<br />
on May 11, 1912. Cargo was discharged to repair vessel.<br />
Saginaw, steamer, while docking at San Pedro September 5, 1912<br />
collided with <strong>St</strong>eamer Shasta and had stern damaged.<br />
Saginaw, at San Francisco November 15, 1912 from Willapa Harbor<br />
had heavy weather on voyage. Vessel leaking slightly.<br />
92
Digitized for FRASER<br />
http://fraser.stlouisfed.org/<br />
<strong>Federal</strong> <strong>Reserve</strong> <strong>Bank</strong> <strong>of</strong> <strong>St</strong>. <strong>Louis</strong><br />
M A R IN E C A SU A LTIE S— CONTINUED.<br />
Saint Hilda, British steamer, while leaving Bellingham on January<br />
23, 1912 for Everett struck bottom. Diver examined bottom and<br />
reported not damaged to any extent.<br />
Sais, German steamer, from Hamburg for San Francisco returned<br />
to Punta Arenas on February 3, 1912. With machinery damaged.<br />
Salatis, German steamer, arrived at Hamburg February 4, 1912<br />
was badly damaged by collision in River Elbe. Was docked for repairs.<br />
Salvator, schooner, grounded at entrance <strong>of</strong> Honolulu harbor on<br />
December 17, 1912 was floated undamaged same day.<br />
San Pedro, steamer, bound out <strong>of</strong> Eureka on February 22, 1912<br />
struck on bar. Returned to port with assistance <strong>of</strong> tug leaking. Discharged<br />
part <strong>of</strong> deck load.<br />
San Pedro, steamer, from San Francisco collided with Schooner<br />
Mayflower on May 11, 1912, 5 miles 1ST. W. <strong>of</strong> Point Reyes. Was undamaged.<br />
Reproduced from the Unclassified I Declassified Holdings <strong>of</strong> the National Archives<br />
Santa Ana, steamer, from Seward for Seattle went ashore at Karta<br />
Bay on January 25, 1912. Vessel struck at high tide. 400 tons <strong>of</strong><br />
ore cargo was discharged into lighters and vessel floated on January<br />
28, with slight damage.<br />
Sausalito, schooner, at San Francisco December 15, 1912 from<br />
Coquille River, had heavy gale during which foresail and outer jib<br />
carried away.<br />
Scotia, steamer, While crossing Humboldt Bay Bar on November<br />
22, 1912 shipped heavy sea. Had upper works damaged.<br />
Sebara, German steamer, while leaving Acajutla on November<br />
24, 1912 struck uncharted rock causing tanks No. 1, 2, 5 and 6 to<br />
leak. Also did considerable damage to plates.<br />
Sentinel, river steamer, sunk near Knights Landing on November<br />
1, 1912, same was caused by seam opening.<br />
Shasta, at San Pedro September 5, 1912 was run into by <strong>St</strong>eamer<br />
Saginaw and had stern damaged.<br />
Shidzuoka Maru, from Hongkong for Puget Sound collided with<br />
British steamer Dan <strong>of</strong> Clamis at entrance <strong>of</strong> Shanghai Harbor on<br />
September 26. Was slightly damaged.<br />
Shoshone, steamer, bound out from Aberdeen, broke tail shaft in<br />
lower harbor on July 11, 1912.<br />
93
Digitized for FRASER<br />
http://fraser.stlouisfed.org/<br />
<strong>Federal</strong> <strong>Reserve</strong> <strong>Bank</strong> <strong>of</strong> <strong>St</strong>. <strong>Louis</strong><br />
M ARIN E C A SU A LTIE S— CONTINUED.<br />
Sophie Christenson, schooner, from Seattle for Ant<strong>of</strong>ogasta put<br />
into Tahiti on August 8, 1912 leaking. Later returned to Honolulu for<br />
repairs.<br />
South Coast, steamer, was in collision on August 21, 1912 <strong>of</strong>f Point<br />
Bonita with <strong>St</strong>eamer Marshfield and had rail and bulwarks stove.<br />
<strong>St</strong>. Helens, steamer, returned to San Francisco October 14, 1912<br />
with bow slightly damaged, having been in collision with Schooner<br />
Dauntless.<br />
<strong>St</strong>andard, ship arrived at mouth <strong>of</strong> Nushugak River on May 21,<br />
1912 and while waiting to be towed up river heavy storm sprung up<br />
and vessel parted anchor. Had to sail up the river where was beached<br />
on May 22. Was floated on 24th with upper works damaged.<br />
<strong>St</strong>ol<strong>of</strong>, schooner, was run into by <strong>St</strong>eamer Potlach on October 10,<br />
1912 and badly damaged. Was towed to Port Ludlow.<br />
<strong>St</strong>rathalbyn, British steamer, was in collision on January 12, 1912<br />
near Three Tree Point, Puget Sound with <strong>St</strong>eamer Virginian, former<br />
had hole extending near length <strong>of</strong> No. 1 hole in side. Also stern<br />
broken starboard bow stove in collision bulkhead burst and No. 1<br />
hold filled with water.<br />
<strong>St</strong>rathallan, British steamer, at Norfolk, Va., got ashore February<br />
24, 1912. Was floated without damage.<br />
<strong>St</strong>rathdene, British steamer, from Tacoma for Calcutta put into<br />
Victoria, November 19, 1912 in distress. Part <strong>of</strong> deck load lost and<br />
vessel leaking.<br />
<strong>St</strong>rathdon, British steamer, from San Francisco for Melbourne<br />
returned to San Francisco on December 3, account <strong>of</strong> lower piston<br />
breaking.<br />
<strong>St</strong>rathgarry, British steamer, from Tacoma at Newcastle, Australia<br />
March 18, 1912 was damaged by collision with Norwegian Bark<br />
Bannockburn.<br />
<strong>St</strong>rathord, British steamer, lying navy coal bunkers at California<br />
City August 28, 1912 was dismasted by steel arms <strong>of</strong> crane. Main mast<br />
in falling went through pilot house doing much damage.<br />
Talthybius, British steamer, was run into by British <strong>St</strong>eamer<br />
Crown <strong>of</strong> Arragon at Vancouver on April 26, 1912 and had eight<br />
buttresses on starboard side aft buckled and plates bent.<br />
Tamba Maru, Japanese steamer, grounded on Harbor Island on<br />
April 30, 1912. Floated undamaged.<br />
94
Digitized for FRASER<br />
http://fraser.stlouisfed.org/<br />
<strong>Federal</strong> <strong>Reserve</strong> <strong>Bank</strong> <strong>of</strong> <strong>St</strong>. <strong>Louis</strong><br />
M ARIN E C A SU A LTIE S— CONTINUED.<br />
Telegraph, Sound steamer, was run into and sunk at Seattle on<br />
April 25, 1912 by <strong>St</strong>eamer Alameda. Several passengers injured. Was<br />
floated on May 1, and beached at Harbor Island for repairs.<br />
Temple E. Dorr, steamer, at San Francisco June 29, 1912 <strong>of</strong>f Point<br />
Sur, struck a submerged rock on port side amidships causing vessel to<br />
leak slightly.<br />
Thielbek, German ship, from Hamburg for Santa Rosalia put into<br />
Montevideo prior November 29, 1912 in distress. Damaged by heavy<br />
weather.<br />
Tiverton, steamer, went-ashore at Hospital Point entrance <strong>of</strong> V ictoria<br />
on October 22, 1912. Floated leaking slightly and fore foot<br />
gone. Proceeded to Seattle for repairs.<br />
Thos. L. Wand, steamer, returned to Port Towensed December<br />
17, 1912 with deck load shifted and temporary stanchions broken.<br />
Discharged deck load for repairs.<br />
Reproduced from the Unclassified / Declassified Holdings <strong>of</strong> the Nationat Archives<br />
Torrisdale, British ship, at Belfast March 10, 1912 from Oregon<br />
was damaged about decks in heavy weather on voyage.<br />
Umatilla, steamer, ran into wharf at Tacoma December 7, 1912<br />
and was slightly damaged.<br />
Unimak, whaling steamer, ran ashore at Camp Reef on November<br />
7, 1912. Floated on November 8, slightly damaged.<br />
Vadsoe, British steamer, went ashore on October 16, 1912 at Reef<br />
Point Baynes Sound. Was floated and arrived at Vancouver October<br />
26, slightly damaged.<br />
Verona, German steamer, from Oregon for Yokohama put into<br />
Unalaska October 16, 1912 for fuel. When leaving port grounded<br />
floated undamaged.<br />
Vicksburg, U. S. steamer, at Magdalena Bay August 26, 1912, had<br />
hole punched in bottom. Was towed to Mare Island for repairs.<br />
Virginia, schooner, at San Francisco November 16, 1912 had hurricane<br />
on November 9; <strong>of</strong>f Cape Blanco, lost deck load and was damaged<br />
about deck.<br />
Virginian, steamer, was in collision on January 12, 1912 <strong>of</strong>f Three<br />
Tree, Point Puget Sound with British <strong>St</strong>eamer <strong>St</strong>rathalbyn and had<br />
hole 12 feet long on starboard bow and 17 foot hole on port. Was<br />
not damaged below water line. Temporary repairs were made at Seattle<br />
and permanent repairs at San Francisco.<br />
W. G-. Irwin, brig, while in port at San Francisco July 1, 1912<br />
caught fire in lime cargo. Hull and cargo badly damaged.<br />
95
Digitized for FRASER<br />
http://fraser.stlouisfed.org/<br />
<strong>Federal</strong> <strong>Reserve</strong> <strong>Bank</strong> <strong>of</strong> <strong>St</strong>. <strong>Louis</strong><br />
M A R IN E C A SU A LTIE S— CONTINUED.<br />
Sophie Christenson, schooner, from Seattle for Ant<strong>of</strong>ogasta put<br />
into Tahiti on August 8, 1912 leaking. Later returned to Honolulu fo r<br />
repairs.<br />
South Coast, steamer, was in collision on August 21, 1912 <strong>of</strong>f Point<br />
Bonita with <strong>St</strong>eamer Marshfield and had rail and bulwarks stove.<br />
<strong>St</strong>. Helens, steamer, returned to San Francisco October 14, 1912<br />
with bow slightly damaged, having been in collision with Schooner<br />
Dauntless.<br />
<strong>St</strong>andard, ship arrived at mouth <strong>of</strong> Nushugak River on M ay 21,<br />
1912 and while waiting to be towed up river heavy storm sprung up<br />
and vessel parted anchor. Had to sail up the river where was beached<br />
on May 22. Was floated on 24th with upper works damaged.<br />
<strong>St</strong>ol<strong>of</strong>, schooner, was run into by <strong>St</strong>eamer Potlach on October 10,<br />
1912 and badly damaged. Was towed to Port Ludlow.<br />
<strong>St</strong>rathalbyn, British steamer, was in collision on January 12, 1912<br />
near Three Tree Point, Puget Sound with <strong>St</strong>eamer Virginian, former<br />
had hole extending near length <strong>of</strong> No. 1 hole in side. Also stern<br />
broken starboard bow stove in collision bulkhead burst and No. 1<br />
hold filled with water.<br />
<strong>St</strong>rathallan, British steamer, at Norfolk, Va., got ashore February<br />
24, 1912. Was floated without damage.<br />
<strong>St</strong>rathdene, British steamer, from Tacoma for Calcutta put into<br />
Victoria, November 19, 1912 in distress. Part <strong>of</strong> deck load lost and<br />
vessel leaking.<br />
<strong>St</strong>rathdon, British steamer, from San Francisco for Melbourne<br />
returned to San Francisco on December 3, account <strong>of</strong> lower piston<br />
breaking.<br />
<strong>St</strong>rathgarry, British steamer, from Tacoma at Newcastle, Australia<br />
March 18, 1912 was damaged by collision with Norwegian Bark<br />
Bannockburn.<br />
<strong>St</strong>rathord, British steamer, lying navy coal bunkers at California<br />
City August 28, 1912 was dismasted by steel arms <strong>of</strong> crane. Main mast<br />
in falling went through pilot house doing much damage.<br />
Talthybius, British steamer, was run into by British <strong>St</strong>eamer<br />
Crown <strong>of</strong> Arragon at Vancouver on April 26, 1912 and had eight<br />
buttresses on starboard side aft buckled and plates bent.<br />
Tamba Maru, Japanese steamer, grounded on Harbor Island on<br />
April 30, 1912. Floated undamaged.
Digitized for FRASER<br />
http://fraser.stlouisfed.org/<br />
<strong>Federal</strong> <strong>Reserve</strong> <strong>Bank</strong> <strong>of</strong> <strong>St</strong>. <strong>Louis</strong><br />
M A R IN E C A SU A LTIE S— CONTINUED.<br />
Telegraph, Sound steamer, was run into and sunk at Seattle on<br />
April 25, 1912 by <strong>St</strong>eamer Alameda. Several passengers injured. Was<br />
floated on May 1, and beached at Harbor Island for repairs.<br />
Temple E. Dorr, steamer, at San Francisco June 29, 1912 <strong>of</strong>f Point<br />
Sur, struck a submerged rock on port side amidships causing vessel to<br />
leak slightly.<br />
Thielbek, German ship, from Hamburg for Santa Rosalia put into<br />
Montevideo prior November 29, 1912 in distress. Damaged by heavy<br />
weather.<br />
Tiverton, steamer, went ashore at Hospital Point entrance <strong>of</strong> V ictoria<br />
on October 22, 1912. Floated leaking slightly and fore foot<br />
gone. Proceeded to Seattle for repairs.<br />
Thos. L. Wand, steamer, returned to Port Towensed December<br />
17, 1912 with deck load shifted and temporary stanchions broken.<br />
Discharged deck load for repairs.<br />
Torrisdale, British ship, at Belfast March 10, 1912 from Oregon<br />
was damaged about decks in heavy weather on voyage.<br />
Umatilla, steamer, ran into wharf at Tacoma December 7, 1912<br />
and was slightly damaged.<br />
Unimak, whaling steamer, ran ashore at Camp Reef on November<br />
7, 1912. Floated on November 8, slightly damaged.<br />
Vadsoe, British steamer, went ashore on October 16, 1912 at Reef<br />
Point Baynes Sound.* Was floated and arrived at Vancouver October<br />
26, slightly damaged.<br />
Verona, German steamer, from Oregon for Yokohama put into<br />
Unalaska October 16, 1912 for fuel. When leaving port grounded<br />
floated undamaged.<br />
Vicksburg, U. S. steamer, at Magdalena Bay August 26, 1912, had<br />
hole punched in bottom. Was towed to Mare Island for repairs.<br />
Virginia, schooner, at San Francisco November 16, 1912 had hurricane<br />
on November 9, <strong>of</strong>f Cape Blanco, lost deck load and was damaged<br />
about deck.<br />
Virginian, steamer, was in collision on January 12, 1912 <strong>of</strong>f Three<br />
Tree, Point Puget Sound with British <strong>St</strong>eamer <strong>St</strong>rathalbyn and had<br />
hole 12 feet long on starboard bow and 17 foot hole on port. Was<br />
not damaged below water line. Temporary repairs were made at Seattle<br />
and permanent repairs at San Francisco.<br />
W. G. Irwin, brig, while in port at San Francisco July 1, 1912<br />
caught fire in lime cargo. Hull and cargo badly damaged.<br />
95
Digitized for FRASER<br />
http://fraser.stlouisfed.org/<br />
<strong>Federal</strong> <strong>Reserve</strong> <strong>Bank</strong> <strong>of</strong> <strong>St</strong>. <strong>Louis</strong><br />
MARINE CASUALTIES— CONTINUED.<br />
Washington, steamer, after crossing Coos Bay bar on October 31,<br />
1912 was struck by heavy sea; began leaking badly and returned to<br />
Coos for repairs. Also lost about 20 M. <strong>of</strong> deck load.<br />
Wasp, from Aberdeen for San Francisco returned August 16, 1912<br />
leaking badly, pumps unable to keep vessel free. Deck load was discharged<br />
and damage found to be slight.<br />
Wellesley, steamer, out bound from Eureka December 26, 1912,<br />
struck bar heavily. Returned leaking. Deck load discharged and<br />
survey held..<br />
Wellington, British steamer, for San Franeisco March 3, 1912 from<br />
Nanaimo, broke crank pin on voyage. March 5th returned to Victoria<br />
with babbit in main bearing burned out.<br />
Whatcom, Sound steamer, ran ashore at Daugeness on January<br />
23, 1912. Floated on morning <strong>of</strong> 24th, damage slight. Proceeded to<br />
Seattle.<br />
Wilhelmina, power schooner, went ashore at 1 p. m. August 22,<br />
1912, % mile north <strong>of</strong> entrance <strong>of</strong> Suislaw while making port.<br />
Williamette, steamer, from San Francisco at Seattle April 15,<br />
1912, was dry docked with propeller damaged on voyage.<br />
Willapa, steamer, bound out from Astoria for San Pedro, struck<br />
on Columbia River bar on April 21, 1912. Was towed back by Tug .<br />
Fearless with rudder gone, stern post cracked and other damage.<br />
Wm. Benton, schooner, from Salina Cruz for Grays Harbor, put<br />
into San Francisco February 10, 1912, with loss <strong>of</strong> sails and deck<br />
damaged in gale on February 5, 1912 <strong>of</strong>f Point Conception.<br />
Wm. Benton, schooner, bound into San Francisco on December 10,<br />
1912, struck on north shore. Was towed <strong>of</strong>f by fishing boat. Damage<br />
slight.<br />
Wiscombe Park, British ship, from Rochester, Eng., for Vancouver,<br />
put back to <strong>St</strong>anley, F. I. with leaky upper works and cargo damaged.<br />
25 tons <strong>of</strong> cargo was jettisoned; 150 tons was lightered. Several<br />
rivets started in shell plate. <strong>St</strong>eering gear slightly damaged.<br />
Yosemite, steamer, while crossing Grays Harbor bar on October<br />
1, 1912, struck same and damaged rudder. Jury rudder was rigged<br />
and vessel was towed to San Francisco by <strong>St</strong>eamers Klamath and Bee.<br />
Yukon, steamer, from San Francisco for Seattle, collided with<br />
<strong>St</strong>eamer Fairhaven September 14, 1912, <strong>of</strong>f Point Arena during heavy<br />
fog. Damage slight.<br />
!»0
Digitized for FRASER<br />
http://fraser.stlouisfed.org/<br />
<strong>Federal</strong> <strong>Reserve</strong> <strong>Bank</strong> <strong>of</strong> <strong>St</strong>. <strong>Louis</strong><br />
DISTANCES FROM SAN FRANCISCO TO DOMESTIC PORTS<br />
Place.<br />
Miles.<br />
Cape Flattery ...................... 680<br />
Columbia River.................... 545<br />
Douglas Island .................... 1,539<br />
Glacier Bay............................ 1,398<br />
Gol<strong>of</strong>in Bay .......................... 2,757<br />
Grays Harbor ...................... 588<br />
Honolulu ................................ 2,100<br />
Juneau .................................. 1,596<br />
Place.<br />
Miles.<br />
Kotzebue Sound .................^ 2,927<br />
Nome ...................................... 2,731<br />
Portland ................................ 658<br />
Port Clarence ...................... 2,723<br />
Sitka ...................................... 1,302<br />
<strong>St</strong>. Michaels ........................ 2,705<br />
Unalaska .............................. 2,086<br />
DISTANCES FROM SAN FRANCISCO TO FOREIGN PORTS<br />
Place.<br />
Miles. Place.<br />
Miles.<br />
Acajutla ................................ 2,505 M anila_____ .......................... 6,221<br />
Acapulco ................................ 1,833 Marshall Island .................. 4,290<br />
Adelaide ................................ 7,900 ! Marquesas Island ................ 2,988<br />
Ant<strong>of</strong>agasta .......................... 4,762 |Mazatlan................................ 1,337<br />
A p ia ......................................... 4,160 i Melbourne ............................ 7,325<br />
Auckland................................ 5,680 Montevideo............................ 7,500<br />
Brisbane ................................ 6,400 ! Nagasaki................................ 5,269<br />
Calcutta ................................ 9,000 ! Oeos ........................................ 2,348<br />
Callao .................................... 3,987 |Panama .................................. 3,245<br />
Cape San Lucas .................. 1,135 I Port Arthur .......................... 5,477<br />
Capetown .............................. 10,454<br />
Champerico ............................ 2,369<br />
■Punta Arenas (Chile).......... 6,193<br />
I Salina Cruz .......................... 2,135<br />
Coronel .................................. 5,290 JSan Jose de Guatemala........ 2,395<br />
Fiji Islands .......................... 4,662 ' Santa Rosalia ...................... 1,468<br />
Galapagos Islands .............. 3,011 Shanghai ................................ 5,387<br />
Guam ....................................... 5,053 Singapore .............................. 7,353<br />
Guayaquil .............................. 3,514 Sydney.................................... 6,744<br />
Guaymas ................................ 1,466 Tahiti .................................... 3,658<br />
Hiogo .................................... 5,100 Valparaiso ............................ 5,140<br />
Hobart.................................... 7,382 Vladivostok .......................... 4,570<br />
Hongkong .............................. 6,306 j Wellington, N. Z................... 5,909<br />
Iquique .................................. 4,620 ' Yokohama ............................ 4,536<br />
DISTANCE FROM SAN FRANCISCO TO EASTERN AND FOREIGN<br />
PORTS, DIRECT AND VIA PANAMA CANAL<br />
Antwerp ........<br />
Boston .............<br />
Constantinople<br />
Genoa .............<br />
Hamburg ......<br />
Havre ............<br />
Via<br />
Panama<br />
Direct Canal.<br />
.13,603 8,082<br />
.13,073 5,473<br />
.14,352 9,432<br />
.13,399 8,484<br />
.13,870 8,349<br />
.13,412 7,903<br />
Liverpool .......<br />
Marseilles ....... .<br />
Montevideo .....<br />
New Orleans ...<br />
New York ......<br />
Rio de Janeiro.<br />
Panama<br />
Direct Canal.<br />
.13,517 7,830<br />
.13,241 8,326<br />
. 7,556 8,503<br />
.13,524 4,680<br />
.13,107 5,272<br />
. 8,414 7,528<br />
97
Digitized for FRASER<br />
http://fraser.stlouisfed.org/<br />
<strong>Federal</strong> <strong>Reserve</strong> <strong>Bank</strong> <strong>of</strong> <strong>St</strong>. <strong>Louis</strong><br />
List <strong>of</strong> Newspapers on <strong>File</strong> in the Hall <strong>of</strong> the San Francisco Chamber<br />
<strong>of</strong> Commerce<br />
.CALIFORNIA.<br />
ALAMEDA COUNTY....................Alameda Times-<strong>St</strong>ar,. Berkeley Independent,<br />
Oakland Enquirer, Oakland Tribune.<br />
A AT A DOT?. COUNTY.......................lone Echo, Jackson Ledger-Dispatch, Sutter<br />
Creek Record.<br />
BUTTE COUNTY.......................... Chico Enterprise, Oroville Mercury, Oroville<br />
Register,<br />
CALAVERAS COUNTY............... San Andreas Prospect.<br />
COLUSA.............................................Colusa Sun, Chico Enterprise.<br />
CONTRA COSTA COUNTY........ Contra Costa Gazette, Point Richmond Leader.<br />
Record, Herald, Martinez <strong>St</strong>andard.<br />
EL DORADO COUNTY................Georgetown Gazette, Placerville Republican.<br />
FRESNO COUNTY....................... Fresno Herald, Fresno Republican, Fowler<br />
Advocate.<br />
HUMBOLDT COUNTY................. Eureka Times, Eureka <strong>St</strong>andard, Fortuna Advocate,<br />
Eureka Herald.<br />
KERN COUNTY......................... ....Bakersfield Echo, Bakersfield Californian.<br />
KINGS COUNTY..lll----Hanford Sentinel.<br />
LAKE COUNTY............................Lakeport Bee, Lakeport Press.<br />
LASSEN COUNTY...................J....Susanville Advocate, Mail, Big Valley Gazette.<br />
LOS ANGELES COUNTY....... —.Los Angeles Examiner, Los Angeles Express,<br />
Pasadena <strong>St</strong>ar, Tribune <strong>of</strong> Los Angeles, Pomona<br />
Progress.<br />
MADERA COUNTY.......................Madera Mercury, Madera Tribune.<br />
MARIN COUNTY...........................San Rafael Independent.<br />
MARIPOSA COUNTY...................Mariposa Gazette.<br />
MERCED COUNTY....................... Merced Sun, Merced Express, Merced <strong>St</strong>ar.<br />
MENDOCINO COUNTY........... ....Mendocino Beacon, Ukiah Dispatch Democrat,<br />
Times, Republican.<br />
MODOC COUNTY....................... ....Alturas New Record.<br />
MONO COUNTY......................... ....Bridgeport Chronicle-Union.<br />
MONTEREY COUNTY............. ....Salinas Index, Salinas Journal, Democrat,<br />
Monterey American, Watsonville Register.<br />
NAPA COUNTY.............................Napa Journal, Napa Register, <strong>St</strong>. Helena <strong>St</strong>ar.<br />
NEVADA COUNTY.......................Nevada Chronicle, Morning Union.<br />
ORANGE COUNTY.......................Anaheim Gazette, Orange Post.<br />
PLACER COUNTY.................... ....Auburn Herald, Auburn Republican, Newcastle<br />
News.<br />
PLUMAS COUNTY................... ....Quincy Independent.<br />
RIVERSIDE COUNTY................. Riverside Enterprise, Riverside Press.<br />
SACRAMENTO COUNTY............Sacramento Bee, Sacramento Union.<br />
SAN BENITO COUNTY.............. Hollister Free Lance, Advance.<br />
SAN BERNARDINO COUNTY.....San Bernardino Index.<br />
SAN DIEGO COUNTY................. San Diego Union, San Diego Tribune.<br />
SAN JOAQUIN COUNTY........... <strong>St</strong>ockton Record, <strong>St</strong>ockton Independent, <strong>St</strong>ockton<br />
Evening Mail.<br />
SAN LUIS OBISPO COUNTY......San Luis Obispo Tribune.<br />
SAN MATEO COUNTY............... Redwood City Democrat, Redwood City Times-<br />
Gazette, San Mateo Times.<br />
SANTA BARBARA COUNTY.....Santa Barbara Independent.<br />
SANTA CLARA COUNTY_____ San Jose Herald, San Jose Mercury, San Jose<br />
Times, Gilroy Advocate, Gilroy Gazette, Los<br />
Gatos News.<br />
SANTA CRUZ COUNTY._______ Santa Cruz Surf, News.<br />
98
Digitized for FRASER<br />
http://fraser.stlouisfed.org/<br />
<strong>Federal</strong> <strong>Reserve</strong> <strong>Bank</strong> <strong>of</strong> <strong>St</strong>. <strong>Louis</strong><br />
SHASTA COUNTY........................ Redding Courier-Free-Press, Millville Tidings,<br />
Anderson News, Cottonwood Enterprise.<br />
SISKIYOU COUNTY.....................CedaTville Record Weekly, Yreka News, Jour<br />
nal, Dunsmuir Dispatch-News.<br />
SOLANO COUNTY.........................Benicia New Era, Suisun Courier, Vallejo<br />
Chronicle.<br />
SONOMA COUNTY..................— Santa Rosa Press-Democrat, Santa Rosa Republican.<br />
STANISLAUS COUNTY.......... ....Modesto Herald, Modesto News, Oakdale<br />
Graphic.<br />
SUTTER COUNTY.........................Yuba City Farmer, Yuba City Independent.<br />
TEHAMA COUNTY.................. ....Red Bluff People’s Cause, Red Bluff News.<br />
TRINITY COUNTY.......................Weaverville Journal.<br />
TULARE COUNTY........................Visalia Times, Porterville Enterprise.<br />
TULOUMNE COUNTY................Sonora Independent.<br />
VENTURA COUNTY................ ....Ventura Democrat, Santa Paula Chronicle.<br />
YOLO COUNTY.......................... ....Woodland Democrat, Woodland Mail.<br />
YUBA COUNTY..............................Marysville Appeal, Marysville Democrat.<br />
NEVADA.<br />
VIRGINIA CITY............................Chronicle.<br />
LOCKLOCK...................................... Miner.<br />
ROCHESTER....................................Miner.<br />
OREGON.<br />
BAKER C IT Y ................................ Morning Democrat.<br />
EUGENE ........................................ Eugene Register.<br />
HEPPNER ...................................... Heppner Gazette.<br />
KLAMATH .................................... Klamath Republican.<br />
PORTLAND .................................. Oregon Journal, The Oregonian, Telegram.<br />
ROSEBURG .................................... Roseburg Review.<br />
SALEM .............................................Daily Oregon <strong>St</strong>atesman.<br />
SUMPTER ...................................... Blue Mountain American.<br />
MEDFORD........................................ Medford Mail.<br />
WASHINGTON.<br />
PORT TOWNSEND ......................Port Townsend Weekly Ledger.<br />
SEATTLE ...................................... Seattle Post Intelligencer, Seattle Daily<br />
Gazette, Seattle Times, Sun.<br />
TACOMA .........................................Tacoma Ledger, Tacoma News.<br />
CHEHALIS........................................Lewis County Advocate.<br />
SPOKANE........................... ............. Spokesman Review.<br />
ALASKA.<br />
FAIRBANKS....................................Fairbanks News-Miner.<br />
BRITISH COLUMBIA.<br />
VICTORIA........................................ The Colonist.<br />
HAWAIIAN ISLANDS.<br />
HAW AIIAN ISLANDS ..............Honolulu <strong>St</strong>ar and Bulletin, Pacific Commercial<br />
Advertiser, Guide.
Digitized for FRASER<br />
http://fraser.stlouisfed.org/<br />
<strong>Federal</strong> <strong>Reserve</strong> <strong>Bank</strong> <strong>of</strong> <strong>St</strong>. <strong>Louis</strong><br />
CANADA<br />
WINNIPEG.......................................Free Press Telegram.<br />
CALGARY.........................................Herald, News, Telegram.<br />
SASKATOON....................................Phoenix, Moose Jaw, Times.<br />
REGINA....................................... .....Leader, <strong>St</strong>andard.<br />
EDMUNDTON__________________Bulletin, Journal.<br />
BRANDON________________ _____ Times, Sun.<br />
MONTREAL..................................... <strong>St</strong>ar.<br />
ALBERTA......................................... Lethbridge Herald.<br />
TORONTO......................................... News <strong>St</strong>ar.<br />
LETHBRIDGE................................. Herald.<br />
EASTERN PAPERS.<br />
ALABAMA .................................... Birmingham Ledger.<br />
ARIZONA ...................................... Phoenix Gazette, Nogales Yidette.<br />
ARKANSAS .................................. Little Rock Gazette.<br />
COLORADO .................................... Denver Weekly Republican, Denver Post.<br />
GEORGIA ...................................... Atlanta Journal, Atlanta Constitution, Savan<br />
nah News.<br />
ILLINOIS ...................................... Chicago Record-Herald, Cnampaign Gazette,<br />
Chicago Tribune, Chicago Examiner, Centralia<br />
Evening Sentinel, Mattoon Journal-Gazette,<br />
Pekin Post-Tribune, Danville Commercial<br />
News, Joliet Herald, Rock Is. Union.<br />
INDIANA ...................................... Fort Wayne Journal Gazette-Times, Indianapolis<br />
<strong>St</strong>ar, South Bend Tribune.<br />
IOWA ...............................................Dubuque Telegraph-Herald, Des Moines Tribune.<br />
KANSAS .........................................Wichita Eagle, Beacon Topeka Capitol.<br />
KENTUCKY .................................. <strong>Louis</strong>ville Courier-Journal, Post.<br />
LOUISIANA .................................. New Orleans Picayune.<br />
MAINE<br />
......................................... Portland Daily Press, Main <strong>St</strong>ate Press, Portland<br />
Express.<br />
MARYLAND ................................. .Baltimore American, Sun.<br />
MASSACHUSETTS ......................Boston American, Boston Herald, Boston Post,<br />
Springfield Republican, Boston Advertiser, Boston<br />
Transcript, Christian Science Monitor, New<br />
Bedford <strong>St</strong>andard.<br />
MICHIGAN .................................... Flint Journal, Benton Harbor News, Detroit<br />
Free Press Journal, Allegan News.<br />
MINNESOTA ................................ <strong>St</strong>. Paul Pioneer-Press, News, Minneapolis<br />
Journal.<br />
MISSOURI ................................ ....Kansas City Journal, <strong>St</strong>. <strong>Louis</strong> Globe-Democrat,<br />
<strong>St</strong>. <strong>Louis</strong> Post-Dispatch, <strong>St</strong>. <strong>Louis</strong> Times, <strong>St</strong>.<br />
<strong>Louis</strong> Republican.<br />
MONTANA .....................................Butte Miner, Dillon Tribune.<br />
NEBRASKA .................................. Omaha Bee, Omaha News.<br />
NEW YORK .................................. Hay Trade Journal, New York <strong>St</strong>aats Zeitung,<br />
New York Sun, New York Evening Sun, New<br />
York Journal <strong>of</strong> Commerce, New York World,<br />
New York Herald, New York Tribune, New<br />
York Times, New York Commercial, New York<br />
Journal, Albany Times-Union, Buffalo Express.<br />
NORTH CAROLINA......................Charlotte Observer.<br />
OKLAHOMA.................................... Muskogee Phoenix.<br />
OHIO ...............................................^.Cleveland Press, News, Plain Dealer, Cincinnati<br />
Price Current, Columbus Dispatch, Pittsburg<br />
Dispatch, Dayton News.<br />
100
Digitized for FRASER<br />
http://fraser.stlouisfed.org/<br />
<strong>Federal</strong> <strong>Reserve</strong> <strong>Bank</strong> <strong>of</strong> <strong>St</strong>. <strong>Louis</strong><br />
PEN NSYLVANIA ........................Philadelphia Press, Philadelphia Telegraph,<br />
Philadelphia Ledger, Wilkesbarre Times, Philadelphia<br />
Commercial Price List, Enquirer, North<br />
American Record, York Gazette.<br />
RHODE ISLAND .......................... Woonsocket Call, Providence Journal.<br />
SOUTH CAROLINA ....................Charleston News and Courier, Post.<br />
TENNESSEE ................................ Memphis Commercial Appeal.<br />
TEXAS .............................................El Paso Herald.<br />
UTAH ...............................................Salt Lake Tribune.<br />
WASHINGTON, D. C................... Post.<br />
FOREIGN PAPERS.<br />
AUSTRALIA.<br />
MELBOURNE .............................. Melbourne Argus.<br />
SYDNEY ........................................ Sydney Evening News, Sydney Telegraph,<br />
Commercial News (shipping), Australian <strong>St</strong>ar.<br />
Reproduced from the Unclassified I Declassified Holdings <strong>of</strong> the National Archives<br />
WELLINGTON........... ....................Post.<br />
NEW ZEALAND.<br />
CHINA.<br />
HONG KONG ............................... .Hong Kong Daily Press.<br />
. JAPAN.<br />
YOKOHAMA<br />
................................ Japan Daily Gazette, Japan Weekly Gazette,<br />
Japan Weekly Mail, Japan Herald.<br />
ENGLAND.<br />
LONDON .........................................London Times.<br />
LIVERPOOL .................................. Liverpool Journal <strong>of</strong> Commerce, Corn Trade<br />
News.<br />
SCOTLAND.<br />
GLASGOW ...................................... Glasgow Weekly Herald.<br />
MISCELLANEOUS.<br />
Tariff Act.<br />
Philippine Act.<br />
Bulletin and Circular Price Lists.<br />
U. S. Government Public Documents.<br />
101
Digitized for FRASER<br />
http://fraser.stlouisfed.org/<br />
<strong>Federal</strong> <strong>Reserve</strong> <strong>Bank</strong> <strong>of</strong> <strong>St</strong>. <strong>Louis</strong><br />
TELEGRAPH CODES.<br />
A One.<br />
A B C Code.<br />
ABC, Fifth Edition.<br />
J. K. Armsbv, 1911.<br />
Bedford-McNeil Mining and General Telegraph Code.<br />
Lieber’s <strong>St</strong>andard Telegraphic Code.<br />
Lieber’s <strong>St</strong>andard Telegraphic Terminal Index.<br />
Lieber’s Manual for January, 1906.<br />
Lieber’s Manual for October, 1907.<br />
Moreing and Neal Mining Telegraphic Code.<br />
Scott’s Code.<br />
Watkins Universal Shipping Code. Revised Edition, 1904.<br />
International Cable Directory <strong>of</strong> Addresses.<br />
SHIPPING REGISTERS.<br />
Det Norske Veritas Skibs Register.<br />
Det Norske Veritas Rules and Regulations.<br />
British Corporation.<br />
Bureau Veritas Register.<br />
Bureau Veritas Repertoire General Sailing Vessels.<br />
Bureau Veritas Repertoire General <strong>St</strong>eamers.<br />
Germanischer Lloyd Internationales Register.<br />
Lloyds Register <strong>St</strong>eam Vessels.<br />
Lloyds Register Sailing Vessels.<br />
Lloyds Register, Appendix.<br />
Lloyds Register Rules and Regulations.<br />
Records <strong>of</strong> American and Foreign Shipping.<br />
List <strong>of</strong> Vessels Owned on the Pacific Coast.<br />
List <strong>of</strong> Merchant Vessels <strong>of</strong> the United <strong>St</strong>ates.<br />
DIRECTORIES.<br />
BOSTON<br />
CANADA (Buyers’ Guide).<br />
LOS ANGELES.<br />
CALIFORNIA (Mercantile).<br />
NEW YORK.<br />
“ ‘ ‘ (Business).<br />
OAKLAND, ALAMEDA AND<br />
BERKELEY.<br />
HONOLULU AND HAW AII<br />
CHINA & MANILA.<br />
EXPORTERS DIRECTORY<br />
OF JAPAN.<br />
PORTLAND.<br />
SAN FRANCISCO.<br />
SEATTLE.<br />
TACOMA.<br />
WORLD TRADE.<br />
102
ALAMEDA COUNTY.<br />
AMADOR COUNTY.<br />
BUTTE COUNTY.<br />
BAY COUNTIES.<br />
CONTRA COSTA COUNTY.<br />
CALAVARAS COUNTY.<br />
COLUSA COUNTY.<br />
DEL NORTE COUNTY.<br />
EL DORADO COUNTY.<br />
FRESNO COUNTY.<br />
FEATHER RIVER CHART.<br />
GLENN COUNTY.<br />
HUMBOLDT COUNTY.<br />
KINGS COUNTY.<br />
KERN COUNTY.<br />
LAKE COUNTY.<br />
MENDOCINO COUNTY.<br />
MARIPOSA COUNTY.<br />
MERCED COUNTY.<br />
MADERA COUNTY.<br />
MONTEREY COUNTY.<br />
NAPA COUNTY.<br />
OREGON (<strong>St</strong>ate).<br />
PLUMAS AND SOLANO COUNTY.<br />
SACRAMENTO COUNTY.<br />
SANTA BARBA.RA—LOS ANGELES<br />
SAN BENITO COUNTY.<br />
MAPS AND CHARTS.<br />
SAN JOAQUIN COUNTY.<br />
SAN LUIS OBISPO COUNTY.<br />
SANTA CRUZ COUNTY.<br />
SAN MATEO COUNTY.<br />
STANISLAUS COUNTY.<br />
SONOMA COUNTY.<br />
SOLANO COUNTY.<br />
SOUTHERN CALIFORNIA.<br />
SANTA CLARA COUNTY’ .<br />
STATE OF CALIFORNIA.<br />
SAN FRANCISCO (Map).<br />
SACRAMENTO RIVER (Chart).<br />
SAN JOAQUIN RIVER (Chart).<br />
SACRAMENTO RIVER (Upper).<br />
SAN FRANCISCO WATERFRONT.<br />
SUTTER COUNTY.<br />
TEHAMA COUNTY.<br />
TULARE COUNTY.<br />
TUOLUMNE.<br />
U. S. FOREST RESERVE.<br />
VENTURA COUNTY.<br />
WORLD TRACT (Chart).<br />
WORLD (Map).<br />
WASHINGTON (<strong>St</strong>ate).<br />
YOLO COUNTY.<br />
YUBA COUNTY.<br />
SISKIYOU COUNTY<br />
Reproduced from the Unclassified I Declassified Holdings <strong>of</strong> the Nationat Archives<br />
ATLAS.<br />
MERCANTILE MARINE ATLAS OF WORLD.<br />
RAND-McNALLY ATLAS OF WORLD.<br />
MISCELLANEOUS MAGAZINES AND TRADE PUBLICATIONS<br />
American Grower <strong>of</strong> New York.<br />
American Lumberman <strong>of</strong> Chicago.<br />
West Coast Lumberman <strong>of</strong> Tacoma.<br />
Pacific Lumber Trade Journal <strong>of</strong> Seattle.<br />
Northwestern Miller <strong>of</strong> Minneapolis.<br />
Modern Miller <strong>of</strong> <strong>St</strong>. <strong>Louis</strong>, Mo.<br />
American Elevator and Grain Trade <strong>of</strong> Chicago.<br />
California Country Journal <strong>of</strong> San Francisco.<br />
Wisconsin Agriculturist <strong>of</strong> Racine, Wis.<br />
Orchard and Farm <strong>of</strong> San Francisco.<br />
Coast <strong>Bank</strong>er <strong>of</strong> San Francisco.<br />
News Letter <strong>of</strong> San Francisco.<br />
Pacific Wine and Spirit Review <strong>of</strong> San Francisco.<br />
Furniture and Trade <strong>of</strong> New York.<br />
Wholesalers and Retailers Review <strong>of</strong> San Francisco.<br />
Grocers Advocate <strong>of</strong> San Francisco.<br />
Pacific Fisherman <strong>of</strong> Seattle.<br />
Commercial and Financial Chronicle <strong>of</strong> New York.<br />
Pacific Coast Merchant <strong>of</strong> San Francisco.<br />
Building Age <strong>of</strong> New York.<br />
Marine Journal <strong>of</strong> New York.<br />
Railway and Marine News <strong>of</strong> Seattle.<br />
National Geographical Magazine <strong>of</strong> Washington, D. C.<br />
American Forestry <strong>of</strong> Washington, D. C.<br />
103<br />
Digitized for FRASER<br />
http://fraser.stlouisfed.org/<br />
<strong>Federal</strong> <strong>Reserve</strong> <strong>Bank</strong> <strong>of</strong> <strong>St</strong>. <strong>Louis</strong>
Digitized for FRASER<br />
http://fraser.stlouisfed.org/<br />
<strong>Federal</strong> <strong>Reserve</strong> <strong>Bank</strong> <strong>of</strong> <strong>St</strong>. <strong>Louis</strong><br />
CUSTOMS DISTRICT OF THE POET OF SAN FRANCISCO, CAL<br />
The Customs District <strong>of</strong> the Port <strong>of</strong> San Francisco comprises all<br />
that portion <strong>of</strong> the <strong>St</strong>ate <strong>of</strong> California north <strong>of</strong> the Counties <strong>of</strong> Santa<br />
Barbara, with the exception <strong>of</strong> Humboldt and Del Norte, which form<br />
the Customs District <strong>of</strong> Eureka.<br />
The principal <strong>of</strong>ficers <strong>of</strong> the Customs Service at San Francisco are<br />
as follows:<br />
Frederick S. <strong>St</strong>ratton.................................... Collector <strong>of</strong> Customs<br />
William B. Hamilton..............................Special Deputy Collector<br />
Duncan E. McKinlay.................................... Surveyor <strong>of</strong> Customs<br />
Chas. A. <strong>St</strong>ephens.................................... Special Deputy Surveyor<br />
George <strong>St</strong>one................................................................. Naval Officer<br />
E. W. Maslin...................................................Deputy Naval Officer<br />
John G. Mattos..................................................................... Appraiser<br />
W. J. McBride...............................................Chief Boarding Officer<br />
The ordinary entrance fees for vessels arriving from foreign ports<br />
with cargo are $5.70 for foreign vessels and $2.70 for American vessels.<br />
The ordinary clearance fees for vessels going to foreign ports,<br />
either American or foreign vessels are $2.70.<br />
Foreign vessels entering from a domestic port are charged a fee<br />
<strong>of</strong> $2.00; likewise a fee <strong>of</strong> $2.00 for clearing to a domestic port.<br />
U. S. INSPECTOR OF STEAM VESSELS.<br />
Office, U. S. Customs House.<br />
John K. Bulger...............................................Supervising Inspector<br />
James Guthrie...........................................Local Inspector, Boilers<br />
Jos. P. Dolan........................^....................... Local Inspector, Hulls<br />
U. S. SHIPPING COMMISSIONER<br />
Office, U. S. Appraisers Building.<br />
Walter McArthur.............................. .......................... Commissioner<br />
Joseph F. Curtin........................................................... Chief Deputy<br />
U. S. IMMIGRATION SERVICE.<br />
Office, Angel Island.<br />
Samuel W. Backus.........................................................Commissioner<br />
U. S. QUARANTINE SERVICE<br />
Office, Angel Island.<br />
Dr. M. W. Glover........... Surgeon, U. S. M. H. Service in Charge<br />
U. S. LIGHTHOUSE ESTABLISHMENT<br />
Office, U. S. Customs House.<br />
H. W. Rhodes..........................................................................Inspector<br />
U. S. REVENUE CUTTER SERVICE<br />
Office, U. S. Customs House.<br />
Captain J. L. Sill.............................................................In Charge<br />
U. S. LIFE-SAVING SERVICE<br />
Office, U. S. Customs House.<br />
Captain. J. H. Quinan.....................................................Inspector<br />
Capt. Otto Wellander........................................ ..Superintendent<br />
STATE BOARD OF HARBOR COMMISSIONERS.<br />
Office, Ferry Building.<br />
J. J. Dwyer....................................................................... President<br />
J. H. McCallum.........................................................Commissioner<br />
Thos. Williams ......................................................... Commissioner<br />
Leo V. Merle..................................................................... Secretary<br />
104
Digitized for FRASER<br />
http://fraser.stlouisfed.org/<br />
<strong>Federal</strong> <strong>Reserve</strong> <strong>Bank</strong> <strong>of</strong> <strong>St</strong>. <strong>Louis</strong><br />
PILOT COMMISSIONERS, PORT OF SAN FRANCISCO, CAL.<br />
Office, Merchants Exchange Building.<br />
H. C. Howard..................................................................... President<br />
Wm. T. Lewis<br />
Chas. Mayo<br />
Hugh M. Burke.................................................................Secretary<br />
John W. Wallace...........1...............................................Port Agent<br />
RATES OF PILOTAGE<br />
IN AND OUT OF PORT OF SAN FRANCISCO, CAL.<br />
All vessels under five hundred (500) tons, three ($3.00) dollars per<br />
foot draught; all vessels over five hundred (500) tons, three ($3.00)<br />
dollars per foot draught and three (3c) cents per ton for each and<br />
every ton registered measurement; and every vessel spoken inward<br />
or outward bound, except as hereinafter provided, shall pay the said<br />
rates. A vessel is spoken by day by a pilot boat displaying a Union<br />
Jack, or by night by displaying a torch or flare-up within a distance<br />
<strong>of</strong> three (3) miles <strong>of</strong> the vessel. In all cases where inward-bound<br />
vessels are not spoken until inside the bar, the rates <strong>of</strong> pilotage herein<br />
provided shall be reduced fifty (50) per cent. Vessels engaged in the<br />
whaling or fishing trades shall be exempt from all pilotage except<br />
where a pilot is actually employed.<br />
Any vessel in tow <strong>of</strong> steam-tug between the harbor <strong>of</strong> San Francisco<br />
and the ports <strong>of</strong> Mare Island, Vallejo, or Benicia, shall be exempt<br />
from all charges for pilotage, unless a pilot be actually employed.<br />
All vessels sailing under an enrollment, and licensed and engaged<br />
in the coasting trade between the ports <strong>of</strong> San Francisco and any other<br />
port <strong>of</strong> the United <strong>St</strong>ates shall be exempt from all pilotage unless a<br />
pilot be actually employed. All foreign vessels and all vessels from a<br />
foreign port or bound thereto, and all vessels sailing under a register<br />
between the port <strong>of</strong> San Francisco and any other port <strong>of</strong> the United<br />
<strong>St</strong>ates shall be liable for pilotage.<br />
Reproduced from the Unclassified / Declassified Holdings <strong>of</strong> the Nationat Archives<br />
RATES FOR DOCKAGE AT SAN FRANCISCO<br />
The Chief or Assistant Chief Warfinger alone assigns berth to<br />
vessels. Office foot <strong>of</strong> Washington street, south side.<br />
All vessels, steam or sail 200 tons or less, 2 cents per ton; over 200<br />
tons, $4 for first 200 tons and % <strong>of</strong> a cent for each additional ton,<br />
barges same rate.<br />
Lighters 1 cent per ton a day.<br />
Vessels while taking in cargo, or receiving or discharging ballast,<br />
or being idle, or occupying outside berths, or moored in docks, slip,<br />
basins or canals are subject only to half rates <strong>of</strong> dockage; provided<br />
that vessels not used for arraying freight or passengers shall not be<br />
entitled to such half rates.<br />
Dockage commences when vessels make fast. Parts <strong>of</strong> a day are<br />
counted as full days. Every day in the year is charged for.<br />
Vessels leaving wharves without paying charges will be put on<br />
black list, and must pay double the regular rates and $10 fine before<br />
they can dock again.<br />
Merchandise cannot remain over 24 hours on the wharf except by<br />
permission from the wharfinger. If not removed within 24 hours after<br />
notice, will be removed and stored at the risk and expense <strong>of</strong> the owner<br />
or consignee, or sold at auction. No merchandise for outward ship<br />
105
Digitized for FRASER<br />
http://fraser.stlouisfed.org/<br />
<strong>Federal</strong> <strong>Reserve</strong> <strong>Bank</strong> <strong>of</strong> <strong>St</strong>. <strong>Louis</strong><br />
ments shall bo placed upon any wharf before day preceding the arrival<br />
<strong>of</strong> the vessel to carry such merchandise, without permission from the<br />
Chief Wharfinger.<br />
Lumber discharged from vessels carrying 500 M or over, may<br />
remain on wharf 3 days following its discharge.<br />
Tolls on merchandise (except where otherwise specified), a ton,<br />
2,000 pounds, 40 cubic feet, 5 cents.<br />
Coal, railroad iron, pig iron, gypsum, asphaltum, ores, crude or<br />
boiled sulphur, paving stones, sand, gravel, ballast, crushed rock, (long<br />
ton), 5 cents.<br />
Agricultural implements (wheeled vehicles set up), 10 cents.<br />
Grain, flour, millstuffs, beans and seeds at Sea Wall-2, free for first<br />
3 days after discharge; 5 cents per ton for next 15 days or any part<br />
there<strong>of</strong>, Sundays and Holidays excepted; for each additional day thereafter<br />
5 cents per ton.<br />
Hay, 10 cents per ton.<br />
Lumber— fir, redwood, spruce and all s<strong>of</strong>t wood and railroad ties<br />
per 1,000 feet, posts per 100, shingles per 40 bundles, laths per 60<br />
bundles, shakes per 100 bundles, 10 cents; hardwood per 1,000 feet,<br />
20 cents; piles, 6 cents each.<br />
Cord-wood, tan-bark and stave bolts per cord, 5 cents.<br />
Bricks (other than fire bricks) per 1,000, 10 cents. Fire bricks, 15<br />
cents. Bricks (other than fire bricks), discharged from one vessel or<br />
lighter to another at a wharf, 5 cents per 1,000. Fire bricks discharged<br />
from one vessel or lighter to another at a wharf, 7% cents per 1,000.<br />
Charcoal, 35 sacks (<strong>of</strong> 55 pounds each), cement, 5 barrels, lime 8<br />
barrels, sugar, syrup, beef, pork or fish, 6 barrels to the ton, 5 cents.<br />
Cattle, horses and mules, 5 cents; colts and calves, 2y2 cents; sheep<br />
and hogs, 1 cent.<br />
Wool and cotton in sacks, 1 cent; wool and cotton in bales, 1%<br />
cents.<br />
Hides, % cent; sheep, goat, deer and seal skins, 16 for 1 cent.<br />
Empty barrels, under 16 gallons, cents, 16 gallons or over, %<br />
cents each.<br />
Headers and Separators, each 20 cents.<br />
Hops, 1 cent per bale.<br />
Wines or liquors, 1*4 cents per bbl., 5 cents per pipe.<br />
Cocoanuts unhusked, 15 cents per 1,000, husked 10 cents per 1,000.<br />
Bananas, % cents per bunch.<br />
Empty packages, being returned to owner, no tolls charged.<br />
Loads exceeding 7% tons, except single packages, will not be allowed<br />
on the wharf.<br />
106
FOREIGN CONSULS<br />
Argentine— Boutwell Ihnilnn, Consul, First Nat. Bnnlt Bldg.<br />
Austria-Hungary— Dr. Joseph Goriear, Consul, 211 California <strong>St</strong>.<br />
Belgium— Francis Drion, Consul-General, 311 California <strong>St</strong>.<br />
Bolivia— Carlos Sanjines, Consul-General, 235 Montgomery <strong>St</strong>.<br />
Brazil— Archibald Barnard, Yiee-Consul, Monadnock Bldg.<br />
Chile— Arturo Lorca, Consul-General, 311 California <strong>St</strong>.<br />
China— Li Yung Yew, ConsulrGeneral, Cor. Clay and <strong>St</strong>ockton <strong>St</strong>s.<br />
Colombia— Raphial J. Prieto, Consul, 948 Market <strong>St</strong>.<br />
Costa Rica— P. de Obarrio, Consul-General, 510 Battery <strong>St</strong>.<br />
Denmark— J. E. Boggild, Consul-General, Mills Bldg.<br />
Ecuador— Max Marin, Consul-General, 510 Battery <strong>St</strong>.<br />
France— Raphael Monnet, Consul-General, 108 Sutter <strong>St</strong>.<br />
German Empire— Franz Bopp, Consul, 201 Sansome <strong>St</strong>.<br />
Great Britain— Alex. Carnegie Ross, Consul-General, 268 Market <strong>St</strong>.<br />
Greece— Richard de Fontana, Consul, 693 Market <strong>St</strong>.<br />
Guatemala— Juan Padilla, Consul-General, 235 Montgomery <strong>St</strong>.<br />
Honduras— Fernando Somaza Vivas, Consul-General 1205 Leavenworth.<br />
Italy—F. Daneo, Consul-General, 135 <strong>St</strong>ockton <strong>St</strong>.<br />
Japan— Y. Numano, Acting Consul-General, 221 Sansome <strong>St</strong>.<br />
Liberia— Ray P. Saffold, Consul, 568 Golden Gate Ave.<br />
Mexico— Ant. L. Grajeda, Consul, 619 Monadnock Bldg.<br />
Monaco— Ray P. Saffold, Consul, 569 Golden Gate Ave.<br />
Netherlands— G. J. G. Marsily, Consul, 628 Montgomery <strong>St</strong>.<br />
Nicaragua—Adolfo Vivas, Consul-General, Insurance Bldg.<br />
Norway—Henry Lund, Consul, 214 Front <strong>St</strong>.<br />
Panama—P. de Obarrio, Consul, 510 Battery <strong>St</strong>.<br />
Peru— Enrique Grau, Consul, 510 Battery <strong>St</strong>.<br />
Portugal— S. Le da Silva Ferreira, Consul, 347 Front <strong>St</strong>.<br />
Russia— Pierre Rogestvensky, Consul-General, 461 Market <strong>St</strong>.<br />
Salvador— E. Mejia, Consul-General, 460 Montgomery <strong>St</strong>.<br />
Spain— Valle de Salazar, Consul General, 817 Pacific Bldg.<br />
Sweden—William Matson, Consul, 268 Market <strong>St</strong>.<br />
Switzerland— Antoine Borel, Consul, 440 Montgomery <strong>St</strong>.<br />
Turkey— M. A. Hall, Acting Consul, 250 Powell <strong>St</strong>.<br />
Uruguay— O. M. Goldaracena, Consul, 4 Columbus Ave.<br />
Venezuela— Joseph L. Eastland, Consul, Merchants Exchange.<br />
Reproduced from the Unclassified I Declassified Holdings <strong>of</strong> the National Archives<br />
107<br />
Digitized for FRASER<br />
http://fraser.stlouisfed.org/<br />
<strong>Federal</strong> <strong>Reserve</strong> <strong>Bank</strong> <strong>of</strong> <strong>St</strong>. <strong>Louis</strong>
INDEX<br />
Page.<br />
Asphalt, production <strong>of</strong> ........................................................................... 65<br />
Assessed Values— San Francisco ......................................................... 5<br />
<strong>Bank</strong> Clearings— San Francisco ......... .................................................. 8<br />
<strong>Bank</strong>ing <strong>St</strong>atistics— San Francisco ..................................... ............... 8-9<br />
<strong>Bank</strong>s, Savings— San Francisco ........................................................... 8<br />
<strong>Bank</strong>s, National— San Francisco ......................................................... 8<br />
<strong>Bank</strong>s, Commercial— San Francisco ..................................................... 9<br />
Barley— Highest and lowest prices No. 1 Feed..........................38, 39, 40<br />
Barley, shipments from San Francisco............................................ 42<br />
Barley— spot prices ................................................................................. 40<br />
Barley, acreage and production............................................................. 45<br />
Beans, shipments from California....................................................... 45<br />
Bituminous rock, production o f............................................................. 65<br />
Bonded Indebtedness <strong>of</strong> San Francisco............................................ 5<br />
Borax, production o f................................................................... ............ 65<br />
Brandy, California ................................................................... .............. 23<br />
Building Operations— San Francisco................................................... 5<br />
Butter, Eggs and Cheese quotations ................................................ 68<br />
California Property ................................................................................. 62<br />
Canned Fruit ............................................ ............................................... 58-59<br />
Canned Salmon ........................................................................................ 24-25<br />
Canned "Vegetables .................................................................................. 58-59<br />
Cement, production o f............................................................................. 66<br />
Cereal <strong>St</strong>atistics ...................................................................................... 37<br />
Charts and Maps...................................................................................... 103<br />
Cheese Quotations .................................................................................. 68<br />
Clay Brick, production o f....................................................................... 66<br />
Clay (Pottery), production o f............................................................. 64<br />
Clearances from San Francisco............................................................. 37<br />
Climatological Data ................................................................. .............. 69-76<br />
Coal, receipts <strong>of</strong> ...................................................................................... 50<br />
Coal, production <strong>of</strong> .................................................................................. 64<br />
Coke, receipts <strong>of</strong> ........................................................................ ............. 51<br />
C<strong>of</strong>fee— Exports and Imports ........................................... ................... 20<br />
Coinage for 1912 .......................................... ................................... ....... 9<br />
Coinage—Total by U. S. Mint in San Francisco............................ 10<br />
Commercial <strong>Bank</strong>s .................................................................................. 9<br />
Consuls— Foreign ...................................................................................... 107<br />
Copper, production <strong>of</strong> ............................................................................. 65<br />
Reproduced from the Unclassified / Declassified Holdings <strong>of</strong> the National Archives<br />
109<br />
Digitized for FRASER<br />
http://fraser.stlouisfed.org/<br />
<strong>Federal</strong> <strong>Reserve</strong> <strong>Bank</strong> <strong>of</strong> <strong>St</strong>. <strong>Louis</strong>
Digitized for FRASER<br />
http://fraser.stlouisfed.org/<br />
<strong>Federal</strong> <strong>Reserve</strong> <strong>Bank</strong> <strong>of</strong> <strong>St</strong>. <strong>Louis</strong><br />
INDEX<br />
Page<br />
Crude Oil .................................................................................................... 60-61<br />
Customs District, Port <strong>of</strong> San Francisco.............................................104-105<br />
Customs Receipts...................................................................................... 12<br />
Directories ................................................................................................ 102<br />
Distances from San Francisco............................................................. 97<br />
Dockage Rates .......................................................................................... 105-106<br />
Egg Quotations ........................................................................................ 68<br />
Exports and Imports......................................................................13-15; 26-32<br />
Exports and Imports—Foreign Countries ......................................... 14<br />
Exports to Atlantic Ports...................................................................... 28<br />
Exports to Foreign Ports ................................................................. 13; 26-27<br />
Exports to Hawaiian Islands ............................................................... 34-35<br />
Exports— All Countries .......................................................................... 14<br />
Exports— California Wines ................................................................. 22<br />
Exports— California Brandy.................................................................. 23<br />
Exports— Canned Salmon ..................................................................... 24-25<br />
Exports— C<strong>of</strong>fee ....................................................... *............................... 20<br />
• Exports— Crude Oil ........................................................... ...................... 60<br />
Exports—Flour ........................................................ ................................ 37<br />
Exports— Lumber .................................................................................... 46<br />
Exports— Oriental Countries ............................................................... 16<br />
Exports— Quicksilver ............................. ................................................ 18<br />
Exports— Rice .......................................................................................... 17<br />
Exports— Sugar ........................................................................................ 18<br />
Exports— Summary .................................................................................. 15<br />
Exports— Tea ............................................................................................ 19<br />
Exports from San Francisco with Destination................................ 30-32<br />
Export Wheat, Flour and Barley from San Francisco—<br />
Destination ............................................................................ 42-43<br />
<strong>Federal</strong> Officers in San Francisco.........................................................104-105<br />
Flour in California .................................................................................. 36<br />
Flour Shipments from San Francisco ................................................. 37<br />
Foreign Consuls in San Francisco ....................................................... 107<br />
Fruit (fresh) shipments ........................................................................ 57<br />
Fruit (citrus) shipments ........................................................................ 57<br />
Fruit (cured) output .............................................................................. 59<br />
Fruit (canned) and vegetable pack..................................................... 58-59<br />
Gold production in California ............................................................. 63<br />
Grain in California .................................................................................. 44<br />
Grain receipts at San Francisco ......................... ............................... 36<br />
Granite, production <strong>of</strong> ______________________________________ ___ 67<br />
Gypsum, production <strong>of</strong> ________________________________________ 64<br />
Hop Crops ---------------------------------------------------------------------------------- 21<br />
Hops— Exports from San Francisco_____________________________ 20<br />
Imports ------------------------------------------------------------------------13-14; 29-32; 41<br />
110
INDEX<br />
Page<br />
Imports— All Countries .......................................................................... 13-14<br />
Imports— C<strong>of</strong>fee ........................................................................................ 20<br />
Imports— Free and Dutiable................................................................. 13<br />
Imports— Merchandise by Sea from Eastern and Foreign Ports 29<br />
Imports— From Interior; California Coast, Oregon, Washington<br />
and Alaska ............................................................................ 33<br />
Imports— From Hawaiian Islands....................................................... 34-35<br />
Imports— By Sea from Oregon and Washington.............................. 41<br />
Imports— Oriental Countries ................................................................. 16<br />
Imports— Eice .......................................................................................... 17<br />
Imports—Sugar ........................................................................................ 18<br />
Imports— Summary .................................................................................. 15<br />
Imports— Tea ............................................................................................ 19<br />
Imports— Treasure .................................................................................... 10<br />
Insurance .................................................................................................... 55<br />
Internal Revenue Collections ................................... ........................... 56<br />
Lead, production o f .................................................................................. 67<br />
Lime, production <strong>of</strong> ................................................................................ 67<br />
Lumber— Receipts and Exports ..................................................... 46-47<br />
Lumber— Charter Rates .......................................................................... 48-49<br />
Manufacturing <strong>St</strong>atistics <strong>of</strong> San Francisco....................................... 6<br />
Maps and Charts...................................................................................... 103<br />
Marble, production o f .............................................................................. 66<br />
Marine Casualties— Total Loss ........................................................... 77-79<br />
Marine Casualties—Partial Loss ......................................................... 79-96<br />
Mineral (California) production ......................................................... 63-67<br />
Mineral Water, production <strong>of</strong> ............................................................. 66<br />
Mortgages .................................................................................................. 6<br />
National <strong>Bank</strong>s ........................................................................................ 8<br />
Naval Construction .................................................................................. 54<br />
Newspapers on F ile .................................................................................. 98-101<br />
Oil (Crude), exports by sea................................................................. 60<br />
Oil (Crude), production .......................................................................... 60<br />
Oil (Crude), production by wells and districts................................ 61<br />
Oriental Trade— Exports and Imports............................................... 16<br />
Passenger Traffic by Water, 1911......................................................... 7<br />
Pig Iron— Receipts <strong>of</strong> Foreign............................................................. 51<br />
Pilot Commissioners— Port <strong>of</strong> San Francisco.................................... 105<br />
Pilotage Rates .......................................................................................... 105<br />
Postal Receipts— San Francisco ......................................................... 5<br />
Population— San Francisco ................................................................. 6<br />
Quicksilver ................................................................................................ 18<br />
Rainfall at San Francisco..................................................................... 70<br />
Rainfall at <strong>St</strong>ations in California......................................................... 75<br />
Raisin Pack .............................................................................................. 59<br />
Reproduced from the Unclassified I Declassified Holdings <strong>of</strong> the National Archives<br />
111<br />
Digitized for FRASER<br />
http://fraser.stlouisfed.org/<br />
<strong>Federal</strong> <strong>Reserve</strong> <strong>Bank</strong> <strong>of</strong> <strong>St</strong>. <strong>Louis</strong>
Digitized for FRASER<br />
http://fraser.stlouisfed.org/<br />
<strong>Federal</strong> <strong>Reserve</strong> <strong>Bank</strong> <strong>of</strong> <strong>St</strong>. <strong>Louis</strong><br />
INDEX<br />
Page<br />
Bates <strong>of</strong> Pilotage .................................................................................... 105<br />
Rates <strong>of</strong> Dockage ....................................................................................105-106<br />
Receipts <strong>of</strong> Coal........................................................................................ 50<br />
Receipts <strong>of</strong> Coke...................................................................................... 51<br />
Receipts <strong>of</strong> Grain and Produce at San Francisco............................ 36<br />
Receipts <strong>of</strong> Lumber ................................................................................ 47<br />
Receipts <strong>of</strong> Pig Iron ................................................................................ 51<br />
Report <strong>of</strong> Flour and Grain remaining in California........................ 44<br />
Rice— Exports and Imports ................................................................. 17<br />
Salmon (Canned) Comparative <strong>St</strong>atement .................................... 25<br />
Salmon (Canned) Exports from San Francisco................................ 24<br />
Salmon Receipts <strong>of</strong> .................................................................................. 24<br />
Salt, production <strong>of</strong> .................................................................................. 64<br />
Savings <strong>Bank</strong>s .......................................................................................... 8<br />
School Census Figures <strong>of</strong> San Francisco............................................. 7<br />
Shipbuilding .............................................................................................. 54<br />
Shipping Registers .................................................................................. 102<br />
Silver Production in California ........................................................... 63<br />
<strong>St</strong>ate Board <strong>of</strong> Harbor Commissioners ............................................... 104<br />
Sugar— Exports and Imports ............................................................... 18<br />
Tea— Exports and Imports..................................................................... 19<br />
Telegraph Codes ...................................................................................... 102<br />
Temperature at <strong>St</strong>ations in California ............................................. 76<br />
Tonnage Movement ................................................................................ 52-53<br />
Trade Summary ........................................................................................ 15<br />
Treasure Imports at San Francisco ..................................................... 10<br />
Treasure Shipments by Sea................................................................... 11<br />
II. S. Immigration Service..................................................................... 104<br />
U. S. Inspectors <strong>St</strong>eam Vessels............................................................. 104<br />
U. S. Life Saving Service ...................................................................... 104<br />
U. S. Lighthouse Establishment, 18 Districts.................................... 104<br />
U. S. Quarantine Service ....................................................................... 104<br />
Vegetable Pack ...................................................................................... 58<br />
Whalebone, Receipts <strong>of</strong>..........................................................................<br />
Wheat— Spot prices ................................................................................ 40<br />
Wheat Shipment from San Francisco................................................. 42<br />
Wines, California .................................................................................... 22-23<br />
112
RESOURCES and POSSIBILITIES g)<br />
~ — E B E B fiB l f e / v ir a<br />
WELCOMES the WORLD<br />
TO THE<br />
Ex p o s it io n C ity<br />
C /p ress<br />
Morforey<br />
Gibraltar.<br />
YOKOHAMA ■<br />
P t A rgue/fa (x<br />
ANNUAL REPORT<br />
CALIFORNIA DEVELOPMENT BOARD<br />
Digitized for FRASER<br />
http://fraser.stlouisfed.org/<br />
<strong>Federal</strong> <strong>Reserve</strong> <strong>Bank</strong> <strong>of</strong> <strong>St</strong>. <strong>Louis</strong><br />
SAN FRANCISCO. CALIFORNIA - 1913
Digitized for FRASER<br />
http://fraser.stlouisfed.org/<br />
<strong>Federal</strong> <strong>Reserve</strong> <strong>Bank</strong> <strong>of</strong> <strong>St</strong>. <strong>Louis</strong><br />
PANAMA-PACIFIC<br />
INTERNATIONAL EXPOSITION<br />
SAN FRANCISCO, FEBRUARY 20 to DECEMBER 4, 1915<br />
G reat Cascade in the fo rm o f a staircase<br />
in the east or F e s tiv e C ou rt at the Panam a-<br />
P a cific In tern a tio n a l E xp osition . T h is cou rt<br />
w ill b e o n e o f the th ree g rea t cou rts<br />
dividin g th e cen tra l g rou p o f E x p o sitio n<br />
p alaces fr o m n orth to sou th . T h e w aters<br />
o f the cascade, sp rin gin g fro m a m y sterio u s<br />
so u rce, w ill flo w in to tw o g rea t fou n ta in s.<br />
T h e cou rt, rep resen tin g the fin est typ e o f<br />
th e a rch itectu re o f th e Spanish R en a issa n ce,<br />
is d esigned f o r p a gea n try u p on a colossal<br />
scale. H e r e pagean ts surpassin g th e D u rbar<br />
o f India w ill be en a cted . T h e g rea t tow er.<br />
2yo f e e t high, at th e n o rth ern en tra n ce o f<br />
th e cou rt, w ill contain a pipe organ with<br />
ech o organs m the sm aller tow ers. M r.<br />
L o u is C. M u llga rd t, a rch itect o f th e<br />
F ish eries building at th e W o r ld ’s Colum bian<br />
E x p o sitio n , is th e d esig n er o f this cou rt.<br />
The site chosen for the Exposition at<br />
Harbor View on the bay <strong>of</strong> San Francisco<br />
will contain approximately 625 acres with a<br />
frontage <strong>of</strong> nearly three miles on the bay.<br />
The chief exhibit palaces, fourteen in<br />
number, will contain a combined area <strong>of</strong><br />
3,731,500 square feet.<br />
The live stock exhibit will cover 25 acres.<br />
The amusement concessions will cover 65<br />
acres.<br />
The Exposition in every detail is twelve to<br />
eighteen months ahead <strong>of</strong> other W orld’s Fairs<br />
and will be ready on time.<br />
The people <strong>of</strong> the <strong>St</strong>ate <strong>of</strong> California<br />
have pledged themselves to give $17,500,000<br />
to build the Exposition.<br />
The 58 counties in the state will contribute<br />
another $5,000,000.<br />
It will be a winter to winter Exposition.<br />
The states <strong>of</strong> the Union and the nations<br />
<strong>of</strong> the world will be represented.<br />
The exhibits will be selective rather than<br />
general, and the test one <strong>of</strong> quality rather<br />
than quantity.<br />
Exhibits <strong>of</strong> every character from every<br />
part <strong>of</strong> the world will be landed directly at the<br />
Exposition docks. The same facilities will be<br />
<strong>of</strong>fered in the case <strong>of</strong> railway shipments, which<br />
will enable cars to be lightered from the<br />
various tidewater terminals <strong>of</strong> the railroads<br />
to the Exposition.<br />
There will be railroads tracks about the<br />
grounds and into the buildings, and large<br />
openings will be provided in the buildings to<br />
admit the large exhibits. These arrangements<br />
will make the facilities for reaching the E x<br />
position and the delivery <strong>of</strong> freight far<br />
superior to that <strong>of</strong> any other in the past.<br />
The exhibits in the Exposition will be<br />
installed according to a modern classification<br />
and according to modern methods. The departments<br />
will be eleven in number and these<br />
will be Fine Arts, Education, Social Economy,<br />
Liberal Arts, Manufactures and Varied Industries, Machinery, Transportation, A griculture,<br />
Live <strong>St</strong>ock, Horticulture and Mines and Metallurgy.<br />
Passenger transportation facilities have not been overlooked. For every transcontinental<br />
train now coming to San Francisco, the railroads will then run four.<br />
Extra ships are being built by the Ocean and Coastwise <strong>St</strong>eamship Companies to<br />
cope with the volume <strong>of</strong> traffic which will flow into San Francisco bay from all ends<br />
<strong>of</strong> the world.<br />
General Inform ation<br />
General Offices, Exposition Building, Pine and Battery <strong>St</strong>reets, San Francisco.<br />
Office hours 8:30 to 5:15 P. M.<br />
Information Bureau is located on ground floor, Exposition Building. Telephone<br />
Sutter 1915.<br />
The Director <strong>of</strong> Works, Architectural and Engineering Departments are to be<br />
found in the Service Building (on Exposition Site) Fillmore and Francisco <strong>St</strong>reets.<br />
Telephone West 6911.<br />
CALIFORNIA INVITES YOU TO THE EXPOSITIO N C ITY, 1915
Digitized for FRASER<br />
http://fraser.stlouisfed.org/<br />
<strong>Federal</strong> <strong>Reserve</strong> <strong>Bank</strong> <strong>of</strong> <strong>St</strong>. <strong>Louis</strong><br />
CALIFORNIA<br />
RESOURCES AND POSSIBILITIES<br />
TWENTY-THIRD ANNUAL REPORT<br />
OF THE<br />
California Development Board<br />
FOR THE YEAR 1912<br />
Submitted as <strong>of</strong> March, 1913<br />
P u b l i s h e d b y t h e<br />
CALIFORNIA DEVELOPMENT BOARD<br />
O f f i c e a n d E x h i b i t i o n H a l l<br />
Ferry Building, San Francisco<br />
U p p e r F l o o r
Digitized for FRASER<br />
http://fraser.stlouisfed.org/<br />
<strong>Federal</strong> <strong>Reserve</strong> <strong>Bank</strong> <strong>of</strong> <strong>St</strong>. <strong>Louis</strong><br />
Panama-Pacific Grounds—Night Scene
Digitized for FRASER<br />
http://fraser.stlouisfed.org/<br />
<strong>Federal</strong> <strong>Reserve</strong> <strong>Bank</strong> <strong>of</strong> <strong>St</strong>. <strong>Louis</strong><br />
Reproduced from the Unclassified I Declassified Holdings <strong>of</strong> the National Archives<br />
<strong>St</strong>ate Capitol, Sacramento<br />
TWENTY-THIRD ANNUAL REPORT OF THE CALIFORNIA DEVELOP<br />
MENT BOARD<br />
To the Members <strong>of</strong> the Board:<br />
The California Development Board has just completed a year <strong>of</strong> solid and<br />
substantial work. The various departments <strong>of</strong> the Board have increased in their<br />
organized efficiency and through publicity, exhibits, statistics and information and<br />
immigration departments have been zealous in supplying to the homeseeker, investor,<br />
manufacturer and tourist accurate information-as to the <strong>St</strong>ate. The Board<br />
has made great progress during the year in realizing its true objects and functions.<br />
Though it has been called upon for many and varied services by individuals, firms<br />
and organizations, there has been a growing realization that we have a very definite<br />
work which is being emphasized. This work consists in the gathering <strong>of</strong> accurate<br />
and scientific information as to the resources and industries <strong>of</strong> the <strong>St</strong>ate. It<br />
is not necessarily gathered by the Board itself but is secured from counties, local<br />
organizations, state and federal <strong>of</strong>ficials and bureaus and from individuals. The<br />
activities <strong>of</strong> the Board for the year have been mostly directed in getting this information<br />
regarding the <strong>St</strong>ate. The successful termination <strong>of</strong> this campaign for<br />
the securing <strong>of</strong> information serves the following important purposes:<br />
First. Accurate information is absolutely necessary to determine the publicity<br />
campaigns and other activities not only <strong>of</strong> this Board, but <strong>of</strong> all agencies<br />
operating to develop and advertise the <strong>St</strong>ate.<br />
Second. This information is absolutely essential to intelligently answer the<br />
thousands <strong>of</strong> inquiries pouring in upon the Board from all parts <strong>of</strong> the world.<br />
Third. It will be necessary by the 1st <strong>of</strong> January 1915 to have on hand very<br />
much greater knowledge <strong>of</strong> the intimate resources <strong>of</strong> the <strong>St</strong>ate than has ever been<br />
gathered together, in order to intelligently deal with the hundreds <strong>of</strong> thousands <strong>of</strong><br />
visitors who will come to San Francisco to the Panama-Pacific Exposition.<br />
Fourth. The coming in <strong>of</strong> the great body <strong>of</strong> immigration expected with the<br />
opening <strong>of</strong> the Panama Canal necessitates much more accurate information to<br />
properly direct the immigrant to his logical destination. A thorough knowledge <strong>of</strong><br />
the adaptability <strong>of</strong> various foreign elements to the soil, climate and conditions <strong>of</strong><br />
California could easily lead to a selective process <strong>of</strong> immigration.
Digitized for FRASER<br />
http://fraser.stlouisfed.org/<br />
<strong>Federal</strong> <strong>Reserve</strong> <strong>Bank</strong> <strong>of</strong> <strong>St</strong>. <strong>Louis</strong><br />
4 CALIFORNIA DEVELOPMENT BOARD<br />
Recognizing the importance <strong>of</strong> this matter the Board has been indefatigable<br />
in its efforts to find the proper methods, to get the proper contacts and stimulate<br />
<strong>of</strong>ficial agencies to secure more intimate knowledge <strong>of</strong> the <strong>St</strong>ate. Representatives<br />
<strong>of</strong> the Board have visited repeatedly all sections <strong>of</strong> the <strong>St</strong>ate and are interesting<br />
county Boards <strong>of</strong> Supervisors and local organizations to supply responsible information<br />
as to their prospects and opportunities. The Board has thus laid a<br />
foundation for this important work, which will be prosecuted during the coming<br />
year with the greatest possible vigor.<br />
Several valuable results have flowed from the Board’s efforts in this direction<br />
during the past year. It has brought the Board and its representatives in very<br />
much closer contact with representative men and organizations in the interior <strong>of</strong><br />
the <strong>St</strong>ate. Thus closer co-operation and co-ordination <strong>of</strong> interests has resulted<br />
which is greatly strengthening the work <strong>of</strong> the organization. Again, the efficiency<br />
<strong>of</strong> local organizations has been greatly stimulated as their efforts in the direction<br />
<strong>of</strong> getting knowledge <strong>of</strong> their own local situations tends to make them more intelligent<br />
in the prosecution <strong>of</strong> their work. Another important result which may<br />
be traced directly, is the awakening in San Francisco <strong>of</strong> a state-wide interest. The<br />
metropolis is realizing as never before the great contribution made to San Francisco<br />
by the interior and a new sympathy and recognition <strong>of</strong> common interests has<br />
been the result. The Development Board is constantly emphasizing the cardinal<br />
principle that the development <strong>of</strong> the city must depend on the development <strong>of</strong> the<br />
<strong>St</strong>ate.<br />
Immigration<br />
The Development Board has done pirneer work in preparing for the probable<br />
influx <strong>of</strong> foreigners after the opening <strong>of</strong> the Panama Canal. It is recognized that<br />
the Board will have many duties in informing the immigrant and directing him to<br />
the soil. The preliminary work <strong>of</strong> this Board in this matter, consisting <strong>of</strong> a well<br />
equipped Bureau <strong>of</strong> Immigration investgation, has given this organization a position<br />
<strong>of</strong> authority on this important question. The Governor <strong>of</strong> California appointed<br />
a <strong>St</strong>ate Immigration Commission durirg the year and your manager was made<br />
secretary <strong>of</strong> this Commission. The Board turned over its data and information<br />
upon the question to the <strong>St</strong>ate Commission and important legislation for the protection<br />
<strong>of</strong> the immigrant has been recommended to the current session <strong>of</strong> the Legislature.<br />
<strong>St</strong>ate and national contacts are constantly maintained on this subject and<br />
your Manager has conferred frequently with the Department <strong>of</strong> Commerce and<br />
Labor at Washington and participated in a national conference <strong>of</strong> <strong>St</strong>ate immigration<br />
commissioners held in Chicago in November, 1912. It is inevitable that this<br />
Board and its affiliated organizations will have grave duties and responsibilities<br />
when the immigrants actually arrive in California ports. The <strong>St</strong>ate <strong>of</strong> California<br />
will doubtless protect the immigrant from exploitation and many' societies, philanthropic<br />
and racial, will doubtless assist in welcoming and educating the aliens<br />
who seek our shores. It will probably remain, however, for such organizations as<br />
the California Development Board to direct the immigrant to the soil and to give<br />
him the benefit <strong>of</strong> the best information which may be obtained.<br />
Exhibit and Information Bureau<br />
The exhibit rooms <strong>of</strong> the Board have been augmented by many new and impressive<br />
exhibits. Over 100,000 visitors have come to the rooms during the year,<br />
a great majority <strong>of</strong> whom were resident outside <strong>of</strong> San Francisco. The information<br />
desk in the exhibit rooms is being constantly extended with up-to-date material<br />
and a system <strong>of</strong> distribution <strong>of</strong> county and state literature is maintained.<br />
139,862 pieces <strong>of</strong> literature were distributed over the counter averaging nearly<br />
13,000 pieces per month. All sections <strong>of</strong> the <strong>St</strong>ate have splendid booklets. The<br />
Board maintains a lecture room and four lecturers have represented eighteen<br />
counties most <strong>of</strong> the year, giving stereopticon lectures hourly on the resources <strong>of</strong><br />
the <strong>St</strong>ate. The Board has furnished, throught its Exhibit, Information and Lecture<br />
Bureau a very splendid and vital service to the counties <strong>of</strong> the <strong>St</strong>ate. Efforts are<br />
being constantly made to secure larger attendance not only from visitors to San
Digitized for FRASER<br />
http://fraser.stlouisfed.org/<br />
<strong>Federal</strong> <strong>Reserve</strong> <strong>Bank</strong> <strong>of</strong> <strong>St</strong>. <strong>Louis</strong><br />
P U B L IC IT Y — E X P O S IT IO N S — G E N E R A L W O R K 5<br />
Francisco but from San Francisco people most <strong>of</strong> whom are unaware <strong>of</strong> the presence<br />
<strong>of</strong> the most complete and scientific exhibit <strong>of</strong> its kind in existence. Many<br />
newspapers give the Board the courtesy <strong>of</strong> a free advertisement <strong>of</strong> the exhibit, viz:<br />
Bulletin, Post,<br />
The effectiveness <strong>of</strong> the Exhibit and Information Bureau will be greatly increased<br />
as the information campaign in the <strong>St</strong>ate proceeds.<br />
Publicity<br />
Through the activities <strong>of</strong> the Board wide publicity has been given to California<br />
throughout the United <strong>St</strong>ates and Europe. Numerous articles on California<br />
have been furnished to the newspapers in the East and abroad and the <strong>St</strong>ate and<br />
the Exposition has been widely exploited through many and diverse agencies. The<br />
Board has furnished exhibits, photographs, publicity material and stereopticon<br />
slides to many organizations and newspapers. The Monthly Bulletin <strong>of</strong> the<br />
Board has been issued month by month. Four hundred and fifty thousand <strong>of</strong><br />
these bulletins have been issued during the year and are mailed regularly to similar<br />
organizations, newspapers, publicity <strong>of</strong>ficials, individual members, trade organizations<br />
throughout the world, consuls <strong>of</strong> the United <strong>St</strong>ates in foreign countries,<br />
and libraries. In the <strong>St</strong>ate the Board has been represented at practically all public<br />
gatherings connected with the promotion and development work and representatives<br />
<strong>of</strong> the Board are constantly goinginto all sections <strong>of</strong> the <strong>St</strong>ate.<br />
The Board is undertaking at this time the representation <strong>of</strong> California at<br />
the Ghent International Exposition, to be held in Belgium April 27th to November,<br />
1913. A large exhibit has been prepared and shipped to Belgium and a representative<br />
<strong>of</strong> the Board will install this exhibit and represent the <strong>St</strong>ate throughout<br />
the course <strong>of</strong> the Exposition.<br />
Expositions<br />
The Board has kept in close touch with the plans and progress <strong>of</strong> the Panama-<br />
Pacific Exposition and also the Panama-California Exposition at San Diego, and<br />
has co-operated in every way with these important enterprises. Your President,<br />
J. N. Gillett, and your Manager, visited five eastern states and the national capitol<br />
in the interests <strong>of</strong> the Panama-Pacific Exposition in February 1912 and many<br />
other services have been rendered by our Executive Committee and the equipment<br />
<strong>of</strong> the Board. The next two or three years will be most important for the development<br />
<strong>of</strong> California and it is necessary for this Board to thoroughly equip itself<br />
to meet the great opportunities which will arise.<br />
General Work<br />
During the year the Board has held two meetings <strong>of</strong> the Counties Committee,<br />
one in San Jose in June where the subject <strong>of</strong> “ Good Roads” was discussed. The<br />
second meeting was held in Oroville in December in connection writh the Orange<br />
and Olive Exposition. Representatives from all sections <strong>of</strong> the <strong>St</strong>ate were present<br />
at both these meetings and they were enthusiastically successful and assisted<br />
materially in closer co-operation for the benefit <strong>of</strong> the <strong>St</strong>ate. The annual banquet<br />
<strong>of</strong> the Board was held in May in San Francisco and was attended by upwards <strong>of</strong><br />
a thousand guests. The guest <strong>of</strong> honor was Hon. Philander C. Knox, Secretary<br />
<strong>of</strong> <strong>St</strong>ate for the United <strong>St</strong>ates.<br />
The <strong>of</strong>fice force <strong>of</strong> the Board is constantly increasing in efficiency. Most <strong>of</strong><br />
those serving the Board have been with the organization for many years and labor<br />
loyally and effectively for the success <strong>of</strong> the organization.<br />
The Executive Committee has given close attention to the affairs <strong>of</strong> the Board<br />
and to matters <strong>of</strong> state-wide significance coming to their attention.<br />
The financial condition <strong>of</strong> the Board is good and the year closes with a good<br />
balance in the treasury. The activities <strong>of</strong> the Board, however, have now reached<br />
a point when it necessitates a much larger membership and a greater financial<br />
support. The present work is carried on with the most rigid economy and a<br />
more liberal support will aid in extending efficiency.<br />
Reproduced from the Unclassified I Declassified Holdings <strong>of</strong> the Nationat Archives
Digitized for FRASER<br />
http://fraser.stlouisfed.org/<br />
<strong>Federal</strong> <strong>Reserve</strong> <strong>Bank</strong> <strong>of</strong> <strong>St</strong>. <strong>Louis</strong><br />
6 CALIFORNIA DEVELOPMENT BOARD<br />
GROW TH IN POPULATION AND DEVELOPM ENT SINCE CALIFORNIA<br />
STATE.<br />
(U. S. Census Returns.)<br />
BECAM E A<br />
Year<br />
Population<br />
<strong>of</strong><br />
<strong>St</strong>ate<br />
No. farms<br />
Average<br />
acres per<br />
farm<br />
Average value <strong>of</strong><br />
land and buildings<br />
per acre<br />
1850........................................ 92,597 878 4,465.6 0.99<br />
1860........................................ 379,994 18,716 466.4 5.58<br />
1870........................................ 560,247 23,724 481.7 12.36<br />
1880......................................... 864,694 35,934 461.8 15.79<br />
1890........................................ 1,208,130 52,814 405. 32.53<br />
1900......................................... 1,485,052 72,542 397.4 24.56<br />
1910......................................... 2,377,549 88,197 316.7 51.93<br />
Irrigation. Of the 88,197 farms in the <strong>St</strong>ate, 39,352, or 46.6 per cent were irrigated<br />
in 1909. The acreage reported as irrigated in 1909 was 2,664,-<br />
104 acres, or 23.4 per cent <strong>of</strong> the improved land in farms. The area to which enterprises<br />
existing in 1910 were capable <strong>of</strong> supplying water was 3,619,378 acres, and<br />
the total acreage included in irrigation projects, complete or under way, in 1910<br />
was 5,490,360 acres. A revised statement <strong>of</strong> the status <strong>of</strong> irrigation in California<br />
in 1912 is given in the Appendix.<br />
POPULATION, NUM BER OF FARM S AND FARM ACREAGE.<br />
Census year<br />
Population<br />
Farms<br />
Per cent<br />
Land in farms<br />
Improved<br />
Per cent<br />
<strong>of</strong> land<br />
area<br />
Number <strong>of</strong> increase<br />
Acres land<br />
(acres)<br />
in<br />
farms<br />
Per cent<br />
<strong>of</strong> farm<br />
land<br />
improved<br />
1910................... 2,377,549 88,197 21.6 27,931,444 11,389,894 28.0 40.8<br />
1900................... 1,485,053 72,542 37.1 28,828,951 11,958,837 28.9 41.5<br />
1890................... 1,213,398 52,894 47.2 21,427,293 12,222,839 21.5 57.0<br />
1880................... 864,694 35,934 51.5 16,593,742 10,669,698 16.7 64.3<br />
1870................... 560,247 23,724 26.8 11,427,105 6,218,133 11.5 54.4<br />
1860................... 379,994 18,716 2,046.3 8,730,034 2,468,034 8.8 28.3<br />
1850................... 92,597 872 3,893,985 32,454 3.9 0.8<br />
FARM OPERATORS.<br />
Farm operators<br />
Color and nativity<br />
Number<br />
Total<br />
Owners<br />
Tenants<br />
Manageis<br />
Owners<br />
Per cent <strong>of</strong> total<br />
Tenants<br />
Per cent<br />
distribution<br />
Managers<br />
T otal......................... 88,197 100.0 66,632 18,148 3,417 75.5 20.6 3.9<br />
Native white................... 58,926 66.8 45,780 10,505 2,641 77.7 17.8 4.5<br />
Foreign-born white........ 26,193 29.7 19,914 5,565 714 76.0 21.2 2.7<br />
Negro and other nonwhite<br />
......................... 3,078 3.5 938 2,078 62 30.5 67.5 2.0<br />
DENSITY OF POPULATION<br />
In 1900, twenty <strong>St</strong>ates ranked ahead <strong>of</strong> California in population. In 1910, but<br />
eleven stood before her. In the ten-year period she had outstripped nine <strong>of</strong> them,<br />
taking twelfth place.<br />
The density <strong>of</strong> population is still but 15.2 persons to the square mile.
Digitized for FRASER<br />
http://fraser.stlouisfed.org/<br />
<strong>Federal</strong> <strong>Reserve</strong> <strong>Bank</strong> <strong>of</strong> <strong>St</strong>. <strong>Louis</strong><br />
GROWTH IN POPULATION.<br />
L IS T O F C O U N T IE S A N D P O P U L A T IO N IN 1910 A N D<br />
O F IN C R E A S E O R D E C R E A S E — C O U N T IE S ’<br />
T O L D BY T H E CENSUS.<br />
Counties.<br />
Alameda .........................................................................<br />
Alpine ..............................................................................<br />
A m ador ...........................................................................<br />
Butte ...............................................................................<br />
Calaveras ........................................................................<br />
Colusa ..............................................................................<br />
'Contra Costa ................................................ ................<br />
Del Norte ...................................................... ................<br />
El D orado ..................................................... ...............<br />
Fresno ............................................................................<br />
Glenn ..............................................................................<br />
H um boldt ...................................................... ................<br />
Imperial ......................................................... ...............<br />
Inyo .................................................. .............................<br />
Kern .......................................... ....................................<br />
Kings ........................... . . ..............................................<br />
Lake .................................................................................<br />
Lassen ........ , . ...............................................................<br />
Los Angeles ................................................ ................<br />
Madera ...........................................................................<br />
Marin .......... .................................................... ................<br />
Mariposa ........................................................ ................<br />
M endocino ....................................................................<br />
M erced ............................................................................<br />
M odoc .................. ..........................................................<br />
M ono ................................................................<br />
M onterey .......................................................................<br />
Napa ..................................................................................<br />
Nevada .............................................................................<br />
Orange ............................................................................<br />
Placer ...............................................................................<br />
Plumias ...........................................................................<br />
Riverside .........................................................................<br />
Sacramento ....................................................................<br />
San Benito ....................................................................<br />
San Bernardino ...........................................................<br />
San D iego ...................................................................<br />
San Francisco ..............................................................<br />
San Joaquin ..................................................................<br />
San Luis O bispo .........................................................<br />
San M ateo .................................................................... ..<br />
Santa Barbara ..................................................<br />
Santa Clara ......................................................<br />
Santa Cruz ............ .......................................................<br />
Shasta ................ .............................................................<br />
Sierra ............................................................................<br />
Siskiyou ...........................................................................<br />
Solano .........................................................................<br />
Sonoma ...........................................................................<br />
<strong>St</strong>anislaus ......................................................................<br />
Sutter ...................................................... ......................<br />
Tehama ...........................................................................<br />
Trinity .............................................................................<br />
Tulare .............................................................................<br />
Tuolumne .......................................................................<br />
Ventura ....................................................... ........<br />
Y o lo .................. ..............................................................<br />
Yuba .........................................................................<br />
1900, W IT H P E R C E N T A G E<br />
P R O G R E S S AS<br />
Per cent <strong>of</strong> Increase,<br />
1910. 1900-1910.<br />
246,131 89.0<br />
309 — 39.2<br />
9,086 — 18.2<br />
27,301 59.4<br />
9,171 — 18.1<br />
7,732 4.7<br />
31,674 75.4<br />
2,417 0.3<br />
7,492 — 16.5<br />
75,657 99.8<br />
7,172 39.2<br />
33,857 24.9<br />
13,591<br />
6,974 59*4<br />
37,715 128.0<br />
16,230 64.4<br />
5,526 — 8.1<br />
4,802 8.6<br />
504,131 196.0<br />
8,368 31.3<br />
25,114 59.0<br />
3,956 — 16.2<br />
23,929 17.4<br />
15,148 64.4<br />
6,191 21.9<br />
2,843 31.6<br />
24,146 24.6<br />
19,800 20.6<br />
14,955 — 15.9<br />
34,436 74.8<br />
18,237 15.1<br />
5,259 12.9<br />
34,696 93.9<br />
67,806 47.6<br />
8,041 21.2<br />
56,706 103.0<br />
61,665 75.8<br />
416,912 21.6<br />
50,731 43.1<br />
19,383 16.5<br />
26,585 119.8<br />
27,738 45.4<br />
83,539 38.7<br />
26,140 21.0<br />
18,920 0.9<br />
4,098 0.2<br />
18,800 10.9<br />
27,559 14.5<br />
48,394 25.8<br />
22,522 136.7<br />
6,328 7.5<br />
11,401 3.7<br />
3,301 — 24.7<br />
35,440 93.4<br />
9,979 — 10.6<br />
18,347 27.7<br />
15,926 16.9<br />
10,'042 16.5<br />
Reproduced from the Unclassified I Declassified Holdings <strong>of</strong> the Nationat Archives<br />
California ........................................................<br />
2,377,549 60.1<br />
The Governor <strong>of</strong> the <strong>St</strong>ate estimated in 1911 that the increase since the census<br />
was taken, would bring- the total poptlation up to 2,500,000.<br />
Applying the census rate <strong>of</strong> increase the population <strong>of</strong> the <strong>St</strong>ate may be conservatively<br />
put now at 2,750,000. Other figures may be increased by a like reasonable<br />
proportion.
Digitized for FRASER<br />
http://fraser.stlouisfed.org/<br />
<strong>Federal</strong> <strong>Reserve</strong> <strong>Bank</strong> <strong>of</strong> <strong>St</strong>. <strong>Louis</strong><br />
8<br />
CALIFORNIA DEVELOPMENT BOARD<br />
SUMMARY OF THE STATE<br />
Population<br />
Increase<br />
Square<br />
miles<br />
Population per<br />
square mile<br />
Bay counties.............................<br />
South <strong>of</strong> Tehachapi.................<br />
Sacramento valley....................<br />
San Joaquin valley..................<br />
Rest <strong>of</strong> the state.....................<br />
1910<br />
925.708<br />
751,310<br />
153.708<br />
261,811<br />
285,012<br />
1900<br />
658,156<br />
304,209<br />
114,656<br />
143,179<br />
264,853<br />
Per cent<br />
40.6<br />
146.9<br />
34.6<br />
80.2<br />
7.6<br />
7,108<br />
45,102<br />
10,280<br />
27,176<br />
66,506<br />
1910<br />
130.2<br />
16.6<br />
14.9<br />
9.7<br />
4.2<br />
10 yr. inc.<br />
37.6<br />
9.9<br />
3.8<br />
4.4<br />
.4<br />
2,377,549 1,485,053 60.1 156,172 15.2 5.7<br />
' This segregation shows that the greatest gain per square mile has been in the<br />
counties about San Francisco Bay, while the greatest aggregate gain and the greatest<br />
rate <strong>of</strong> increase has been south <strong>of</strong> theTehachapi.<br />
Of the two great interior valleys, the San Joaquin Valley has made the greatest<br />
aggregate gain, 118,632, and the greatest gain per cent, 80.2; while the Sacramento<br />
Valley made an aggregate gain <strong>of</strong> 39,042, and a gain per cent <strong>of</strong> 34.6.<br />
The remaining counties <strong>of</strong> the <strong>St</strong>ate, twenty-five in number, show an aggregate<br />
gain <strong>of</strong> 20,159, and a net gain <strong>of</strong> 7.6 per cent.<br />
Irrigation, the development <strong>of</strong> agricultural lands, and the development <strong>of</strong><br />
bountiful oil fields <strong>of</strong> the <strong>St</strong>ate, have been the main factors in attracting home-<br />
seekers and investors.<br />
P O P U L A T IO N O F C IT IE S O V E R 5,000.<br />
1910. 1900.<br />
Alameda ...................................... .................... 23,383 16,464<br />
Alhambra ................................................. .................... 5,021<br />
B a k ersfield ................................................ .................... 12,727 4,836<br />
Berkeley ................................................... .................... 40,434 13,214<br />
Eureka .......................... ............................ .................... 11,845 7,327<br />
Fresno ......................................... .................... 24,892 12,470<br />
............... 17,809 2,252<br />
............... 319,198 102,479<br />
M arysville ................................ . ............... 5,430 3,497<br />
.................... 5,791 4,036<br />
.................... 150,174 66,960<br />
9,117<br />
Petaluma ................................................. .................... 5,880 3,871<br />
Pom ona ..................................................... .................... 10,207 5,526<br />
Redlands .................................................. .................... 10,449 4,797<br />
.................... 6,802<br />
Riverside ................................................... .................... 15,212 7,973<br />
Sacramento ............................................... .................... 44,696 29,282<br />
San Bernardino ...................................... .................... 12,779 6,150<br />
San D iego .................................... ............... 39,578 17,700<br />
San Francisco ......................................... ............... 416,912 342,782<br />
San Jose ....................................... ............... 28,946 21,500<br />
San Luis O bispo ......................... .................... 5,157 3,021<br />
San Rafael ................................................. .................... 5,934 3,789<br />
Santa Ana ................................................. .................... 8,429 4,933<br />
Santa Barbara .................................. .................... 11,659 6,587<br />
Santa Cruz ............................................... .................... 11,146 5,659<br />
Santa M onica .......................................... .................... 7,847 3,057<br />
Santa Rosa ............................................. .................... 7,817 6,673<br />
<strong>St</strong>ockton ..................................................... .................... 23,253 17,506<br />
Vallejo- ....................................................... .................... 11,340 7,965<br />
Total ................................................... 1,314,037 739,513
Digitized for FRASER<br />
http://fraser.stlouisfed.org/<br />
<strong>Federal</strong> <strong>Reserve</strong> <strong>Bank</strong> <strong>of</strong> <strong>St</strong>. <strong>Louis</strong><br />
Class <strong>of</strong> places<br />
GAIN ON THE PACIFIC SLOPE 9<br />
Population Increase 1900 to 1910<br />
1910 1900 Number Per cent<br />
The state......................................................................... 2,377,549 1,485,053 892,496 60.1<br />
Urban territory in 1910.............................................. 1,469,739 810,193 659,546 81.4<br />
Cities and towns <strong>of</strong>—<br />
100,000 inhabitants or more in 1910.............. 886,284 514,008 372,276 72.4<br />
25,000 to 100,000 inhabitants in 1910........... 183,945 90,813 93,132 102.6<br />
2,500 to 25,000 inhabitants in 1910................ 399,510 205,372 194,138 94.5<br />
Remainder <strong>of</strong> the state............................................... 907,810 674,860 232,950 34.5<br />
THE GAIN ON THE PACIFIC SLOPE<br />
While the gain in population for the whole <strong>of</strong> the Continental United <strong>St</strong>ates<br />
was 15,977,691, an increase <strong>of</strong> 21 per cent, the eleven <strong>St</strong>ates <strong>of</strong> the Pacific Slope, as<br />
given in the table below, show an aggregate increase <strong>of</strong> 2,734,567, an increase <strong>of</strong><br />
66.8 per cent.<br />
The combined area is 1,175,742 square miles, which makes an average population<br />
per square mile <strong>of</strong> 5.8 per cent, while the average population per square mile<br />
for the Continental United <strong>St</strong>ates is 30.9 persons.<br />
Reproduced from the Unclassified / Declassified Holdings <strong>of</strong> the National Archives<br />
PACIFIC SLOPE STATES<br />
Population<br />
Increase<br />
Square<br />
miles<br />
Population per<br />
square mile<br />
1910 1900 Per cent *, 1910 10 yr. inc.<br />
Montana....................................... 376,053 243,329 54.5 145,310 2.6 9<br />
W yoming...................................... 145,965 92,531 56.8 97,575 1.5 6<br />
Colorado....................................... 799,024 539,700 48 103,645 7.5 2 3<br />
New M exico................................ 327,396 195,300 67.6 122,460 2.7 1 1<br />
Arizona.......................................... 204,354 122,931 66.2 112,920 1.8 7<br />
Utah............................................... 373,351 276,749 34.9 82,190 4.5 1 1<br />
Nevada.......................................... 81,875 42,335 93.4 109,740 .8 4<br />
Idaho............................................. 325,594 161,772 101.3 84,290 3.9 2<br />
Washington.................................. 1,141,990 518,103 120.4 66,880 17 9 3<br />
Oregon........................................... 672,765 413,536 62.7 94,560 7.1 2 7<br />
California...................................... 2,377,549 1,485,053 60.1 156,172 15.2 2 7<br />
6,825,916 4,091,349 66.8 1,175,742 5.8 2 4<br />
Expansion <strong>of</strong><br />
The development <strong>of</strong> the agricultural resources <strong>of</strong> the<br />
Agricultural Industries. <strong>St</strong>ate is exhibited in the following tables, comparing the<br />
acreage sown to certain crops in 1862 with those <strong>of</strong> 1910.<br />
1862 1910<br />
Agr. report<br />
Census report<br />
acres<br />
acres<br />
Indian corn................................................................................. 17,339 51,935<br />
Wheat........................................................................................... 361,351 478,637<br />
R y e ................................................................................................ 1,415 7,027<br />
Oats............................................................................................... 36,607 192,158<br />
Barley........................................................................................... 223,217 1,195,158<br />
Hay and forage.......................................................................... 250,464 2,049,213<br />
Potatoes....................................................................................... 3,624 72,799<br />
T otal...................................................................................; 914,788 4,046,927<br />
Add acreage <strong>of</strong> following not mentioned in report 1862:<br />
H ops............................................................................................................................... 8,391<br />
Celery............................................................................................................................ 5,600<br />
Beans.............................................................................................................................. 157,825<br />
<strong>St</strong>anding alfalfa........................................................................................................... 487,134<br />
Cotton............................................................................................................................ 15,000<br />
Sugar beets................................................................................................................... 101,000<br />
Kaffir corn, mustard seed, etc................................................................................ 50,194 825,144<br />
4,872,071
Digitized for FRASER<br />
http://fraser.stlouisfed.org/<br />
<strong>Federal</strong> <strong>Reserve</strong> <strong>Bank</strong> <strong>of</strong> <strong>St</strong>. <strong>Louis</strong><br />
10 GALIFORNIA DEVELOPMENT BOARD<br />
Besides this increase in acreage <strong>of</strong> the staple crops, California had, according<br />
to the report <strong>of</strong> the <strong>St</strong>ate Board <strong>of</strong> Equalization, vines and fruit trees as follows,<br />
bearing and not bearing, in 1910:<br />
VINEYARDS<br />
Acres<br />
Table grapes............................................................................................................................................. 53,729<br />
Raisin grapes............................................................................................................................................ 128,217<br />
Wine grapes.............................................................................................................................................. 160,573<br />
ORCHARDS<br />
Deciduous fruits— No. <strong>of</strong> trees Citrus fruits— No. <strong>of</strong> trees<br />
Apple............................................... 2,143,815 Orange............................... .......... 10,803,221<br />
Apricot............................................ 2,593,884 Lemon............................... .......... 1,810,616<br />
Cherry............................................. 601,520 Pomelo.............................. .......... 18,886<br />
F ig ........................................... ........ 549,875 Lime.................................. .......... 1,716<br />
N ectarine........................................ 63,773<br />
Olive................................................ 1,190,452 T otal............................. .......... 12,634,439<br />
Peach....................................... .... 10,922,994<br />
Pear......................................... 1,499,932 Nuts—<br />
Plum................................................ 1,059,453 Almond............................. .......... 1,204,382<br />
Prune....................................... 8,998,831 W alnut............................... 891,147<br />
T otal................................... .... 19,624,529 T otal............................. .......... 2,095,529<br />
Grand total in 1909-10..................................................................................................................... 34,354,497<br />
The new plantings since that, will easily bring the total deciduous and citrus<br />
fruits and nuts up to 38,000,000.<br />
Financial Conditions in California<br />
The following table <strong>of</strong> California banking resources is compiled from the report<br />
<strong>of</strong> <strong>St</strong>ate banks as <strong>of</strong> August 14th and <strong>of</strong> the national banks as <strong>of</strong> September 4:<br />
<strong>St</strong>ate. National. Total.<br />
San Francisco .................................... $264,394,438.72 $240,847,989.14 $505,242,427.86<br />
Los Angeles ......................................... 123,760,000.79 80,037,174.26 203,797,175.05<br />
Other California ................................. 287,914,129.04 179,581,562.44 467,495,691.48<br />
Total California ............................ $676,068,568.55 $400,466,725.84 $1,176,535,294.39<br />
<strong>St</strong>ate Savings and Commercial<br />
Of the 754 banks, 523 are <strong>St</strong>ate— savings, commercial and trust companies. Of<br />
these San Francisco has 37, Los Angeles 38, Oakland 17, Sacramento 10, San Diego<br />
6, <strong>St</strong>ockton 6 and the other 409 are distributed. The aggregate paid-up capital<br />
is $61,537,742.47, surpassing many <strong>of</strong> the older <strong>St</strong>ates. The only ones<br />
that exceeded California in the number <strong>of</strong> depositors and the aggregate amount<br />
<strong>of</strong> deposits were Massachusetts and New York.<br />
National <strong>Bank</strong> <strong>St</strong>atement<br />
At the top <strong>of</strong> the following page is given the consolidated statement <strong>of</strong> the<br />
nine San Francisco national banks for the call <strong>of</strong> September 4th, the previous call<br />
and the corresponding call in 1911.<br />
Abstract <strong>of</strong> the Condition <strong>of</strong> <strong>St</strong>ate <strong>Bank</strong>s<br />
At the bottom <strong>of</strong> the following page is given an abstract <strong>of</strong> the condition <strong>of</strong><br />
523 <strong>St</strong>ate banks, including sixty-three branches, as <strong>of</strong> August 14th, comprising<br />
the reports <strong>of</strong> 155 commercial banks, 131 savings banks, seven trust companies<br />
and 167 departmental banks, compared with totals as shown by the report as <strong>of</strong><br />
June 14th.
Digitized for FRASER<br />
http://fraser.stlouisfed.org/<br />
<strong>Federal</strong> <strong>Reserve</strong> <strong>Bank</strong> <strong>of</strong> <strong>St</strong>. <strong>Louis</strong><br />
FINANCIAL CONDITIONS IN CALIFORNIA 11<br />
Resources June 14, 1912 Sept. 4, 1912<br />
Loans and discounts.................................................<br />
United <strong>St</strong>ates bonds.................................................<br />
Bonds, securities, etc...............................................<br />
Premiums on United <strong>St</strong>ates bonds......................<br />
<strong>Bank</strong> house furniture and fixtures.......................<br />
Due from banks and bankers...............................<br />
Due from reserve agents.........................................<br />
Cash and cash items................................................<br />
Redemption fund (5 pet. <strong>of</strong> circulation)................<br />
Letters <strong>of</strong> credit........................................................<br />
Other assets, N. O. S ..............................................<br />
Totals...............................................................<br />
Liabilities<br />
Capital stock paid in ...............................................<br />
Surplus and undivided pr<strong>of</strong>its...............................<br />
Dividends unpaid......................................................<br />
Circulation...................................................................<br />
Individual deposits....................................................<br />
Due banks and bankers..........................................<br />
Due to reserve agents..............................................<br />
United <strong>St</strong>ates deposits.............................................<br />
Letters <strong>of</strong> credit........................................................<br />
City and state deposits...........................................<br />
Other liabilities, N. O. S ........................................<br />
$114,238,750.62<br />
22,551,000.00<br />
[ 116,393,386.39<br />
323,414.44<br />
4,680,303.41<br />
23,035,685.01<br />
16,685,698.04<br />
19,922,305.94<br />
1,085,000.00<br />
9,176,996.82<br />
910,928.63<br />
$229,003,469.30<br />
$ 28,250,000.00<br />
20,883,584.86<br />
58,389.50<br />
21,598,207.50<br />
91,599,383.37<br />
55,365,640.23<br />
44,893.16<br />
785,287.72<br />
9,632,125.02<br />
235,000.00<br />
550,957.94<br />
$119,616,132.07<br />
22,801,000.00<br />
16,634,317.17<br />
318,726.96<br />
4,666,921.59<br />
22,747,536.36<br />
17,177,775.96<br />
26,946,294.50<br />
1,085,000.00<br />
7,879,588.97<br />
914,695.56<br />
' $240,847,989.14<br />
$ 28,500,000.00<br />
21,023,781.27<br />
13,413.00<br />
21,903,807.50<br />
97,006,241.70<br />
62,075,826.78<br />
60,093.18<br />
831,106.06<br />
8,114,652.77<br />
978,000.00<br />
341,066.88<br />
Sept. 1, 1911<br />
$108,207, 498.70<br />
22,383 ,000.00<br />
15,273 140.59<br />
470 181.61<br />
4,720 ,207.65<br />
20,170 ,894.70<br />
15,268 ,309.02<br />
20.569 ,075.55<br />
1,076 ,200.00<br />
8,669 ,685.95<br />
842 ,840.23<br />
$217,651,034.00<br />
28,750, 000.00<br />
20,413 194.72<br />
169 307.50<br />
21,267 ,820.00<br />
85,158 178.65<br />
51,747 285.35<br />
2 ,358.68<br />
538 ,509.56<br />
8,903 ,187.16<br />
230,000.00<br />
471 ,192.38<br />
Reproduced from the Unclassified I Declassified Holdings <strong>of</strong> the Nationat Archives<br />
Totals............................................................... $229,003,469.30 $240,847,898.14<br />
$217,651,034.00<br />
L ocation and Class .<br />
San Francisco— C om m ercia l....................<br />
S a v in g s.............................<br />
T r u s t.................................<br />
T otal Resources<br />
and Liabilities Capital Surplus<br />
$ 62,479,165.43<br />
194,026,784.02<br />
7,888,489.27<br />
$8,468,650.00<br />
5,301,600.00<br />
3,725,000.00<br />
$1,789,728.38<br />
8,295,534.33<br />
652,949.04<br />
U ndivided<br />
Pr<strong>of</strong>its<br />
$ 754,242.65<br />
1,421,962.75<br />
279,935.41<br />
Individual<br />
D eposits<br />
$ 39,894,904.94<br />
177,746,387.43<br />
2,928,923.41<br />
N um ber <strong>of</strong><br />
D epositors<br />
37,222<br />
253,400<br />
169<br />
T o t a l........................<br />
$264,394,438.72 $17,495,250.00 $10,738,211.75 $2,456,140.81 $220,570,215.78 290,791<br />
Los Angeles— C om m ercia l....................<br />
T r u s t .................................<br />
$26,475,630.40<br />
92,653,328 .20<br />
4,631,042.19<br />
$ 3,263,716.46<br />
3.915.000.00<br />
2.300.000.00<br />
$1,103,357.28<br />
2,324,426.30<br />
624,137.95<br />
$475,130.79<br />
911,483.47<br />
354,962.85<br />
$19,776,010.71<br />
84,605,076.25<br />
1,242,304.72<br />
59,807<br />
167,138<br />
19<br />
T o t a l ........................<br />
$123,760,000.79 $9,478,716.46 $4,051,921.53 $1,741,577.11 $105,623,391.68 226,964<br />
O akland—<br />
C om m ercia l....................<br />
S a v in g s.............................<br />
T r u s t .................................<br />
$ 7,870,889.60<br />
39,643,918.47<br />
337,479 .75<br />
$ 942,620.00<br />
2,110,620.00<br />
200,000.00<br />
$ 749,535.56<br />
954,039 .20<br />
50,000.00<br />
$195,701.81<br />
380,839.47<br />
1,327.03<br />
$4,801,421.66<br />
35,287,076.24<br />
86,152.72<br />
14,099<br />
81,610<br />
T o t a l........................<br />
$47,852,287.82 $3,253,240.00 $1,753,574.76 $577,868.31 $40,174,650.62 95.709<br />
Sacram ento— ■ C om m ercia l....................<br />
S a v in g s.............................<br />
T r u s t .................................<br />
$ 1,140,626.73<br />
14,597,802.50<br />
202,210.09<br />
$373,887.00<br />
1,360,853.90<br />
2 00,000 .00<br />
$ 3,000.00<br />
3 33,555.34<br />
$ 3,690.62<br />
207,894.62<br />
1,566.29<br />
$ 598,905.42<br />
12,033,446.33<br />
643 .87<br />
2,495<br />
5,382<br />
San D iego—<br />
T o t a l........................<br />
C o m m e r c ia l...................<br />
T o t a l ........................<br />
$15,940,639.32 $1,934,740.90 $336,555.34 $213,151.46 $12,632,995.62 7,877<br />
$3,948,069.04<br />
8,161,235.55<br />
$562,500.00<br />
527,500.00<br />
$117,157.10<br />
311,967.51<br />
$48,278.55<br />
60,202.29<br />
$2,650,502.22<br />
7,008,861.88<br />
5,197<br />
19,479<br />
$12,109,304.59 $1,090,000 .00 $429,124.61 $108,480.8 4 $9,659,364.10 24,676<br />
S tockton —■<br />
C om m ercia l....................<br />
S a v in g s.............................<br />
$6,831,890.33<br />
9,654,141.11<br />
$1,367,000.00<br />
750,000.00<br />
$379,950.00<br />
286,250.00<br />
$236,482.05<br />
129,135.16<br />
$4,328,393.90<br />
8,235,994.50<br />
9,811<br />
13,551<br />
T o t a l.................................<br />
<strong>St</strong>ate (excluding above) C om m ercia l..<br />
S a v in g s.............................<br />
T r u s t.................................<br />
T o t a l .................................<br />
<strong>St</strong>ate (as a whole) C om m ercia l..............<br />
S a v in g s............................<br />
T r u s t .................................<br />
G rand total August 14, 1912...................<br />
$16,486,031.44 $2,117,000.00 ^$666,200.00 $365,617.21 $12,564,388.40 23,362<br />
$94,984,676.57<br />
99,918,048.55<br />
623,140.75<br />
$16,846,451.73<br />
8,722,343.38<br />
600,000.00<br />
$5,897,017.03<br />
3,124,402.30<br />
$2,691,876.17<br />
1,141,684.71<br />
8 40.38<br />
$61,910,184.05<br />
84,077,206.56<br />
20,372.47<br />
157,468<br />
216,553<br />
$195,525,865.87 $26,168,795.11 $9,021,419.33 $3,834,401.26 $146,007,763.08 374,021<br />
$203,730,948.10<br />
4 58,655,258.40<br />
13,682,362.05<br />
$31,824,825.19<br />
22,687,917.28<br />
7,025,000.00<br />
$10,039,745.35<br />
15,630,174.98<br />
1,327,086.99<br />
$ 4,405,402.64<br />
4,253,202.47<br />
638,631.89<br />
$133,960,322.90<br />
408,994,049.19<br />
4,278,397.19<br />
286,099<br />
757,113<br />
188<br />
$676,068,568.55 $61,537,742.47 $26,997,007.32 $9,297,237.00 $547,232,769.28 1,043,400<br />
Grand total June 14, 1912........................ $666,998,510.30 $60,675,195.33 $26,315,612.49 $14,758,701.59 $532,951,777.00 1,075,774
Digitized for FRASER<br />
http://fraser.stlouisfed.org/<br />
<strong>Federal</strong> <strong>Reserve</strong> <strong>Bank</strong> <strong>of</strong> <strong>St</strong>. <strong>Louis</strong><br />
12 CALIFORNIA DEVELOPMENT BOARD<br />
Clearing House Exhibits<br />
The bank clearings <strong>of</strong> San Francisco have more than doubled since 1900. Los<br />
Angeles, the other large financial center <strong>of</strong> the <strong>St</strong>ate, while showing a smaller<br />
aggregate, has a larger proportionate increase.<br />
The San Francisco Clearing House was organized May, 1876. The clearings<br />
for the 8 2-3 months <strong>of</strong> that year were $176,125,237.97.<br />
In 1890 they were $851,066,172.90.<br />
In 1900 they were $1,029,582,574.78.<br />
In the 37 years <strong>of</strong> its existence the total amount <strong>of</strong> clearings has been $40,-<br />
463,687,161.13. The average daily clearings increased from $1,927,624 in 1876 to<br />
$8,895,554.66 in 1912.<br />
The gain in volume <strong>of</strong> clearing house business for 1912 over 1911 was 10.32<br />
per cent, which strongly reflects the increase in the mineral and agricultural products<br />
and the increase in the amount <strong>of</strong> exports and imports over 1911, as well<br />
as the sales <strong>of</strong> real estate and the building operations <strong>of</strong> the city.<br />
Other cities <strong>of</strong> California show an increase that indicates the marvelous development<br />
<strong>of</strong> the <strong>St</strong>ate in the time.<br />
The record <strong>of</strong> advancement in the two principal cities in the past twelve<br />
years is as follows:<br />
San Francisco.<br />
Year.<br />
Clearings.<br />
1900 $1,029,582,594.78<br />
1901 1,178,169,536.30<br />
1902 1,373,362,025.31<br />
1903 1,520,200,682.07<br />
1904 1,534,631,136.73<br />
1905 1,834,549,788.51<br />
1906 1,998,400,779.06<br />
1907 2,133.882,625.80<br />
1908 1,757,151,850.08<br />
1909 1,979,872,570.06<br />
1910 2,323.772,870.99<br />
1911 2.427.075,543.46<br />
1912 2,677,561,952.2/7<br />
L os Angeles.<br />
Year.<br />
Clearings.<br />
1900 $ 122,692,555.55<br />
1901 161,466,671.54<br />
1902 245,516,094.85<br />
1903 307,316,530.90<br />
1904 345.343,956.35<br />
1905 478,985,298.40<br />
1906 578,635,516.82<br />
1907 581,803,982.00<br />
1908 505,588,756.02<br />
1909 673,165,728.81<br />
1910 811.377,487.47<br />
1911 942,914,424.19<br />
1912 1,168,941,700.02<br />
While the total clearings for the United <strong>St</strong>ates for 1912 showed an increase<br />
as compared with 1911 <strong>of</strong> but 9 per cent, San Francisco had an increase <strong>of</strong> over 10<br />
per cent and Los Angeles <strong>of</strong> over 23 percent. For 1912 San Francisco was eighth<br />
in the list <strong>of</strong> clearing and Los Angeles twelfth.<br />
The transactions <strong>of</strong> the U. S. Sub-Treasury since it became a rtiember <strong>of</strong> the<br />
San Francisco Clearing House Association, were as follows:—<br />
In Clearings.<br />
1910—$ 66.983,003.69<br />
1911— 71,910,560.40<br />
1912— 78,653,510.20<br />
Out Clearings.<br />
1910_$ 55.669,130.60<br />
1911— 59.805,631.67<br />
1912— 72,864,463.65<br />
$217,547,074.29<br />
$188,339,225.92<br />
Total for three years, $405,886,300.21.<br />
The debit and credit balances amounted to $125,578,485.71, <strong>of</strong> which $33,320,-<br />
000 was settled with U. S. Treasury House certificates, saving the four fold<br />
handling <strong>of</strong> that amount or 245 tons <strong>of</strong> gold coin.<br />
Other Clearing House Cities<br />
1909. 1910.<br />
Oakland .. . ..................... 96,527,088.09 157,460,588.22<br />
Sacramento ..................... 54,512,723.22 69,447,281.94<br />
San Diego ..................... 52,094,521.00 66,708,874.00<br />
Fresno ___ ..................... 29,324,258.30 37,930,473.07<br />
<strong>St</strong>ockton .. ..................... 28,195,022.20 32,277,582.58<br />
San Jose ..................... 25,320,894.50 27,828,978.64<br />
Pasadena ..................................(With Los Ang.) 40,570,318.90<br />
1911.<br />
172,666,406.17<br />
78,376,700.21<br />
82,724,333.47<br />
39,782,776.05<br />
40,356,582.58<br />
29,877,754.37<br />
41,607,900.10<br />
1912.<br />
222,570,346.29<br />
92,747,060.69<br />
131,894,087.00<br />
51,400,594.73<br />
45,064,374.68<br />
35,882,473.55<br />
47,144,736.48<br />
Bakersfield Clearing House organized in March 1912, did a business for the<br />
year <strong>of</strong> over $21,500,000.
Digitized for FRASER<br />
http://fraser.stlouisfed.org/<br />
<strong>Federal</strong> <strong>Reserve</strong> <strong>Bank</strong> <strong>of</strong> <strong>St</strong>. <strong>Louis</strong><br />
PROGRESS Itt THE METROPOLIS 13<br />
<strong>Federal</strong> Business in San Francisco for 1912.<br />
Postal receipts .............................$ 2,782,949.41 Internal Revenue Receipts.......... $ 7,782,197.40<br />
Imports .......................................... 61,267,798.00 Exports ............................................73,302,300.00<br />
Custom receipts ............................ 6,652,146.16 Tonnage movement for fiscal year<br />
Postal Savings Deposits............. 1,238,814.00 ending June 30, 1912 ................. 6,798,726.00<br />
(handled over state wharves)<br />
The commerce <strong>of</strong> the port reached nearly every country in the world.<br />
Commercial Movements By Sea at Other Ports in California.<br />
Imports<br />
Exports<br />
♦Humboldt Bav ...................................... $ 5,095,392 $10,914,275<br />
*Los Angeles .......................................... 83,251,220 18,734,972<br />
San Diego ............................................... 937,655 1,401,600<br />
*Fiscal year ending June 31, 1912.<br />
PROGRESS IN THE METROPOLIS<br />
The seventh anniversary <strong>of</strong> the great disaster <strong>of</strong> April, 1906, finds few vestiges<br />
<strong>of</strong> the ruin then wrought. A new city <strong>of</strong> imposing modern structures occupies<br />
the ground where before stood the many examples <strong>of</strong> architectural variety<br />
evolved during the last half <strong>of</strong> the nineteenth century.<br />
San Francisco has won the admiration and wonder <strong>of</strong> the world by the courage<br />
and energy <strong>of</strong> her rebuilding, and stands today more fit than ever to occupy<br />
her proper place among the great cities <strong>of</strong> the world.<br />
The disaster marked the beginning <strong>of</strong> a new era and made it possible to modernize<br />
a city which represented sixty-one years <strong>of</strong> growth. Already what was at<br />
the time regarded as an overwhelming calamity has brought its benefits. The<br />
confidence <strong>of</strong> her people has been justified and the promise <strong>of</strong> greater prosperity<br />
for the future is hers.<br />
To this prosperity the whole <strong>St</strong>ate contributes and in it shares.<br />
San Francisco can now claim to be, in character and equipment <strong>of</strong> her new<br />
structures, the most up-to-date city in the world. She is now authorized by the<br />
<strong>Federal</strong> Government to invite the nations <strong>of</strong> the world to come and see for themselves<br />
when she opens the Panama-Pacific International Exposition in 1915, which<br />
enterprise was inaugurated in the presence <strong>of</strong> a vast multitude in Golden Gate<br />
Park, October 14, 1911, by the turning <strong>of</strong> the first shovelful <strong>of</strong> earth by Wm. H.<br />
Taft, President <strong>of</strong> the United <strong>St</strong>ates.<br />
RECONSTRUCTION OF SAN FRANCISCO<br />
The reconstruction <strong>of</strong> the city involved vast expenditures by the municipality<br />
for streets, sewers, fire system, school houses and other municipal buildings, all<br />
<strong>of</strong> which has been <strong>of</strong> the most substantial character.<br />
Private The buildings destroyed in San Francisco by fire <strong>of</strong> 1906 num-<br />
Construction. bered 28,188 valued at $105,000,000. The money expended by private<br />
parties for labor on the new buildings has amounted to some $75,000,000,<br />
while the municipality has expended large sums on the same account.<br />
The private construction as shown by the <strong>of</strong>ficial permits issued, gives the<br />
record as follows, up to Dec. 31, 1911.<br />
Number<br />
Buildings<br />
Class A ................................................................................... 117<br />
Class B ................................................................................... 135<br />
Class C ................................................................................... 1,830<br />
■PrAtnfts............ ............... ................................ 16,951<br />
Alterations............................................................................. 11,280<br />
Total............................................................................... 30,316<br />
For 1911................................................................................. 6,079<br />
April, 1906, to<br />
Dec. 31,1910<br />
Cost<br />
$ 24,927,260<br />
9,256,871<br />
55,835,617<br />
67,965,376<br />
18,897,080<br />
$176,882,204<br />
20,915,474<br />
Grand total.................................................................... 36,395 $197,797,678<br />
Add 15 per cent for under valuation...............................<br />
29,669,650<br />
$227,467,328<br />
1911<br />
Cost<br />
$ 1,809,097<br />
1,010,500<br />
T8,145,673<br />
’ 8,345,956<br />
1,604,248<br />
$20,915,474
Digitized for FRASER<br />
http://fraser.stlouisfed.org/<br />
<strong>Federal</strong> <strong>Reserve</strong> <strong>Bank</strong> <strong>of</strong> <strong>St</strong>. <strong>Louis</strong><br />
14 CALIFORNIA DEVELOPMENT BOARD<br />
The city shows for itself as to the character <strong>of</strong> buildings erected up to the<br />
end <strong>of</strong> 1911 and the above figures give some <strong>of</strong> the details.<br />
For 1912 permits were issued for buildings to cost $23,338,563.00. Contracts<br />
for the same were let and recorded as follows:—<br />
Brick ...............................................................................................$14,246,796<br />
Frame .............................................................................................. 9,826,927<br />
Alterations ..................................................................................... 2,195,283<br />
Total for 1912 ........................................................................... $26,269,006-<br />
Though San Francisco has always been famous for its hotels, it has added<br />
largely to the number and size and now has some <strong>of</strong> the finest and best equipped<br />
hostelries in the country, and can demonstrate its ability to comfortably house<br />
any number <strong>of</strong> visitors that may be drawn within her gates at any one time.<br />
The hotels proper number over 320 with nearly 30,000 rooms, and accommodations<br />
for 60,000 guests at one time. There are also over 300 apartment houses<br />
and over 500 lodging houses, in which a large share <strong>of</strong> the floating population find<br />
shelter.<br />
New hotels, apartment houses and lodging houses are under construction, and<br />
the number will be greatly augmented. By the time <strong>of</strong> the opening <strong>of</strong> the Panama-<br />
Pacific International Exposition, San Francisco will be in a position to sustain<br />
her prestige for care <strong>of</strong> her visitors in the face <strong>of</strong> multitudes that will be drawn<br />
to the city on that notable occasion.<br />
The growth <strong>of</strong> building activities all over the <strong>St</strong>ate has been greatly stimulated<br />
by the publicity given to California by San Francisco’s mishap and her reconstruction,<br />
as the following exhibit for Los Angeles, Oakland, and other leading<br />
cities <strong>of</strong> the <strong>St</strong>ate shows:<br />
Valuation.<br />
( 1905 ........ ..........$15,382,057<br />
I 1909 ........ .......... 13,260,703<br />
\ 1910 ........ ......... '21,684,100<br />
I 1911 ........ .......... 23,004,185<br />
1 1912........ .......... 31,367,995<br />
Sacramento.<br />
Valuation.<br />
1906 $ 994,811<br />
1909 2,063,394<br />
1910 2,164,456<br />
1911 3,087,392<br />
1912 2,793,544<br />
[ 1906 ........ .......... 4,445,692<br />
1905 .......................1,953,532<br />
................................ I 1909 5,318,512 _ . 1909 .......................1,888,826<br />
Oakland............. •{ i 11910........ 9 1 0 ..................... 6,695,789 6.695.789 Pasadena........... 1910 .......................2,133,528<br />
1911........ .......... 6,202,685<br />
1911 2,183,713<br />
1 1912 ........ ........ 9,009,734<br />
1912 .2,166,352<br />
r 1905 ........ ......... 1,193,170<br />
1905 ..................... 908,525<br />
1909 ........ .......... 2,632,100 ____ ____ 1909 ..................... 1,195 280<br />
1910 ___ .......... 4,005,200<br />
1911........ .......... 5,703,685<br />
1911 569,369<br />
. 1912 ....... ......... 10,001,004<br />
1912 857,166<br />
San D iego....... 1910 111!!!!!!! ilooslioo San J°se......... 1910 11’.!!!!! 111! i ’,75olooo<br />
1906 ........ ........ 488,372<br />
1907 129,880<br />
...... 1909 ...................................1909 565,195 ...................................................................... 332.897<br />
<strong>St</strong>ockton............ 1Q10 1910 .................... ___ 506.494 506,494 Fresno............... 1910 ..................... 990,040<br />
1911 ....... ......... 938,857<br />
1911 1,075,941<br />
. 1912........ ......... 1,129,170<br />
1912 1,697,294<br />
Harbor Improvements<br />
Planned for<br />
San Francisco Bay.<br />
The improvements to San Francisco harbor made possible<br />
by the $2,000,000 <strong>St</strong>ate bond issue <strong>of</strong> 1904 have been<br />
augmented by the <strong>St</strong>ate bonds to the amount <strong>of</strong> $9,000,-<br />
000 authorized in 1910. At the same time $1,000,000<br />
bonds were voted for the acquisition <strong>of</strong> Islais Creek lands for an inland basin.<br />
Within the next two years, or by the time <strong>of</strong> the opening <strong>of</strong> the Panama-<br />
Pacific International Exposition in 1915, these extensions and improvements will<br />
be completed, giving San Francisco a wharfage line <strong>of</strong> 44.5 miles not including<br />
Channel Creek and the three basins. A belt road connecting the piers with the<br />
transcontinental railway lines is furnishing ideal facilities for handling the commerce<br />
<strong>of</strong> the port and the present plans provide for its expansion.<br />
San Francisco deservedly ranks as one <strong>of</strong> the Great Cities <strong>of</strong> the World. She
Digitized for FRASER<br />
http://fraser.stlouisfed.org/<br />
<strong>Federal</strong> <strong>Reserve</strong> <strong>Bank</strong> <strong>of</strong> <strong>St</strong>. <strong>Louis</strong><br />
RECONSTRUCTION OF SAN FRANCISCO 15<br />
is a Great City by reason <strong>of</strong> her position and power in the social, commercial and<br />
financial world. San Francisco is pre-eminently a commercial city. It is a foreign<br />
and domestic market without a peer on the Pacific Coast. The city has all the<br />
advantages <strong>of</strong> location possessed by any <strong>of</strong> the great commercial centers <strong>of</strong> the<br />
world. It is situated on the north end <strong>of</strong> a peninsula, six miles wide and twenty<br />
miles long, separating San Francisco Bay from the Pacific Ocean.<br />
As a seaport it receives the commercial drainage <strong>of</strong> a region that has the<br />
greatest variety <strong>of</strong> natural resources <strong>of</strong> any part <strong>of</strong> the earth. That drainage is<br />
the great inextinguishable, economic fact that rebuilt San Francisco after the<br />
catastrophe <strong>of</strong> 1906 on greater lines than before. It was economic pressure that<br />
forced and inspired the energies which have made a new city that is the wonder<br />
<strong>of</strong> the World.<br />
O akland The great seaport <strong>of</strong> Pacific America, with constantly expanding com-<br />
H arb or. merce demands ever-widening facilities for handling it. Fortunately<br />
this demand is being met by San Francisco and Oakland, the two great<br />
cities <strong>of</strong> the bay region. Formerly there was danger that much <strong>of</strong> our commerce<br />
would be alienated by the lack <strong>of</strong> adequate port and dock facilities. This risk is<br />
no longer imminent. The San Francisco Harbor Commissioners, watchful <strong>of</strong> the<br />
needs <strong>of</strong> trade, are wisely expanding its facilities on the water front within their<br />
jurisdiction. But when they have done all within their power, the expansion <strong>of</strong><br />
commerce will not stop, and to meet it Oakland is wisely and watchfully moving<br />
to develop her splendid water front to secure deep water to accommodate the<br />
largest ships and to meet commerce by water and rail facilities that will give trade<br />
a line <strong>of</strong> least resistance.<br />
The Oakland water front is a great asset <strong>of</strong> the Pacific trade, and its improvement<br />
now planned and in progress means that the commerce <strong>of</strong> all times is<br />
to have on San Francisco Bay every advantage that natural situation justifies<br />
and that enlightened public enterprise can supply.<br />
For that improvement Oakland has voted a bond issue <strong>of</strong> $3,500,000, and the<br />
grantees <strong>of</strong> that city are beginning the expenditure <strong>of</strong> $20,000,000 additional on<br />
the western and southern water front. When these improvements are completed<br />
Oakland will <strong>of</strong>fer facilities which may well rank with those <strong>of</strong> Hamburg, Havre,<br />
The Hague and Liverpool.<br />
Hereafter, then, there need be no fear that any ship, however great her tonnage<br />
or deep her draught, will fail <strong>of</strong> accommodation in this bay, or that any<br />
cargo, in or out, will lack the latest and most economical device for handling and<br />
transfer. The same spirit is upon both cities, not in rivalry, but with the determination<br />
that this seaport, intended by nature to be one <strong>of</strong> the world’s greatest,<br />
shall by art and enterprise fulfill its destiny.
Digitized for FRASER<br />
http://fraser.stlouisfed.org/<br />
<strong>Federal</strong> <strong>Reserve</strong> <strong>Bank</strong> <strong>of</strong> <strong>St</strong>. <strong>Louis</strong><br />
G E N E R A L S U M M A R Y A N D C O M P A R A T IV E T A B L E O F S H IP M E N T S O U T O F S T A T E B Y R A I L , O F F R U IT S , W IN E , B R A N D Y A N D V E G E T A B L E S<br />
F O R S I X T E E N C O N S E C U T IV E Y E A R S<br />
T ons o f 2000 pounds.<br />
K inds 1897 1898 1899 1900 1901 1902 1903 1904 1905 1906 1907 1908 1910<br />
Green d eciduous<br />
Citrus fruits. . . .<br />
D ried fruits . ...<br />
R aisins..................<br />
N uts and o liv e s ..<br />
Canned fruits<br />
and vegetables<br />
W ine and brandy-<br />
72,350.2<br />
98,5 4 7.0<br />
75.159.7<br />
39.0 6 5.8<br />
5 ,8 0 8 .6<br />
73,464.7<br />
69.732.2<br />
180,658.9<br />
76.662.7<br />
47.796.3<br />
5,8 1 5 .8<br />
52.219.7<br />
9 6 .9 4 3 .6<br />
131,916.8<br />
86,925.3<br />
36.008.7<br />
6 ,6 0 8 .4<br />
75,240.0<br />
91,176.5<br />
226,546.6<br />
9 0 .052.8<br />
36,047.0<br />
6 ,5 1 8 .4<br />
75.556.9<br />
93,673.7<br />
323,8 71.4<br />
106,987.1<br />
43.3 1 4.0<br />
8,4 6 2 .4<br />
83.229.1<br />
100,390.9<br />
225 ,668.8<br />
151,944.5<br />
47,575.2<br />
10,918.9<br />
8 0 ,634.8<br />
101,198.7<br />
299,623.4<br />
149,531.1<br />
3 9 ,9 6 3 .4<br />
9 ,3 7 7 .4<br />
94,2 0 4.8<br />
7 3 .983.6<br />
3 85 ,747 .6<br />
156,769.3<br />
54.134.7<br />
9,8 1 0 .5<br />
8 6 ,077.9<br />
1 1 5 ,0 8 3 .6<br />
4 5 4 ,0 8 3 .4<br />
1 18 ,479 .3<br />
32,634.7<br />
7,610.5<br />
9 1 ,877.9<br />
113 ,679.0<br />
383 .418.9<br />
112.176.9<br />
4 2 ,457.3<br />
5 ,1 3 1 .5<br />
77,626.5<br />
106,066.0<br />
413,696.1<br />
184.821.6<br />
*<br />
7,1 9 8 .0<br />
1 04.624.6<br />
161.224.0<br />
3 9 9 .094.0<br />
133.846.0<br />
*29,6 0 1.0<br />
10,887.5<br />
t 8 5 ,135 .0<br />
9 3 ,500.8<br />
7 0,758.2<br />
203,275<br />
475,959<br />
154,756<br />
61,584<br />
12,438<br />
f 7 1,223<br />
86,014<br />
75,656<br />
1909<br />
B y rail<br />
204,876<br />
446,384<br />
128,892<br />
67,278<br />
12,308<br />
The above figures for 1912 are those reported by the Southern Pacific, Santa Fe and Western Pacific lines.<br />
1912 the figures reported were from the Southern Pacific and Santa Fe only.<br />
C A R L O A D S 10 T O N S EACH .<br />
T otal carloads fresh, dried and canned fruits and vegetables and wines and brandy since<br />
1890.. .......... 16,195 1896.............38,254 190? ..............77,538 1908.............. 98,604<br />
1891.. .......... 23,347 1897.. .......... 48,072 1903 ..............88,085 1909. ............ 120,690<br />
1892.. ..........25,633 1898.. .......... 56,149 1904 ..............92,053 1910. ............ 109,456<br />
1893.. .......... 40,929 1899.. .......... 55,483 1905 .............. 99,409 1911. ............ 116,267<br />
1894.. ..........43,624 1900.. .......... 66,798 1906 .............. 90,587 1912. ............ 116,913<br />
1895.. ..........45,257 1901.. .......... 83,732 1907 ..............95,299<br />
t73,746<br />
78,829<br />
82,144<br />
1911<br />
B y rail<br />
187,884<br />
580,799<br />
114,483<br />
*46,513<br />
12,751<br />
+83,258<br />
130,738<br />
83,952<br />
1912<br />
B y rail<br />
167 ,603.9<br />
479 ,098 .8<br />
194,175.2<br />
15,399! i<br />
89,946.1<br />
129 ,659.6<br />
9 3 ,2 4 9 .8<br />
Previous to<br />
Ca l if o r n ia D e v e l o p m e n t b o a r d
Digitized for FRASER<br />
http://fraser.stlouisfed.org/<br />
<strong>Federal</strong> <strong>Reserve</strong> <strong>Bank</strong> <strong>of</strong> <strong>St</strong>. <strong>Louis</strong><br />
SHIPMENTS OF FRUITS, VEGETABLES, ETC. 17<br />
Lack <strong>of</strong> uniformity in classification <strong>of</strong> some kinds <strong>of</strong> products by the several<br />
roads prevents their segregation more specially in this table. For instance “ dried<br />
fruits” are made to include prunes and raisins, to comply with the economics and<br />
methods <strong>of</strong> accounts <strong>of</strong> the freight <strong>of</strong>fices.<br />
Previous to 1910 shipments <strong>of</strong> fruits, vegetables, etc. by rail and sea were not<br />
segregated.<br />
*A11 shipments <strong>of</strong> raisins and prunes by rail are included in dried fruits in<br />
1907 and some in 1908. The 1911 raisin shipments are only reported in part; the<br />
rest are included under dried fruits as they are in 1912.<br />
includes shipments <strong>of</strong> canned vegetables. The pack <strong>of</strong> canned fruits and<br />
vegetables for 1911 and 1912 is given on other pages.<br />
Dairy and poultry products, fresh and canned fruits and vegetables taken on<br />
at this port as supplies and not included above, reach a value <strong>of</strong> about $1,650,000.<br />
According to figures furnished by the three railroads above mentioned there<br />
were brought into California from other states, dairy produce and eggs, 20,597,800<br />
lbs.; dressed and live poultry, game and fish, 9,039,200 lbs., an increase <strong>of</strong> some<br />
eight million pounds over 1911. This shows that there is no over production <strong>of</strong><br />
these commodities in California.<br />
One road reports nearly a million pounds each <strong>of</strong> potatoes and dried peas<br />
and beans as having been brought into the <strong>St</strong>ate during 1912.<br />
Reproduced from the Unclassified I Declassified Holdings <strong>of</strong> the National Archives<br />
San Francisco 'Bay -and Vicinity<br />
1
Digitized for FRASER<br />
http://fraser.stlouisfed.org/<br />
<strong>Federal</strong> <strong>Reserve</strong> <strong>Bank</strong> <strong>of</strong> <strong>St</strong>. <strong>Louis</strong><br />
18 CALIFORNIA DEVELOPMENT BOARD<br />
CITRUS AND DECIDUOUS FRUITS<br />
Citrus The shipment <strong>of</strong> citrus fruits from California for the season November<br />
Fruits. 1, 1911 to October 31, 1912 was well above the average <strong>of</strong> the last five<br />
years, but some 6000 cars short <strong>of</strong> the previous year which was the record<br />
by about that figure. 10,000 boxes went to New Zealand in October, 1911, on<br />
a rush order for the holiday trade. The crop totaled 40,176 carloads, <strong>of</strong> which<br />
30,241 were <strong>of</strong> oranges and 5,941 <strong>of</strong> lemons went from south <strong>of</strong> Tehachapi. The<br />
balance, 3,994 carloads, went from Central and Northern California. The shipments<br />
from this section begin the first week in November and the oranges bring<br />
from $4 to $5 per box. These shipments were by freight and exclusive <strong>of</strong> what<br />
was marketed within the <strong>St</strong>ate and those shipped East by express. The development<br />
<strong>of</strong> the citrus industry in California, which now amounts to between 25,000,-<br />
000 and 30,000,OCX) boxes, can be seen by reference to the table <strong>of</strong> shipments on<br />
another page. It is nearly three times as great as all the other states combined.<br />
Fresh The fruit distributing associations and others furnish statistics <strong>of</strong> ship-<br />
Fruit. ments <strong>of</strong> deciduous fruits to Eastern markets for the year 1912, as given<br />
in the table herewith.<br />
As the varieties are shown, they add to the value <strong>of</strong> the tables <strong>of</strong> shipments.<br />
The figures are for actual carloads without regard to tons in a car. The minimum<br />
fixed by the railway companies now is 13 tons, but a carload is <strong>of</strong>ten 30 tons.<br />
Other tables in the report retain the original 10-ton unit. As an illustration, the<br />
table on another page shows 16,122 carloads <strong>of</strong> fresh fruit for 1908, while the Fruit<br />
Association’s table gives the number at 12,917 cars. An apparent discrepancy occurs<br />
in using actual carloads in one instance and the 10-ton unit in the other.<br />
Variety <strong>of</strong> Climate— Oranges and Snow in Southern California.
Digitized for FRASER<br />
http://fraser.stlouisfed.org/<br />
<strong>Federal</strong> <strong>Reserve</strong> <strong>Bank</strong> <strong>of</strong> <strong>St</strong>. <strong>Louis</strong><br />
SHIPM ENTS OF CURED FRU ITS 19<br />
SHIPMENTS FROM NORTH OF TEHACHAPI<br />
Varieties 1905 1906 1907 1908 1909 1910 1911 1912<br />
Cherries.......................................................<br />
Apricots...................................................<br />
Peaches........................................................<br />
Plums and prunes....................................<br />
Pears............................................................<br />
Grapes..........................................................<br />
* Apples........................................................<br />
79<br />
279<br />
1946<br />
1391<br />
1013<br />
1602<br />
1761<br />
150<br />
16<br />
584<br />
1220<br />
1513<br />
2052<br />
770<br />
98<br />
71<br />
699<br />
1039<br />
1039<br />
3460<br />
1085<br />
208 M<br />
231 %<br />
1980M<br />
1763<br />
2701^2<br />
3816M<br />
2216<br />
250<br />
210<br />
2599<br />
1526<br />
2638<br />
5880<br />
2188<br />
19<br />
250<br />
290<br />
2518<br />
1552<br />
2361<br />
4948<br />
2153<br />
2163^<br />
214^<br />
2027<br />
1391<br />
2324<br />
6374^<br />
*Miscellaneous........................................... 16 M a<br />
244<br />
195<br />
1621<br />
1775<br />
3134<br />
6354<br />
T otal........................... '........................ 8071 6305 7491 12917 15280 14072 12539 13340<br />
*Includes Quinces, Persimmons and Figs previous to 1909 not counted separately.<br />
While the above table includes no apple shipments for 1912, the Watsonville<br />
district reports 3331 carloads from the Pajaro Valley and adjacent region, and<br />
Sonoma County reports 645 carloads from that county. The total shipments by<br />
rail from all the <strong>St</strong>ate are seen on another page.<br />
Reproduced from the Unclassified I Declassified Holdings <strong>of</strong> the National Archives<br />
Dried Nearly all kinds <strong>of</strong> deciduous fruits are dried for the market, but prunes,<br />
Fruits. peaches and apricots are the most important. The dried output <strong>of</strong> all,<br />
except figs, varies largely according to the season, the demand <strong>of</strong> the<br />
Eastern market for fresh fruit, and the prices <strong>of</strong>fered by the canners.<br />
OUTPUT OF CURED FRUITS, INCLUDING PRUNES AND RAISINS, 1905-1912<br />
In Tons<br />
1905<br />
1906<br />
1907<br />
1908<br />
1909<br />
1910<br />
1911<br />
1912*<br />
Apples.............<br />
Apricots..........<br />
Figs.................<br />
Peaches..........<br />
Prunes............<br />
Raisins............<br />
Various other,<br />
Pears, Plums,<br />
e tc .,..............<br />
2,500<br />
18,000<br />
3,200<br />
18,000<br />
31,250<br />
45,000<br />
2,750<br />
2,500<br />
3.000<br />
3.000<br />
10,000<br />
92,500<br />
50,000<br />
2,700<br />
3,300<br />
1,100<br />
4,500<br />
15.000<br />
53.000<br />
75.000<br />
1,200<br />
3,350<br />
19.000<br />
2,900<br />
23.000<br />
28,500<br />
65.000<br />
3,000<br />
3.000<br />
14.000<br />
4.000<br />
20.000<br />
75.000<br />
70.000<br />
2,500<br />
3,000<br />
15,250<br />
3,775<br />
25.000<br />
40.000<br />
62,500<br />
1,750<br />
3,500<br />
8,800<br />
5,250<br />
13.000<br />
88.000<br />
67,500<br />
1,750<br />
3,500<br />
18,500<br />
5,000<br />
27.000<br />
97.000<br />
85.000<br />
3,000<br />
Total tons.. 120,700<br />
1912 (Approximate).<br />
163,700<br />
153,100<br />
144,750<br />
188,500<br />
151,275<br />
187,800<br />
239,000<br />
Prunes. Of dried fruits, prunes come next in importance to raisins. Prunes are<br />
grown in many counties throughout the <strong>St</strong>ate; the largest center <strong>of</strong> this<br />
industry is the Santa Clara Valley. A good many prunes are grown in the San Joaquin<br />
and Sacramento Valleys and also in Contra Costa and Sonoma Counties.<br />
The output varies largely in different years.<br />
C A L IF O R N IA P R U N E O U T P U T<br />
Year T ons Year T ons<br />
1898....................................................... 45,210 1906.,................................................... 92,500<br />
56,863 1907....................................................... .......53,000<br />
1900 ................ 87,000 1908 .............................................................. 28,500<br />
1901 .. 40,800 1909 .............................................................. 77,500<br />
1902 .. 98,500 1910.............................................................. 45,000<br />
1903 . . . .... 82,500 1911.............................................................. 88,000<br />
190 4 67,500 1912.............................................................. 97,000<br />
190 5 31,250
Digitized for FRASER<br />
http://fraser.stlouisfed.org/<br />
<strong>Federal</strong> <strong>Reserve</strong> <strong>Bank</strong> <strong>of</strong> <strong>St</strong>. <strong>Louis</strong><br />
20 CALIFORNIA DEVELOPMENT BOARD<br />
‘■*3* ....'•<br />
Interior <strong>of</strong> Cannery<br />
By Courtesy San Jose Chamber <strong>of</strong> Commerce.<br />
Exports and Imports<br />
<strong>of</strong> Dried Fruits.<br />
The following exhibit is <strong>of</strong> some interest in this connection<br />
as showing the trend <strong>of</strong> trade in dried fruits.<br />
(Compiled by George Robertson, Fresno, Cal.)<br />
EXPORTS AND IM PORTS OF CALIFORNIA RAISINS AND OTHER CURED FRUITS AND<br />
ORANGES<br />
RAISINS<br />
(Pounds)<br />
EXPORTS<br />
(Pounds)<br />
Year Export Import Apricots Peaches Prunes Oranges<br />
(Boxes)<br />
1905....................... 3,978,645 11,511,347 13,616,010 700,902 34,820,748<br />
1906...........................<br />
1907...........................<br />
1908...........................<br />
9,749,690<br />
4,720,606<br />
7,084,178<br />
4.537.648<br />
9,927,771<br />
4,875,693<br />
3,268,457<br />
1,540,471<br />
14,463,948<br />
1,819,863<br />
1,354,317<br />
1,296,095<br />
31,777,704<br />
37,674,800<br />
18,087,319 714,365<br />
1909...........................<br />
1910...........................<br />
1911...........................<br />
1912...........................<br />
8,363,845<br />
15,547,074<br />
20,052,711<br />
19,949,046<br />
5.219.649<br />
3,022,918<br />
3,554,794<br />
3,255,861<br />
13,644,135<br />
18,366,055<br />
12,194,491<br />
13,413,430<br />
2,843,968<br />
4,946,406<br />
6,406,822<br />
4,425,803<br />
83,128,101<br />
64,470,370<br />
67,679,170<br />
74,328,074<br />
952,869<br />
962,229<br />
1,265,000<br />
1,197,363<br />
California’s export <strong>of</strong> cured fruits, especially prunes and raisins, is steadily increasing,<br />
while the importations are falling <strong>of</strong>f. The quantity <strong>of</strong> fruit exported<br />
depends to a certain extent on the size <strong>of</strong> the crop.
Digitized for FRASER<br />
http://fraser.stlouisfed.org/<br />
<strong>Federal</strong> <strong>Reserve</strong> <strong>Bank</strong> <strong>of</strong> <strong>St</strong>. <strong>Louis</strong><br />
EXPORTS BY SEA 21<br />
E X P O R T S BY SE A 1912<br />
Product. Value Shipped m ostly to<br />
Canned Fruits .....................................$5,447,798 England<br />
Fruit in G lass....................................... 77,493 New Y ork & England<br />
Canned V egetables............................ 1,587,166 New Y ork & Canada<br />
Pickles & Sauces................................. 130,253 Oceanica & Hawaiian Is.<br />
Canned M ilk......................................... 280,325 Hawaiian Is. & Philippine Is.<br />
Canned M eats....................................... 410,109 Alaska & Philippine Is.<br />
Beans & Dried P eas........................... 1,180,482 Alaska & New Y ork<br />
Dried A p p les......................................... 98,583 New Zealand<br />
Dried A p ricots..................................... 1,100,266 Germany, Oceanica, Canada & New Y ork<br />
Dried P eaches....................................... 340,334 Germany, Canada & New Y ork<br />
Dried Prunes......................................... 2,719,692 Germany, Canada, Netherlands & New Y ork<br />
Dried Raisins....................................... 1,246,485 New York, England, New Zealand & Phil. Is.<br />
*Other Dried Fruit .......................... 427,096 Germany, England & New Y ork<br />
Nuts ........................................................ 241,483 New Y ork & Hawaiian Islands<br />
A pricot Kernels . .................................... 123,483 Germany & Netherlands<br />
*(T h ese do not include shipments for consum ption “ en v o y a g e ” )<br />
I t is w o r t h y o f n o te th at C a n a d a an d A u stra la s ia are a b o u t o u r b e s t c u s to m e r s<br />
fo r d rie d fru its an d raisin s, G e rm a n y o n ly e x c e e d in g th e m in d rie d fru its.<br />
T h e a b o v e w ill g iv e s o m e idea o f th e d is tr ib u tio n o f C a lifo r n ia p r o d u c ts in a d <br />
d itio n t o th e rail sh ip m e n ts to N e w Y o r k w h e re m a n y o r d e rs fr o m a b ro a d are<br />
filled.<br />
Reproduced from the Unclassified I Declassified Holdings <strong>of</strong> the National Archives<br />
Drying Apricots, San Benito County<br />
By Courtesy <strong>of</strong> “Sunset” Magazine.<br />
FRESH FRUITS AND VEGETABLES<br />
No other <strong>St</strong>ate in the Union and few other countries in the world <strong>of</strong>fer such a<br />
variety <strong>of</strong> fresh orchard and garden products throughout the year as does California.<br />
In one or another section <strong>of</strong> the <strong>St</strong>ate, fresh fruits and vegetables <strong>of</strong> superior<br />
quality are to be had in every month <strong>of</strong> the twelve. “The Garden Calendar,” by<br />
Pr<strong>of</strong>. E. J. Wickson, shows that as far north as Red Bluff, conditions admit <strong>of</strong> planting<br />
for market eight kinds <strong>of</strong> vegetables in November, five in December, ten in<br />
January, eleven in February, fourteen in March, eighteen in April, and every<br />
month has something in the list, the smallest being August with four kinds.
Digitized for FRASER<br />
http://fraser.stlouisfed.org/<br />
<strong>Federal</strong> <strong>Reserve</strong> <strong>Bank</strong> <strong>of</strong> <strong>St</strong>. <strong>Louis</strong><br />
22 CALIFORNIA DEVELOPMENT BOARD<br />
Fresh Vegetables<br />
Besides supplying the home markets abundantly the shipments <strong>of</strong> fresh vegetables<br />
to the Eastern markets in 1911 and 1912, amounted to some 130 tons, and<br />
are increasing year by year.<br />
The principal kinds and the districts from which they go are as follows:<br />
Asparagus........Delta Region, Los Angeles, Alameda<br />
Cabbage............Los Angeles, San Francisco, San Jose<br />
Cauliflower___ Los Angeles, San Francisco and Alameda<br />
Celery............... Los Angeles, San Francisco, <strong>St</strong>ockton<br />
Melons............. Los Angeles, <strong>St</strong>ockton<br />
Potatoes......... Los Angeles, San Francisco and Alameda<br />
Tom atoes........Los Angeles, Delta Region, Alameda<br />
Onions............. San Jose, San Francisco, Delta Region and other points<br />
Artichokes___ Los Angeles, San Jose and other points<br />
Lettuce............Los Angeles, San Jose and other points<br />
Rhubarb......... Alameda, Sacramento Valley, San Joaquin Valley and Central California<br />
Shipments <strong>of</strong> melons, etc., from Imperial County and celery, etc., from Orange<br />
County are included in Los Angeles territory.<br />
The ‘‘Delta Region" includes all the country <strong>of</strong> the lower Sacramento and San<br />
Joaquin rivers.<br />
Shipments from North <strong>of</strong> Bay Counties by rail are included in those from San<br />
Francisco.<br />
By potatoes is meant only the shipments <strong>of</strong> early potatoes.<br />
In 1912 the total shipments out <strong>of</strong> the <strong>St</strong>ate <strong>of</strong> cantaloupes was between 3,000<br />
and 3,500 carloads.<br />
Canning The canning <strong>of</strong> fruit and vegetables is an important industry in Cali-<br />
Industry. fornia and the yearly output <strong>of</strong> canned goods is very large. The aggregate<br />
number <strong>of</strong> cases <strong>of</strong> all kinds <strong>of</strong> fruit and berries canned in<br />
1912 and the vegetable output was larger than for any previous year. The demand<br />
for fresh fruit and vegetables at home and for shipping, takes a large quantity that<br />
would otherwise go to the canner.<br />
The following exhibit from various publications, viz: the “California Fruit<br />
Grower,” “Western Packer and Canner,” etc., is made <strong>of</strong> the various kinds in detail<br />
<strong>of</strong> California fruits and vegetables canned in 1910, 1911 and 1912.<br />
By permission we here give a summary <strong>of</strong> the California canned fruit and vegetable<br />
pack for 1910-11-12, and <strong>of</strong> the total California fruit packs, which is <strong>of</strong> itself<br />
very interesting and instructive. The pineapples are packed by California enterprise<br />
but are exported from Hawaii.<br />
CANNED FRUITS—Cases.<br />
1910* 1911< 1912* (Est.)<br />
Production During<br />
Last Twelve Years<br />
Apples..........................<br />
Apricots.......................<br />
Blackberries................<br />
Cherries, Royal Anne.<br />
Cherries, Black..........<br />
Cherries, W h ite........<br />
Grapes.........................<br />
Loganberries................<br />
Pears............................<br />
Peaches, Free.............<br />
Peaches, Cling............<br />
Peaches, W. H...........<br />
Plums...........................<br />
Raspberries.................<br />
<strong>St</strong>rawberries................<br />
Other Fruits...............<br />
Pineapples...................<br />
76,830<br />
743,160<br />
62,025<br />
136,290<br />
19,620<br />
40,285<br />
45,645<br />
12,639<br />
619,355<br />
748,825<br />
1,396,625<br />
80,360<br />
10,126<br />
14,073<br />
3,390<br />
65.000<br />
904.000<br />
77.000<br />
110.000<br />
29.000<br />
60.000<br />
70.000<br />
20.000<br />
620,000<br />
730.000<br />
1,350,000<br />
1*65,666<br />
3.000<br />
7.000<br />
5.000<br />
750.000<br />
106,956<br />
634,405<br />
120,810<br />
235,094<br />
45,038<br />
19,924<br />
704,782<br />
859,145<br />
1,300,687<br />
28,058<br />
142,790<br />
10,596<br />
14,548<br />
25,218<br />
1,000,000<br />
Year<br />
Cases<br />
1901 2,677,082<br />
1902 2,252,790<br />
1903 2,783,504<br />
1904 2,840,614<br />
1905 3,283,296<br />
1906 3,109,225<br />
1907 2,982,985<br />
1908 4,734,663<br />
1909 3,047,001<br />
1910 4,008,549<br />
1911 4,182,650<br />
1912 4,248,051<br />
Total Fruits.<br />
*Pie Fruits were included.<br />
4,009,248 4,300,000<br />
4,248,051
Digitized for FRASER<br />
http://fraser.stlouisfed.org/<br />
<strong>Federal</strong> <strong>Reserve</strong> <strong>Bank</strong> <strong>of</strong> <strong>St</strong>. <strong>Louis</strong><br />
CALIFORNIA RAISIN CROP 23<br />
From the “ California Fruit Grower” and “ Western Packer and Canner” the following exhibit<br />
shows the kinds <strong>of</strong> vegetables canned in 1910-11-12:<br />
CANNED VEGETABLES— Cases.<br />
1910 1911 1912<br />
Tomatoes...........................................................................................<br />
Asparagus.........................................................................................<br />
1,350,310<br />
167,775<br />
617,275<br />
1,500,000<br />
185.000<br />
700.000<br />
Spinach.............................................................................................<br />
Squash...............................................................................................<br />
Beans and Other Vegetables...................................................... 115,285 130,000<br />
1,574,444<br />
272,070<br />
750,000<br />
17,082<br />
20,520<br />
72,459<br />
Total Vegetables................................................................... 2,250,645 2,515,000 2,706,575<br />
The pack <strong>of</strong> canned vegetables for the years 1910 and 1911 was: Cases, 1910, 2,250,645; 1911,<br />
2,516,655, <strong>of</strong> which the tomato pack leads. Canned asparagus comes next with 50,000 more cases<br />
than in 1911.<br />
Canning <strong>of</strong> fresh vegetables is carried on at various points where there is an<br />
ample supply grown.<br />
Asparagus is mainly canned in the Sacramento district, San Jose and Orange<br />
Counties.<br />
Peas mostly in Southern California.<br />
Tomatoes in Southern California, Santa Clara Valley and Sacramento Valley.<br />
The Vineyard. California is the most important factor in viticulture in the United<br />
<strong>St</strong>ates. It has over 90,000,000 vines, more than all the other <strong>St</strong>ates.<br />
It represents an investment <strong>of</strong> $150,000,000 which returns an annual income to the<br />
grower <strong>of</strong> over $15,000,000. Over 60,000 people are dependent upon California’s viticultural<br />
industry. This includes our 10,000 grape growers, 600 wine makers, and<br />
the laborers who do the picking and hauling, those employed in the wineries and<br />
those engaged in handling the wine for distribution.<br />
According to the 1910 report <strong>of</strong> the <strong>St</strong>ate Board <strong>of</strong> Equalization, nearly<br />
350.000 acres are devoted to grape growing. Of this, 275,000 acres are in full<br />
bearing. 36,000 acres are devoted to table grapes; 109,000 to raisin grapes and<br />
130.000 to wine grapes.<br />
The shipments <strong>of</strong> table grapes out <strong>of</strong> the <strong>St</strong>ate by rail for 1912 amounted to<br />
6,354 carloads.<br />
Raisins. The center <strong>of</strong> the raisin industry is in Fresno County, although raisins<br />
are produced in other parts <strong>of</strong> the <strong>St</strong>ate. The crop varies from year to<br />
year, as the appended table shows; that for 1910 exceeds the average <strong>of</strong> the six preceding<br />
years:<br />
C A L IF O R N IA R A IS IN CR O P<br />
Y ear. Tons. Year. Tons.<br />
1897 .................. .......................46.852 1905 ................... .......................43,750<br />
1898 .................. .......................40,365 1906 .................... .......................47,500<br />
1899 ........ ’ ......... ...................... 35,784 1907 .................... .........................60,000<br />
1900 ................... .......................47,167 1908 .................... ........................60,000<br />
1901 ............................................37,125 1909 .................... ...................... 70,000<br />
1902 .................. .......................54,375 1910 .................... ...................... 56,000<br />
1903 ................... .......................60,000 1911 .................... ...................... 67,500<br />
1904 .................... ...................... 37,500 1912 .................... ...................... 85,000<br />
The above figures show that Fresno County now produces about 60 per cent<br />
<strong>of</strong> the California raisin crop, and nearly twice the quantity produced by Spain,<br />
which produces from 15,000 to 30,000 tons and has held the lead for centuries. It<br />
was in 1892 that the California raisin crop first equaled that <strong>of</strong> Spain, and it has been<br />
increasing the difference ever since.
Digitized for FRASER<br />
http://fraser.stlouisfed.org/<br />
<strong>Federal</strong> <strong>Reserve</strong> <strong>Bank</strong> <strong>of</strong> <strong>St</strong>. <strong>Louis</strong><br />
u<br />
CALIFORNIA DEVELOPMENT BOARD<br />
Seeded Raisins<br />
Fresno County is the center <strong>of</strong> the seeded raisin industry, where it originated.<br />
The following figures show the wonderful increase in this popular form <strong>of</strong> raisins<br />
during the last fifteen years:<br />
Year. Tons. Year. Tons.<br />
1896 ................... ....................... 700 1905 ................... .....................21,000<br />
1897 ................... ..................... 3,500 1906 ................... ..................... 24,000<br />
1898 ................... ..................... 7,000 1907 ................... .....................26,000<br />
1899 ................... .....................12,000 1908 ................... ..................... 24,000<br />
1900 ................... .....................14,000 1909 ................... .....................28,000<br />
1901 ................... .....................14,000 1910 ................... ..................... 31,500<br />
1902 ................... .....................16,000 1911 ................... .....................33,000<br />
1903 ................... .....................18,000 1912 ................... ..................... 35,500<br />
1904 ........; ......... ..................... 18,000<br />
(The above are only approximate figures.)<br />
COUNTIES W H E R E C ALIFO R N IA RAISINS A R E PRODU CED<br />
County.<br />
Crop <strong>of</strong> 1909—pounds.<br />
Fresno ........................................................................................................ 84,000,000<br />
Tulare ....................................................................................................... 20,000,000<br />
Kings . ................... ..................................................................................... 18,000,000<br />
Sutter ......................................................................................................... 4,000,000<br />
San Bernardino ........................................................................................ 3,600,000<br />
San Diego ................................................................................................ 3,200,000<br />
Madera ........................................................................................................ 2,400,000<br />
Y olo ........................................................................................................... 2,000,000<br />
Kern ........................................................................................................... 1,100,000<br />
Colusa ........................................................................................................ 800,000<br />
Los Angeles ............................................................................................. 300,000<br />
Total crop .......................................................................................... 140,000,000<br />
WINE AND BRANDY.<br />
Wine and Brandy. During the past ten years the manufacture <strong>of</strong> California<br />
wines has more than doubled, as shown by the following<br />
table. The yield for 1911 was about 49,280,000 gallons. The production <strong>of</strong> sweet<br />
wines was the greatest in the history <strong>of</strong> the industry, viz: 23,280,044.48 gallons,<br />
while the dry wine output totaled about 26,000,(XX) gallons.<br />
WINE AND BRANDY PRODUCTION 1897-1912<br />
Year<br />
Dry Wines<br />
Gals.<br />
1897......................................................................................... 28,736,400<br />
1898......................................................................................... 10.750.000<br />
1899......................................................................................... 15.103.000<br />
1900......................................................................................... 16,737,260<br />
1901......................................................................................... 16,473,731<br />
1902......................................................................................... 28,224,146<br />
1903......................................................................................... 21,900,500<br />
1904......................................................................................... 15,589,342<br />
1905......................................................................................... 20,000,000<br />
1906......................................................................................... 26,000,000<br />
Sweet Wines<br />
Gals.<br />
5,197,500<br />
7.779.000<br />
8.330.000<br />
6.940.300<br />
6.270.300<br />
14,835,146<br />
12,670,356<br />
13,571,856<br />
10,700,000<br />
15,000,000<br />
1907......................................................................................... 27,500,500 15,500,000<br />
1908......................................................................................... 22,500,000 14,750,000<br />
1909......................................................................................... 27,000,000 18,000,000<br />
1910......................................................................................... 27,500,000 18,000,000<br />
1911......................................................................................... 26,000,000 23,280,044<br />
1912 (estimated) .......................................... ....................... 22,500,000 17,797,781<br />
Brandy<br />
Gals.<br />
1,442,468<br />
1.250.000<br />
1,699,035<br />
3,256,513<br />
1,688,482<br />
4,564,173<br />
1.972.000<br />
4,420,839<br />
1.250.000<br />
1.345.000<br />
1.500.000<br />
1.750.000<br />
2,000,000<br />
2.500.000<br />
2,000,000<br />
1,799,539<br />
California wines have a wide and growing market. The railroad shipments,<br />
on another page, go mainly to Eastern points, while those by sea go to the four<br />
quarters <strong>of</strong> the world.<br />
In this connection the following is <strong>of</strong> interest:
Digitized for FRASER<br />
http://fraser.stlouisfed.org/<br />
<strong>Federal</strong> <strong>Reserve</strong> <strong>Bank</strong> <strong>of</strong> <strong>St</strong>. <strong>Louis</strong><br />
EXPORTS OF WINE, BRANDY, ETC. 25<br />
Champagne Cellar near Asti<br />
EXPO RT OF W INE BY SEA<br />
Year Cases Gallons Value<br />
Number <strong>of</strong><br />
Countries<br />
Receiving<br />
1908.......................................................................... 4,250,799 $1,657,089 12<br />
1909.......................................................................... 7,440,294 2,386,111 23<br />
1910.......................................................................... 9,866,539 3,162,600 26<br />
1911.......................................................................... 11,535 15,125,375 4,910,138 32<br />
1912.......................................................................... 11,388 13,238,223 4,537,753 33<br />
The commercial brandy production <strong>of</strong> California during 1911 passed the<br />
2,000,000 mark, while the brandy manufactured for the fortification <strong>of</strong> sweet wines<br />
was 6,100,521.31 gallons.<br />
The shipments <strong>of</strong> wine out <strong>of</strong> California by rail during 1912 were about 19,600,-<br />
000 gallons, while the exports by sea amounted to 11,388 cases and 13,238,223<br />
gallons, valued at $4,537,753. To this must be added the brandy exported, which<br />
was 1,024 cases and 67,122 gallons, valued at $72,841. Thirty-three countries, besides<br />
the United <strong>St</strong>ates, received this wine.<br />
The output <strong>of</strong> champagne naturally fermented in bottles for 1912 was about<br />
750,000 bottles, or near 74,000 cases. This new industry will be greatly extended<br />
the coming season.<br />
Three manufactories are at present engaged in making this champagne.<br />
Nearly 300,000 cases will be ready for the Exposition visitors in 1915.
Digitized for FRASER<br />
http://fraser.stlouisfed.org/<br />
<strong>Federal</strong> <strong>Reserve</strong> <strong>Bank</strong> <strong>of</strong> <strong>St</strong>. <strong>Louis</strong><br />
26 CALIFORNIA DEVELOPMENT BOARD<br />
Olives,<br />
Olive culture is one <strong>of</strong> the oldest fruit industries in the <strong>St</strong>ate. The<br />
Olive Oil, Etc. first orchard was planted in San Diego in 1769, and that county is<br />
a large producer <strong>of</strong> olives and olive oil. There are large orchards<br />
in other counties, and every year adds to the number <strong>of</strong> trees. There are thirtythree<br />
counties-reporting over 1,000 trees each, ranging from Shasta on the north to<br />
the Mexican line on the south. The number <strong>of</strong> trees, as reported by the <strong>St</strong>ate<br />
Board <strong>of</strong> Equalization, is about 1,002,000 in bearing. Los Angeles leads with 320,-<br />
800 bearing trees.<br />
<strong>St</strong>atistics <strong>of</strong> this industry are difficult to obtain. This industry is becoming<br />
more attractive from a remunerative point <strong>of</strong> view, and the removal <strong>of</strong> competition<br />
with adulterated oil by the Pure Food regulations has given quite an impetus to<br />
planting new trees. Estimates <strong>of</strong> the production for 1912 range from 750,000 to<br />
920,000 gallons <strong>of</strong> olive oil, and from 1,000,000 to 1,200,000 gallons <strong>of</strong> pickled<br />
olives.<br />
Imports 1910-11 were 4,500,000 gallons <strong>of</strong> oil and over 3,000,000 gallons <strong>of</strong><br />
pickled olives.<br />
Uncertainty as to tariff changes on olive importations and other causes have<br />
in the two or three years induced some olive growers to turn their attention to other<br />
fruits. Recently, however, the new planting has been large in some more favorable<br />
districts for the industry.<br />
Honey. While honey is produced for the market in all <strong>of</strong> the principal valleys,<br />
the great bulk <strong>of</strong> the commercial product comes from the San Joaquin<br />
Valley and the counties south. The crop for 1909 was the record crop and many<br />
thousands <strong>of</strong> stands <strong>of</strong> bees are sent from other states to winter in California.<br />
Gathering Almonds near Lodi<br />
By Courtesy <strong>of</strong> “Sunset” Magazine.
Digitized for FRASER<br />
http://fraser.stlouisfed.org/<br />
<strong>Federal</strong> <strong>Reserve</strong> <strong>Bank</strong> <strong>of</strong> <strong>St</strong>. <strong>Louis</strong><br />
ALMONDS AND WALNUTS 27<br />
According to figures furnished by the <strong>St</strong>ate Bee-Keepers Association there are<br />
about 588,000 colonies <strong>of</strong> bees in the <strong>St</strong>ate with an average <strong>of</strong> 70 pounds <strong>of</strong> honey<br />
a year, valued at 6 cents a pound.<br />
The estimates <strong>of</strong> the honey product for several years are:<br />
Year. Pounds. Year. Pounds.<br />
1899 .............. .............. 2,822,000 1906 .............. .............. 5,250,000<br />
1900 .............. .............. 2,208,000 1907 .............. .............. 8,700,000<br />
1901 ............... .............. 8,112,000 1908 .............. .............. 5,250,000<br />
1902 .............. .............. 5,125,000 1909 .............. .............. 11,532,000<br />
1903 .............. .............. 8,400,000 1910 .............. .............. 5,500,000<br />
1904 .............. .............. 7,000,000 1911 .............. .............. 9,500,000<br />
1905 .............. .............. 9,500,000 1912 .............. .............. 4,710,000<br />
Silk. The raising <strong>of</strong> silk worms which attracts some attention, is increasing slowly<br />
in California and though not yet on a commercial basis, it is likely to become<br />
a good industry. The climate in California is admitted to be adapted to the<br />
raising <strong>of</strong> silk. The season for production extends over a period <strong>of</strong> six to eight<br />
months, while in Europe it lasts only as many weeks.<br />
Reproduced from the Unclassified / Declassified Holdings <strong>of</strong> the National Archives<br />
Nuts. The production <strong>of</strong> almonds fluctuates greatly and the crop for 1912<br />
equalled that <strong>of</strong> 1908, which was the record. The production <strong>of</strong> walnuts<br />
is more regular, and the crop for the year though less than that <strong>of</strong> 1911 was above<br />
the average and gave good returns.<br />
ALMONDS AND WALNUTS<br />
Year<br />
Almonds ^ Walnuts<br />
Tons (2;000 lbs.)<br />
Year<br />
Almonds ^Walnuts<br />
Tons (2,000 lbs.)<br />
1895....................................... 825 2,310 1904....................................... 800 7,590<br />
1896....................................... 1,605 4,115 1905....................................... 2,125 5,750<br />
1897........................................ 2,375 3,985 1906....................................... 900 6,125<br />
1898........................................ 450 5,650 1907....................................... 750 8,250<br />
1899....................................... 2,320 5,530 1908....................................... 3.000 8,000<br />
....................................... 2,740 1900 5,430 1909....................................... 1,650 7,500<br />
1901....................................... 1,560 6,910 1910....................................... 2,750 8,500<br />
1902....................................... 3,270 8,520 1911....................................... 1,700 12,000<br />
1903....................................... 3,200 5,500 1912....................................... 3.000 9,250<br />
ALMONDS AND WALNUTS.<br />
At an average value <strong>of</strong> $300 per ton, the aggregate <strong>of</strong> these crops is<br />
$4,110,000.<br />
The average production <strong>of</strong> walnuts in California for the past fifteen years<br />
was about 7,668 tons.<br />
The average importations for last eight years about 13,471 tons.<br />
The average production <strong>of</strong> almonds for fifteen years in California was 1,982<br />
tons.<br />
The quantitity <strong>of</strong> almonds grown in California is so small, compared with<br />
the importations that prices vary according as the latter are light or heavy.<br />
DAIRY INDUSTRY.<br />
The dairy industry is year by year more extended and important. Comparative<br />
statistics <strong>of</strong> butter production <strong>of</strong> the <strong>St</strong>ate for a series <strong>of</strong> years beginning
Digitized for FRASER<br />
http://fraser.stlouisfed.org/<br />
<strong>Federal</strong> <strong>Reserve</strong> <strong>Bank</strong> <strong>of</strong> <strong>St</strong>. <strong>Louis</strong><br />
28 CALIFORNIA DEVELOPMENT BOARD<br />
with 1896 show the growth <strong>of</strong> the industry, and yet the supply falls so far short<br />
<strong>of</strong> the demand as to necessitate the bringing in <strong>of</strong> large quantities <strong>of</strong> butter from<br />
other <strong>St</strong>ates. At the same time large quantities <strong>of</strong> butter go East on special order<br />
from those who have tasted California creamery butter.<br />
The season, as covered by the report <strong>of</strong> the <strong>St</strong>ate Dairy Bureau, ends September<br />
30th <strong>of</strong> each year.<br />
Despite the persistent efforts <strong>of</strong> that bureau some creameries and large producers<br />
in a number <strong>of</strong> counties failed to make report <strong>of</strong> their production for the<br />
year 1911.<br />
Scientific Scientific dairying has almost wholly superseded the old methods in<br />
Dairying. California, as the following table, showing the number <strong>of</strong> pounds<br />
<strong>of</strong> butter produced in the <strong>St</strong>ate by the creamery method and the old method for<br />
seven years ending October 1, 1902, demonstrates:<br />
Year<br />
Creamery<br />
Method<br />
Old method<br />
Totals<br />
1896............................................................................................. 10,097,323 21,508,117 31,605,440<br />
1897............................................................................................. 10,866,646 17,811,793 28,678,439<br />
1898............................................................................................. 10,410,479 13,280,549 23,691,028<br />
1899............................................................................................. 12,725,814 12,143,270 24,869,084<br />
1900............................................................................................. 16,486,695 12,296,164 28,782,859<br />
1901............................................................................................. 19,017,512 10,713,370 29,730,882<br />
1902............................................................................................. 21,593,021 9,935,741 31,528,763<br />
Since 1902 the growth is indicated in the following exhibit:<br />
Year.<br />
Pounds.<br />
1903 34,676,311<br />
190 4 35,636,909<br />
190 5 41,961,047<br />
1906 44,044,578<br />
190 7 44,599,211<br />
190 8 '...................... 48,469,585<br />
190 9 49,595,869<br />
1910 45,819,741<br />
1911 (Reported by <strong>St</strong>ate Dairy Bureau)...........................50,380,736<br />
1912 “ “ “ “ “ ............................ 54,940,886<br />
California is now well to the front as a dairy <strong>St</strong>ate. The production <strong>of</strong> butter<br />
for 1912 is the largest in the history <strong>of</strong> the industry. The increase is mostly in<br />
counties where irrigation is practiced.<br />
IRRIGATION AND DAIRYING.<br />
As showing the effect <strong>of</strong> irrigation on the dairy interests the following exhibit<br />
from the reports <strong>of</strong> the <strong>St</strong>ate Dairy Bureau, giving the product <strong>of</strong> butter in<br />
pounds by principal counties, in which irrigation is practiced, is instructive:<br />
Counties 1907 1908 1909 1910 1911 1912<br />
Fresno...............................<br />
Kern..................................<br />
Kings.................................<br />
Merced..............................<br />
Sacramento......................<br />
San Joaquin....................<br />
<strong>St</strong>anislaus.........................<br />
Tulare...............................<br />
Yolo...................................<br />
Imperial............................<br />
Totals...........................<br />
Humboldt (non-irrig.)...<br />
2,786,817<br />
372,569<br />
1,960,364<br />
2,469,726<br />
1,060,098<br />
1,625,538<br />
3,615,469<br />
2,522,707<br />
726,532<br />
3,315,926<br />
521,495<br />
2,419,651<br />
2,831,846<br />
1,277,771<br />
1,605,152<br />
4,113,866<br />
2,729,377<br />
944,268<br />
1,165,763<br />
3,721,262<br />
545,900<br />
3,432,879<br />
1,396,865<br />
1,592,138<br />
2,350,000<br />
4,155,701<br />
2,307,238<br />
807,787<br />
1,677,640<br />
3,290,825<br />
565,900<br />
3,218,036<br />
2,510,269<br />
1,102,012<br />
1,425,543<br />
*4,363,296<br />
3,072,198<br />
1,103,114<br />
1,948,941<br />
3,803,644<br />
693,413<br />
3,552,542<br />
3,102,222<br />
1,405,054<br />
941,430<br />
5,166,515<br />
3,955,583<br />
1,096,718<br />
2,885,941<br />
4,144,404<br />
732,059<br />
3,069,881<br />
1,351,049<br />
1,900,417<br />
1,336,344<br />
6,894,225<br />
3,947,284<br />
1,104,509<br />
4,110,736<br />
17,139,820 20,925,115 21,987,410 22,599,903 26,603,062 30,590,908<br />
4,390,815 4,495,041 4,715,998 4,790,280 5,238,382 5,095,014
Digitized for FRASER<br />
http://fraser.stlouisfed.org/<br />
<strong>Federal</strong> <strong>Reserve</strong> <strong>Bank</strong> <strong>of</strong> <strong>St</strong>. <strong>Louis</strong><br />
DAIRY INDUSTRY 29<br />
Imperial is entirely dependent on irrigaton, and its butter production, since<br />
its formation in 1908, has grown nearly four-fold as the above shows.<br />
Evaporated milk was produced in the following counties; in 1911:<br />
H um boldt .................... 3,233,906 pounds Marin .............................. 336,000' pounds<br />
San Benito .................. 4,914,404 pounds Sonom a .......................... 336,000 pounds<br />
While irrigation has been a most important factor in the increase <strong>of</strong> butter<br />
production, as shown above, Humboldt County, with its abundant rainfall rendering<br />
irrigation unnecessary, claims the position <strong>of</strong> the second county <strong>of</strong> the <strong>St</strong>ate in<br />
dairy products, as shown by the tables, and second in butter production.<br />
S H IP M E N T S O F D A IR Y P R O D U C T S F R O M H U M B O L D T C O U N T Y , 1912.<br />
(F rom records <strong>of</strong> the H um boldt Chamber <strong>of</strong> Com merce.)<br />
Article. W eight, lbs. Value.<br />
Butter ........................................................................................................5,112,960 $1,558,235<br />
Cheese ........................................................................................................ 162,820 26,050<br />
Condensed Milk and Cream ............................................................... 2,791,010 218,665<br />
D ry Milk ..................................................................................................1,027,340 135,070<br />
Fresh Cream and Milk and Butterm ilk......................................... 136,490 4,170<br />
Casein ........................................................................................................ 1,497,870 89,870<br />
Totals ................................................................................................. 10,728,490 $2,032,060<br />
There is annually consumed within Humboldt County, <strong>of</strong> home produced<br />
butter, some 1,500,000 lbs. and a small percentage <strong>of</strong> cheese, condensed milk<br />
and dry milk.<br />
A comparatively new branch <strong>of</strong> the dairy industry is the production <strong>of</strong> commercial<br />
casein. It is now produced extensively in the northern counties <strong>of</strong> the<br />
<strong>St</strong>ate. It is used as a sizing in making high-grades <strong>of</strong> paper, also for piano<br />
keys, billiard balls, and everywhere that ivory can be used.<br />
Humboldt County in 1911 produced 1,953,500 lbs. <strong>of</strong> casein and Del Norte<br />
County produced 120,000 lbs. In 1912 Humboldt produced 1,497,870 lbs.<br />
Holstein Dairy Herd, Sacramento Valley. (Courtesy <strong>of</strong> “Sunset” Magazine)
Digitized for FRASER<br />
http://fraser.stlouisfed.org/<br />
<strong>Federal</strong> <strong>Reserve</strong> <strong>Bank</strong> <strong>of</strong> <strong>St</strong>. <strong>Louis</strong><br />
30 CALIFORNIA DEVELOPMENT BOARD<br />
CHEESE PRODUCTION.<br />
Although the <strong>St</strong>ate has nearly doubled in butter production in ten years<br />
ending 1910, the cheese production has not kept pace therewith. The cheese<br />
produced and reported to the <strong>St</strong>ate Dairy Bureau is, with a few exceptions, only<br />
that made by the ordinary Cheddar process. There is a considerable amount <strong>of</strong><br />
fancy and hand made cheese which has not been reported. Out <strong>of</strong> the fiftyeight<br />
counties in the <strong>St</strong>ate, twenty-five produced cheese during the year. Monterey,<br />
Marin, Santa Clara, San Benito and Merced, in the order named, are the<br />
leading counties. Comparing the totals for the past fifteen years we have the<br />
following:<br />
Year.<br />
Pounds.<br />
1897 6,399,625<br />
1898 5,148,372<br />
1899 ................................5,294,938<br />
1900 4,989,960<br />
1901 5,681,366<br />
1902 6,503,441<br />
1903 7,218,639<br />
1904 6,133,898<br />
Year.<br />
Pounds.<br />
1905 6,020,672<br />
1906 6,418,480<br />
1907 5,928,942<br />
1908 6,162,514<br />
1909 5,931,194<br />
1910 . . . . . . ...................................4,648,348<br />
1911 4,580,495<br />
1912 4,785,617<br />
Large quantities <strong>of</strong> butter and cheese continue to come from the East, notwithstanding<br />
the superior advantages presented in this <strong>St</strong>ate for enlarging this<br />
branch <strong>of</strong> farming and for creamery development. It is interesting to note that<br />
11,758,680 pounds <strong>of</strong> cheese, more than double the amount manufactured in this<br />
<strong>St</strong>ate, is received in the San Francisco market alone. All we need is more good<br />
cheese factories and 500 or 1,000 families to produce the milk.<br />
The following are the monthly receipts <strong>of</strong> butter and prices therefor in<br />
San Francisco for the two years ending September 30, 1912:<br />
1910-1911. Pounds. Price. 1911-1912. Pounds. Price.<br />
October ......... ........ 702,900 34.53 October .......... ........ 1,946,800 30.68<br />
November ____........ 968,600 35.12 November ___ ........ 1,300,350 31.39<br />
December .... ........ 731,400 35.03 December ___ ........ 1,114,900 33.03<br />
January .......... ........ 1,036,000 32.08 January .......... ........ 1,236,400 35.38<br />
February ....... ........ 1,296,100 30.16 February ........ ........ 1,723,400 34.60<br />
March ............. ........ 1,553,500 26.86 March ............. ....... 1,645,900 31.42<br />
April ............... ........ 2.190,500 21.60 April ..........;. ........ 2,183,600 27.71<br />
May ............... ......... 3.088,800 22.73 May ................. ........ 2,883,600 25.29<br />
June ............... ....... 2,036,600 21.92 June ............... ........ 2,309,400 27.60<br />
July ................. ........ 1,873,400 23.10 July ................. ........ 2,620,400 27.82<br />
August ............ ........ 2,009,100 25.75 August ........... ........ 2,626,400 31.31<br />
September 1,546,700 26.82 September .... ........ 1,957,700 33.08<br />
T o t a l......... ........19,033,600 28.00 Total ......... ....... 23,548,850 30.77<br />
The following are the monthly receipts <strong>of</strong> cheese and prices therefor in San<br />
Francisco for the two years ending September 30, 1912:<br />
1910-1911. Pounds. Price. 1911-1912. Pounds. Price.<br />
October ............ .... 603,900 16.68 October ___ ... 728,080 14.57<br />
November ........ ___ # ,0 0 0 16.48 November . . . 619,500 16.50<br />
December ........ .... 351,900 16.66 December ......... .... 496,400 15.96<br />
January ............ — 637,000 16.64 January .............. .. . 594,500 16.15<br />
February ..........____ 645,500 15.95 February ............ ... 780,200 16.42<br />
March ............... .... 610,000 12.91 March ................. ... 552,900 18.85<br />
April ................. .... 626,000 12.52 April .................. . . . 987,800 16.92<br />
May ................... .... 1,057,300 12.44 May ..................... . . . 1,762,200 13.59<br />
June ................... .... 1,047,200 12.03 June ................... . . . 1,584,600 13.69<br />
July ................... .... 1,047,900 13.01 July ..................... . . . 1,391,400 14.12<br />
August .............. .... 1,601,200 14.00 August ............... . . . 1,504,200 14.04<br />
September ........ .... 500,300 14.17 September .......... .. . 756,900 14.65<br />
Total .......... .... 9,632,200 14.50 Total ........ ...11,758,680 15.46
Digitized for FRASER<br />
http://fraser.stlouisfed.org/<br />
<strong>Federal</strong> <strong>Reserve</strong> <strong>Bank</strong> <strong>of</strong> <strong>St</strong>. <strong>Louis</strong><br />
POULTRY INDUSTRY 31<br />
A N N U A L V A L U E O F D A IR Y P R O D U C T S .<br />
1911.<br />
. Butter, 50,380,736 pounds ............................................................................................... $14,106,606<br />
Cheese, 4,640,495 pounds ............................................................................................... 672,872<br />
Evaporated and powdered milk, 8,820,310 p o u n d s................................................. 793,828<br />
Market milk, table cream and ice cream ................................................................... 10,000,000<br />
Calves produced ............................................................................................................... 2,000,000<br />
Skim milk and butter milk ........................................................................................... 1,500,000<br />
Casein .................................................................................................................................... 125,478<br />
T otal ............................................................................................................................. $29,198,784<br />
1912.<br />
Butter, 54,940,886 pounds ............................................................................................. $16,905,310<br />
Cheese, 4,785,617 pounds.................................................................................................. 739,856<br />
Condensed, evaporated and powdered milk, 9,770,784 pounds........................ 961,662<br />
Casein, 1,065,000 p o u n d s ............ .................................................................................... 53,250<br />
Market milk and cream ................................................................................................. 10,000,000<br />
Calves produced on dairies ......................................................................................... 2,000,000<br />
Skim milk and butter milk ........................................................................................... 1,500,000<br />
Total ............................................................................................................................. $32,160,078<br />
Reproduced from the Unclassified / Declassified Holdings <strong>of</strong> the Nationat Archives<br />
P O U L T R Y I N D U S T R Y .<br />
In a more or less practical way the poultry industry has been carried on in all<br />
parts <strong>of</strong> the <strong>St</strong>ate, but in Sonoma, Los Angeles, Orange, Santa Clara, Merced,<br />
Sacramento, Colusa, Humboldt, San Benito and Inyo Counties, and to a less extent<br />
in some others, the latest scientific methods are generally practiced with gratifying<br />
results. The industry is constantly extending, as the demand for poultry<br />
products greatly exceeds the home supply. Turkey-farming, as it is called, is<br />
mainly in the grain districts where the fowls can range. Hatching by incubators<br />
prevails generally. The largest incubator factory in the world is in Petaluma and<br />
turns out about 100,000 chicks per month, and runs to full capacity most <strong>of</strong> the<br />
year.<br />
A ranch which has recently been started in Inyo County with 400 acres and<br />
12,000 laying hens selected from Petaluma and from Monroe, N. Y., is an enterprise<br />
that is bidding for patronage, and with its 200,000 incubator capacity and<br />
favorable climatic conditions, will do a large part in supplying the demand,<br />
especially for eggs and baby chicks. There are many places throughout California<br />
where like enterprises could be undertaken with a fair promise <strong>of</strong> success<br />
and a good market near at hand.<br />
The average chicken ranch near Petaluma consists <strong>of</strong> about five acres, upon<br />
which are placed 500 to 3,000 hens. There are, <strong>of</strong> course, quite a number larger<br />
ranches which maintain 5,000 to 30,000 chickens. A person should have from<br />
$3,000 to $5,000 to equip a chicken ranch and get ready for a pr<strong>of</strong>itable business<br />
In case <strong>of</strong> renting, however, about $1,500 is needed to start the prospective poultryman.<br />
The average pr<strong>of</strong>it on each hen is about $1.00 per year.<br />
Notwithstanding the remarkable development <strong>of</strong> the poultry business at Petaluma<br />
and other places, the increase is not sufficient to meet the demands <strong>of</strong> the<br />
immediate market. The rapidly expanding population <strong>of</strong> the <strong>St</strong>ate requires the<br />
importation in season <strong>of</strong> some 425 carloads <strong>of</strong> live and 75 carloads <strong>of</strong> dressed<br />
poultry to San Francisco and Los Angeles, besides several million dozen eggs<br />
each year from Eastern points, and there is no immediate prospect <strong>of</strong> the home<br />
supply overtaking the market. This fact insures the success <strong>of</strong> all practical<br />
poultrymen who engage in the industry in California.<br />
Petaluma is the principal shipping point <strong>of</strong> Sonoma County and enjoys a<br />
freight rate by boat to San Francisco <strong>of</strong> ten cents per case <strong>of</strong> 36 dozen eggs. The<br />
market business done from that point, and its growth, is reflected in the following<br />
tables:
Digitized for FRASER<br />
http://fraser.stlouisfed.org/<br />
<strong>Federal</strong> <strong>Reserve</strong> <strong>Bank</strong> <strong>of</strong> <strong>St</strong>. <strong>Louis</strong><br />
32<br />
CALIFORNIA DEVELOPMENT BOARD<br />
SHIPMENTS OF EGGS AND POULTRY FROM PETALUM A<br />
Year<br />
Eggs<br />
Dozen<br />
Poultry<br />
Dozen<br />
1903.<br />
1904.<br />
1905.<br />
1906.<br />
1907.<br />
1908.<br />
1909.<br />
1910.<br />
1911.<br />
1912.<br />
3,407,333 32,535<br />
3,493,321 33,286<br />
3,837,061 39,392<br />
4,334,321 39,938<br />
4,422,968 59,198<br />
5,312,804 83,136<br />
7,159,481 120,018<br />
7,288,215 76,278<br />
8,134,129 80,553<br />
10,232,121 84,425<br />
The above figures represent actual shipments <strong>of</strong> eggs to market. It is but<br />
fair to say that over one and one-half million dozen eggs are produced which are<br />
used for hatching and for home consumption. These added to the above, bring the<br />
total production <strong>of</strong> the Petaluma district up to near eleven and three-quarter<br />
million dozen, or about 141,000,000 eggs. 3,000,000 baby chicks are estimated to<br />
have been shipped away.<br />
The daily food requirements for poultry in the Petaluma district for the year<br />
aggregate over 600 tons, or 1,200,000 pounds, <strong>of</strong> which wheat, corn, barley, bran<br />
and middlings form the largest part, v iz : about 490 tons.<br />
P O U L T R Y P R O D U C T IO N , 1912.<br />
Eggs, doz.<br />
Petaluma ..................................................................................................... 10,232,121<br />
Other points in Sonoma C ounty......................................................... 5,116,000<br />
Total, other counties .............................................................................26,750,000<br />
Total for the S t a t e ...........................................................................42,098,121<br />
Poultry, doz.<br />
84,425<br />
42,200<br />
167,500<br />
294,125<br />
White Leghorns,<br />
Poultry Farm in Sonoma County, Cal.<br />
Courtesy <strong>of</strong> Petaluma Chamber <strong>of</strong> Commerce
Digitized for FRASER<br />
http://fraser.stlouisfed.org/<br />
<strong>Federal</strong> <strong>Reserve</strong> <strong>Bank</strong> <strong>of</strong> <strong>St</strong>. <strong>Louis</strong><br />
F IS H IN G IN D U S T R Y 33<br />
FISH IN G IN D U S T R Y .<br />
Both the interior and the coastal waters <strong>of</strong> California abound in food and game<br />
fish, <strong>of</strong>fering inducements both to the pleasure-seeker and the pr<strong>of</strong>it-earner.<br />
There are about 165 species <strong>of</strong> cold-water fauna whose proper home is north<br />
<strong>of</strong> Point Conception, and 117 species <strong>of</strong> semi-tropical fauna found south <strong>of</strong> Point<br />
Conception, beyond the reach <strong>of</strong> the cold currents <strong>of</strong> the north.<br />
Of these, one hundred and thirty-three varieties <strong>of</strong> food fish are found in the<br />
San Francisco markets, including oysters and shell fish.<br />
Over-fishing and destruction <strong>of</strong> spawning beds through lumbering and placer<br />
mining caused a steady decrease in supply <strong>of</strong> salmon in the Sacramento basin.<br />
Through the work <strong>of</strong> the <strong>Federal</strong> and <strong>St</strong>ate Commissioners, however, the rivers<br />
have been re-stocked and now there are more salmon in the Sacramento River<br />
than ever before, but they are mostly marketed as fish.<br />
The <strong>St</strong>ate maintains seven hatcheries, at one <strong>of</strong> which, the Sisson hatchery,<br />
more salmon fry are hatched than at any other hatchery in the world. There is<br />
also one hatchery and two egg-collecting stations under <strong>Federal</strong> supervision.<br />
Some 30,762,000 fry <strong>of</strong> various kinds <strong>of</strong> food and game fishes were deposited in<br />
the streams in 1910. Over 30,000,000 pounds <strong>of</strong> the fish taken for the market are<br />
caught m the waters <strong>of</strong> the bay counties and the Sacramento River.<br />
The Alaska Packers’ Association maintains two large hatcheries in Alaska,<br />
and in 1912 nearly 137,830,100 salmon fry were liberated in the rivers.<br />
Besides her home fisheries, packing salmon in Alaska waters and Puget Sound<br />
employs over fifty San Francisco vessels, many men and a large amount <strong>of</strong> California<br />
capital. The following tables show California’s share <strong>of</strong> the industry, which<br />
is very large:<br />
P A C IF IC C O A S T F IS H IN G IN D U S T R Y .<br />
Extent <strong>of</strong> industry<br />
California<br />
Capital employed .............................................................................................................. $10,000,000<br />
Number <strong>of</strong> persons em p loyed....................................................................................... 9,000<br />
Earnings <strong>of</strong> labor em ployed......................................................................................... 2,250,000<br />
Value <strong>of</strong> o u tp u t.................................................................................................................. 7,000,000<br />
<strong>St</strong>eamboat on Sacramento River Carrying Produce<br />
Courtesy <strong>of</strong> “Sunset” Magazine
Digitized for FRASER<br />
http://fraser.stlouisfed.org/<br />
<strong>Federal</strong> <strong>Reserve</strong> <strong>Bank</strong> <strong>of</strong> <strong>St</strong>. <strong>Louis</strong><br />
34 CALIFORNIA DEVELOPMENT BOARD<br />
The California pack <strong>of</strong> mild cured salmon for 1912 was 3,374 tierces, 800 pounds<br />
each.<br />
The San Francisco codfish fleet, consisting <strong>of</strong> 13 vessels, representing an investment<br />
<strong>of</strong> $475,000, in 1912 took 11,000,000 pounds <strong>of</strong> fish, valued at $350,000.<br />
The San Francisco whaling fleet, consisting <strong>of</strong> 8 vessels, took in 1911 58,000<br />
pounds <strong>of</strong> bone, valued at $188,500, and 2,300 bbls. <strong>of</strong> sperm oil, valued at $38,640.<br />
Canned salmon and other fisheries products are sent by sea from San Francisco<br />
to nearly every country in the world. Shipments during 1911 were as follows:<br />
Quantity<br />
Cases Pounds Vslus<br />
Canned salmon and other salm on................ 700,063 18,561.611 $3,927,053<br />
The Alaska Packers’ Association report their pack for 1912 as 1,202,779 cases.<br />
FARM ANIMALS<br />
The following figures for 1911 from the Crop Reporter <strong>of</strong> the Department <strong>of</strong><br />
Agriculture, revised by the light <strong>of</strong> the census, show an increase over 1910 in the<br />
number <strong>of</strong> all farm animals, except mules, an increase in average price <strong>of</strong> all except<br />
sheep and swine, and an increase in total number <strong>of</strong> 526,000 and an increase<br />
in total value <strong>of</strong> $28,744,000. W e also give figures for 1912, which show a slight increase<br />
over 1911 in number and value.<br />
1910 1911 1912<br />
K inds<br />
N um ber<br />
Average<br />
Price V alue N um ber<br />
Average<br />
Price V alue N um ber<br />
A verage<br />
Price<br />
V alue<br />
H orses.................<br />
M u le s .................<br />
M ilch C ow s. . .<br />
O ther cattle. . .<br />
Sheep..................<br />
Sw in e..................<br />
425.000<br />
80,000<br />
500.000<br />
1,100,000<br />
2,200,000<br />
500.000<br />
$ 117.00<br />
133.00<br />
4 8 .0 0<br />
2 3 .5 0<br />
3 .9 0<br />
7 .2 0<br />
$ 49,725,000<br />
10.640.000<br />
24,000,000<br />
25.850.000<br />
8.580.000<br />
3.600.000<br />
493.000<br />
72,000<br />
505.000<br />
1.515.000<br />
2.656.000<br />
830.000<br />
$ 11 7 .00<br />
136.00<br />
5 3 .0 0<br />
2 6 .7 0<br />
3 .0 0<br />
8 .3 0<br />
$ 57,681,000<br />
9.792.000<br />
26.765.000<br />
40.450.000<br />
9.562.000<br />
6.889.000<br />
503.000<br />
73,000<br />
510.000<br />
1.454.000<br />
2.603.000<br />
822.000<br />
$10 9 .00<br />
1 30.00<br />
5 3 .5 0<br />
2 9 .2 0<br />
3 .7 0<br />
9 .2 0<br />
$ 54,822,700<br />
9.490.000<br />
27.285.000<br />
42.457.000<br />
9.631.000<br />
7.562.000<br />
T o t a l......... 4,805,000 $122,395,000 5,331,000 $151,139,000 5,965,000 $151,247,700<br />
The number <strong>of</strong> sheep is less than the average <strong>of</strong> previous years. This is partly<br />
ascribed to the extension <strong>of</strong> the forest reserve and restriction <strong>of</strong> grazing areas.<br />
It is estimated that about 55,000 head <strong>of</strong> cattle, 160,000 sheep and 65,000 hogs are<br />
slaughtered for market in the <strong>St</strong>ate each month, a part <strong>of</strong> which comes from<br />
adjoining <strong>St</strong>ates. Enlarged outside markets and increasing home demand auger<br />
well for the future <strong>of</strong> the stock-growing industry, especially <strong>of</strong> hogs. The Government<br />
gives the average age at which hogs are marketed in the Pacific <strong>St</strong>ates<br />
at twelve months.<br />
The census report gives as <strong>of</strong> April 15, 1910, the following from 80,304 farms<br />
reporting.<br />
Kind Farms Reporting Number Value<br />
Cattle ......................................................... 63,053 2,077,025 $52,785,068<br />
H orses and colts .....................................76,119 468,886 47,099,196<br />
Mules and mule colts .......................... 11,015 69,761 9,016,444<br />
Asses and b u r r o s ...................................... 1,099 2,592 347,315<br />
Swine ......................................................... 31,609 766,551 5,106,803<br />
Sheep and lambs .......................................3,857 2,417,477 8,348,997<br />
Goats and kids ...........................................1,714 138,413 320,829<br />
Dairy cows are included in cattle. 61,101 farms reported 467,332 cows and<br />
heifers, valued at $18,597,328. The number and price is increasing.<br />
Wool. The wool clip, as estimated by Mr. E. H. Tryon <strong>of</strong> San Francisco, shows<br />
a decline compared with that <strong>of</strong> 1911. The table shows that it is the smallest<br />
since 1867 and only about one-fourth <strong>of</strong> that <strong>of</strong> 1876, the record year. The<br />
vast ranges that prevailed in the valleys <strong>of</strong> California at that time are now covered<br />
by small farms and orchards.
Digitized for FRASER<br />
http://fraser.stlouisfed.org/<br />
<strong>Federal</strong> <strong>Reserve</strong> <strong>Bank</strong> <strong>of</strong> <strong>St</strong>. <strong>Louis</strong><br />
F IE L D C R O P S 35<br />
WOOL PRODUCTION OF CALIFORNIA— 1854-1912<br />
Year Pounds Year Pounds Year Pounds<br />
1854 175,000 1873 32,155,169 1893 33,169,375<br />
1855 300,000 1874 39,356,781 1894 36,968,400<br />
1856 600,0.00 1875 43,532,223 1895 35,856,690<br />
1857 1,100,000 1876 56,550,973 1896 27,195,550<br />
1858 1,428,000 1877 53,110,742 1897 34,882,325<br />
1859 2,378,000 1878 40,862,091 1898 28,063,240<br />
1860 3,055,327 1879 46,903,360 1899 28,332,090<br />
1861 3,721,998 1880 46,074,154 1900 27,750,000<br />
1862 5,990,300 1881 45,076,639 1901 26,900,000<br />
1863 6,268,480 1882 40,529,119 1902 21,000,000<br />
1864 7,923,670 1883 40,848,690 1903 22,000,000<br />
1865 8,949,931 1884 37,415,330 1904 22,000,000<br />
1866 8,532,047 1885 36,561,390 1905 22,000,000<br />
1867 10,288,600 1886 38,509.160 1906 24,000,000<br />
1868 14,232,687 1887 31,564,231 1907 15,000,000<br />
1869 15,413,970 1888 32,569,972 1908 15,000,000<br />
1870 20,072,660 1889 34,008,370 1909 16,000,000<br />
1871 22,187,188 1890 34,854,640 1910 15,500,000<br />
1872 24,255,468 1891 33,183,475 1911 14,000,000<br />
1892 35,802,930 1912 13,500,000<br />
Note.— “ Pulled” Wool not included in table.<br />
FIELD CROPS<br />
Grain. The following table from the recc rds <strong>of</strong> the U. S. Department <strong>of</strong> Agriculture<br />
shows the yearly production <strong>of</strong> the four principal grain crops in the<br />
<strong>St</strong>ate since 1898 and <strong>of</strong> rye since 1907:<br />
W h eat B a rley C orn Oats R ye<br />
B ushels B ushels B ushels Bushels Bushels<br />
Y ea r 60 lbs. 48 lbs. 56 lbs. 32 lbs. 60 lbs.<br />
1898 ........ .......... 12,403,700 12,263,461 1,184,040 1,943,304<br />
1899 .......... 29,666,666 14,046,087 1,536,975 1,845,787<br />
1900 ................... 20,933,333 19,769,760 1,351,975 1,477,771<br />
1901 ..........28,751,500 26,162,780 1,850,793 4,887,374<br />
1902 .......... 18,759,490 23,489,065 1,839,150 5,148,583<br />
1903 .... .......... 14,880,990 21,075,000 1,777,162 5,756,964<br />
1904 ..........10,895,216 24,418,604 1,350,000 5,250,000<br />
1905 .... .......... 5,660,360 22,094,186 1,204,000 4,735,000<br />
1906 .......... 8,333,330 26,162,790 1,100,000 4,300,000<br />
1907 .......... 10,833,330 25,096,666 1,100,000 4,100,000 1,250,200<br />
1908 ..........11,680,000 25,427,000 1,600,000 6,700,000 792,000<br />
1909 .......... 11,550,000 31,270,000 1,740,000 6,280,000 842,000<br />
1910 ....... ..........17,100,000 43,400,000 1,838,000 8,325,000 986,000<br />
1911 .... .......... 8,640.000 40,600,000 1,836,000 7,140,000 136,000<br />
1912 .......... 629,000 41,760,000 1,924,000 7,800,000 141,000<br />
In the Crop Reporter Supplement for December, 1911, the figures for the production<br />
<strong>of</strong> these grains for 1910 and 1911 revised by the light <strong>of</strong> the census<br />
showed a material decrease in production <strong>of</strong> all except barley from figures previously<br />
published.<br />
The acreage devoted to wheat is falling <strong>of</strong>f year by year. Competition with<br />
cheap land in other countries and other more pr<strong>of</strong>itable crops have caused the vast<br />
wheat ranches <strong>of</strong> a few decades ago to be cut up into small farms to meet the demand<br />
from the many homeseekers, who are pouring into California.<br />
Grain Crops. The yield and values <strong>of</strong> the cereal crops sown for the harvest <strong>of</strong><br />
1912, as given by the Department <strong>of</strong> Agriculture, are as follows:<br />
W heat<br />
Barley<br />
Corn<br />
Oats .,<br />
Rye .,<br />
R E P O R T O F C R O P S F O R 1912.<br />
Acres Bushels Value<br />
370.000 6,270.000 $5,850,000<br />
1,392,000 46,760.000 29,232,000<br />
52.000 1,924,000 1,635,000<br />
200.000 7,800,000 4,200,000<br />
8,000 141,000 127,000<br />
Reproduced from the Unclassified I Declassified Holdings <strong>of</strong> the Nationat Archives<br />
Total value $41,044,000
Digitized for FRASER<br />
http://fraser.stlouisfed.org/<br />
<strong>Federal</strong> <strong>Reserve</strong> <strong>Bank</strong> <strong>of</strong> <strong>St</strong>. <strong>Louis</strong><br />
36 CALIFORNIA DEVELOPMENT BOARD<br />
It appears from department reports that wheat, formerly the most important<br />
agricultural product <strong>of</strong> the <strong>St</strong>ate, has gradually given place to barley, which now<br />
equals in acreage and exceeds in yield and value all other grain crops combined.<br />
In the seven years ended in 1906, according to the Year Book <strong>of</strong> the Department<br />
<strong>of</strong> Agriculture, the acreage in barley increased 60 per cent, the yield 160 per<br />
cent, and the value 230 per cent. The malting qualities <strong>of</strong> California barley give it<br />
a ready market abroad.<br />
Oats are raised, in some parts <strong>of</strong> the <strong>St</strong>ate, more for hay than for threshing,<br />
while corn is but little used as food for work animals. Barley has long been the<br />
main grain food in California, but <strong>of</strong> late years oats have come into use to quite<br />
an extent.<br />
HAY AND FORAGE CROP<br />
The hay crop <strong>of</strong> California is one <strong>of</strong> her most valuable agricultural products.<br />
The census returns for the crop <strong>of</strong> 1909, a fair year, gave the yield at 4,327,130 tons<br />
valued at $42,187,215. These returns were as follows:<br />
Crop<br />
Farms<br />
reporting<br />
Acres<br />
harvested<br />
Quantity<br />
Amount Unit<br />
Value<br />
Timothy alone.........................................<br />
Timothy and clover mixed..................<br />
Clover alone.............................................<br />
Alfalfa........................................................<br />
Millet or Hungarian grass...................<br />
Other tame or cultivated grasses. . . .<br />
Wild, salt or prairie grasses................<br />
Grains cut green.....................................<br />
Coarse forage...........................................<br />
Root forage..............................................<br />
370<br />
958<br />
703<br />
19,904<br />
101<br />
2,274<br />
3,679<br />
39,397<br />
2,175<br />
1,021<br />
13,725<br />
46,661<br />
8,519<br />
484,134<br />
2,142<br />
90,414<br />
253,127<br />
1,604,745<br />
25,868<br />
4,012<br />
20,001<br />
73,183<br />
20,380<br />
1,639,707<br />
2,688<br />
119,415<br />
281,033<br />
2,019,526<br />
60,611<br />
90,586<br />
Tons $ 185,579<br />
629,575<br />
213,289<br />
13,088,530<br />
27,483<br />
1,253,428<br />
2,028,494<br />
24,056,727<br />
438,095<br />
266,015<br />
Total hay and forage............................<br />
53,760 2,533,347 4,327,130 Tons $42,187,215<br />
Hay (Crop Reporter, 1912)................... 2,500,000 3,825 000 Tons $52,402,000<br />
California grain cut in the milk is highly prized for hay and is sent East by<br />
the trainload for feeding race horses.<br />
Dairying and hog raising in connection with alfalfa raising is becoming one <strong>of</strong><br />
the leading industries <strong>of</strong> the <strong>St</strong>ate being one that is within reach <strong>of</strong> the man with<br />
comparatively small capital.<br />
The acreage <strong>of</strong> standing alfalfa has probably increased 10 per cent since 1909,<br />
making it 580,910 acres. From these, five cuttings may be made yearly on irrigated<br />
ground with an average ag-gregate yield <strong>of</strong> six tons per acre. The yield and<br />
value <strong>of</strong> the crop for 1912 is probably 8 per cent over that <strong>of</strong> 1909.<br />
Beans and Other California is famous for the production <strong>of</strong> dried beans, onions,<br />
Field Crops. potatoes, etc., and they add much to the resources <strong>of</strong> the <strong>St</strong>ate.<br />
From the “ Crop Reporter” and leading authorities in the <strong>St</strong>ate<br />
in handling these products, the following figures are obtained <strong>of</strong> product and value<br />
for 1912:
Digitized for FRASER<br />
http://fraser.stlouisfed.org/<br />
<strong>Federal</strong> <strong>Reserve</strong> <strong>Bank</strong> <strong>of</strong> <strong>St</strong>. <strong>Louis</strong><br />
H O P CROP 37<br />
Product<br />
Lima Beans..............................................................................<br />
Pink Beans...............................................................................<br />
Small White Beans................................................................<br />
Other Varieties........................................................................<br />
Total Beans..................................................................<br />
Sugar Beets..............................................................................<br />
Onions.........................................................................................<br />
Potatoes, Irish.........................................................................<br />
Potatoes, Sweet.......................................................................<br />
Field and Garden Seeds (estimated).................................<br />
Quantity<br />
1,150,000 sacks<br />
350.000 “<br />
200.000 “<br />
840,000 “<br />
2.540.000 sacks<br />
980,894 tons<br />
3.167.000 sacks<br />
11,360,000 “<br />
800,000 crates (2 bus.)<br />
Farm Value at<br />
Harvest Time<br />
$4,887,500<br />
1,225,000<br />
700,000<br />
2,582,750<br />
$9,395,250<br />
5,086,650<br />
2.582.000<br />
7.816.000<br />
1,000,000<br />
2.500.000<br />
Grand T otal................................................................ $28,379,900<br />
Hop Crop. The hop crop in California, as elsewhere, varies greatly from year to<br />
year, influenced largely by market prospects. The crop <strong>of</strong> 1911 was<br />
very remunerative to those growers who had not contracted early in the season at<br />
prevailing prices. Short crops elsewhere sent prices to a very high figure.<br />
The acreage and production by counties for 1912 is as follows:<br />
County.<br />
Acreage. Production in Bales.<br />
S a cra m en to............................................ ............................ 3,485 35,921<br />
Yuba ....................................................................... ............................ 1,328 12,321<br />
Y olo ........................................................................ ............................ 1,274 11,707<br />
Butte ....................................................................... ............ ................ 785 2,584<br />
Tehama .................................................................. ............................ 214 1,862<br />
Sutter ................................................... ..................... 175 1,101<br />
Shasta ..................................................................... ............................ 42 150<br />
T otal Sacramento V a lley............................ .............................7,303 65,646<br />
S o n o m a .................................................................. ............................ 4,700 35,713<br />
M endocino and L ake........................................ .............................1,450 15,115<br />
Alameda ................................................................ ............................ 160 896<br />
Santa Cruz .......................................................... ............................. 50 400<br />
Total Coast Counties.................................... ............................ 6,360 52,124<br />
Total acreage grown in California 1912 crop, 13,667.<br />
Total number <strong>of</strong> bales grown in California, 117,770.<br />
Crop in 1912 117,770 Bales<br />
Crop in 1911 93,981 Bales<br />
23,789 Increase over 1911 crop.<br />
The following table gives California’s crop for a series <strong>of</strong> years:<br />
HOP PRODUCTION IN CALIFORNIA<br />
1900-1912<br />
Year Bales Pounds Year Bales Pounds<br />
1900..........................<br />
1901....................<br />
1902......................<br />
1903..............<br />
1904..............<br />
1905......................<br />
38.000<br />
48.000<br />
53,500<br />
57.000<br />
63.000<br />
7.220.000<br />
9.120.000<br />
10.165.000<br />
10.545.000<br />
11.655.000<br />
13.135.000<br />
1906...........................<br />
1907...........................<br />
1908...........................<br />
1909...........................<br />
1910.....................<br />
1911.....................<br />
1912...........................<br />
108,000<br />
90,000<br />
63,200<br />
69,688<br />
71,511<br />
93,981<br />
117,770<br />
20,000,000<br />
16.650.000<br />
11.692.000<br />
12,892,280<br />
13,229,535<br />
17,367,985<br />
21,198,600
Digitized for FRASER<br />
http://fraser.stlouisfed.org/<br />
<strong>Federal</strong> <strong>Reserve</strong> <strong>Bank</strong> <strong>of</strong> <strong>St</strong>. <strong>Louis</strong><br />
38 CALIFORNIA DEVELOPMENT BOARD<br />
Tobacco The adaptability <strong>of</strong> the soil in certain sections and <strong>of</strong> the climate to the<br />
Growing. growing <strong>of</strong> tobacco has been successfully demonstrated in many sections<br />
<strong>of</strong> the <strong>St</strong>ate, though it is not yet grown to a sufficient extent to be<br />
rated by the Department <strong>of</strong> Agriculture among the commercial crops <strong>of</strong> the <strong>St</strong>ate.<br />
The most notable and successful effort in this line is with Turkish Tobacco,<br />
and has been made in Tulare County and adjacent thereto, under the backing <strong>of</strong> the<br />
John Bollman Company <strong>of</strong> San Francisco. The production has been :<br />
1909 7,000 lbs.<br />
1910 15,000 lbs.<br />
1911 45,000 lbs.<br />
1912 150,000 lbs.<br />
1913 225,000 lbs.<br />
From the prospective acreage and better experience in handling, tobacco is<br />
without doubt destined to be one <strong>of</strong> the remunerative industries <strong>of</strong> the <strong>St</strong>ate when<br />
the culture and curing is more fully understood by the farmers in the sections<br />
where its success has been demonstrated. With imported free seed and the encouragement<br />
given by consumers the acreage for 1913 will be largely increased.<br />
This tobacco commands a large price and a crop can be handled successfully as a<br />
side issue by any farmer who will take the pains and advice and use his intelligence.<br />
RICE, COTTON, FLAX, AND HEMP.<br />
R ice. From experiments made in the Sacramento Valley during recent years by<br />
rice experts <strong>of</strong> the Department <strong>of</strong> Agriculture, the adaptability <strong>of</strong> soil and<br />
climate to the successful culture <strong>of</strong> rice has been demonstrated. Two tracts <strong>of</strong><br />
twenty-five acres each were planted in 1903 in the vicinity <strong>of</strong> Biggs on black adobe<br />
lands. From one planting a yield <strong>of</strong> 3,000 pounds per acre was harvested.<br />
This rice was awarded the gold medal at the Seattle Exposition in 1909.<br />
Plantings made in 1910 justified the expectations <strong>of</strong> those interested both as<br />
to yield and quality.<br />
The planting <strong>of</strong> 1911 given in the Crop Reporter as 150 acres yielding an average<br />
<strong>of</strong> 40 bushels per acre, 6,000 bushels in all, farm value $4,000.<br />
The principal planting is given by the owner as 60 acres, yielding 2,750 pounds<br />
per acre or 16,500 pounds in all.<br />
Three varieties, Wateribune, Shinriki and Patna, chosen from a number previously<br />
tried, were used for this planting.<br />
As given by the U. S. Crop Reporter for 1912, the acreage planted was 1400.<br />
Yield per acre (bushels) 50.<br />
Total production 70,000 pounds.<br />
Value on basis <strong>of</strong> price paid farmers, $64,000.<br />
Rice bids fair to become one <strong>of</strong> the commercial crops <strong>of</strong> the <strong>St</strong>ate.<br />
Cotton. The adaptability <strong>of</strong> soil and climate <strong>of</strong> California to the growing <strong>of</strong> cotton<br />
has been known for some years. Of late, planting has been begun on a<br />
large scale and the acreage is increasing.<br />
In 1909 over 500 acres were planted in the Imperial Valley, Imperial County,<br />
with seeds from Georgia and Texas. The result was most gratifying, an average <strong>of</strong><br />
over one bale, 500 pounds, to the acre being produced, some 600 bales in all, most<br />
<strong>of</strong> which found a ready market at the California Cotton Mills in Oakland. In 1910<br />
some 12,000 acres were cultivated, producing 8,000 bales <strong>of</strong> excellent staple.<br />
About 15,000 acres were planted in 1911, and according to the Crop Reporter,<br />
the production was 11,000 bales, 500 pounds each. It was valued for lint at $385,-<br />
000, and for seed at $31,000; $416,000 in all.<br />
The acreage is increasing every year.<br />
The value <strong>of</strong> the export <strong>of</strong> cotton shipped from Imperial County and <strong>of</strong> a comparatively<br />
small acreage <strong>of</strong> the valley, but south <strong>of</strong> the boundary line, for the season<br />
1912-13 is estimated at about $3,000,000.<br />
The new industry has called for the erection <strong>of</strong> eight gins besides one or more<br />
cotton-seed oil mills.
Digitized for FRASER<br />
http://fraser.stlouisfed.org/<br />
<strong>Federal</strong> <strong>Reserve</strong> <strong>Bank</strong> <strong>of</strong> <strong>St</strong>. <strong>Louis</strong><br />
BEET SUGAR INDUSTRY 39<br />
The cotton growing has proved a success also in the Coachella Valley and at<br />
Semi-Tropic in Kern County, where a planting <strong>of</strong> 40 acres <strong>of</strong> Egyptian Cotton<br />
did well.<br />
Cotton is being tried at other places in the <strong>St</strong>ate with encouraging results.<br />
All the cotton produced in California will find a ready home market and<br />
probably cause additional factories to be added to the few already in operation in<br />
the <strong>St</strong>ate.<br />
The Japanese are already in the field as buyers <strong>of</strong> California cotton.<br />
F la x and H em p. The culture <strong>of</strong> these valuable textile plants has lately received an<br />
impetus in several localities that promises important developments.<br />
Growers have received $120 and upward per ton, according to the quality<br />
and fineness <strong>of</strong> the fiber. The soil in some places along the Sacramento and San<br />
Joaquin Rivers is suitable for producing a fine quality <strong>of</strong> hemp. The California<br />
Cotton Mills <strong>of</strong> Oakland buy nearly all the hemp grown in this <strong>St</strong>ate, which is manufactured<br />
into twine <strong>of</strong> various kinds, for all <strong>of</strong> which there is a market in the <strong>St</strong>ate.<br />
B E E T S U G A R I N D U S T R Y .<br />
The beet sugar industry <strong>of</strong> the United <strong>St</strong>ates was originated in California, at<br />
Alvarado, Alameda County, and here as elsewhere grows yearly in importance.<br />
In 1911-12 the acreage in California was about 101,000, the yield over 1,000,000<br />
tons <strong>of</strong> beets and the output 162,538.4 short tons <strong>of</strong> sugar, leaving her in the lead <strong>of</strong><br />
the beet sugar producing <strong>St</strong>ates with 35 per cent <strong>of</strong> the total production <strong>of</strong> the<br />
United <strong>St</strong>ates, 572,415 tons.<br />
For the campaign for 1912-13 California with 100,612 acres, produced 980,894<br />
tons <strong>of</strong> beets, had a sugar output <strong>of</strong> 155,432 tons <strong>of</strong> sugar, gave first place to<br />
Colorado, with 142,369 acres, 1,683,158 tons <strong>of</strong> beets and a sugar output <strong>of</strong> 223,181<br />
tons. Lack <strong>of</strong> winter rains in California and an increase <strong>of</strong> 719,158 acres in Colorado<br />
can account for the difference.<br />
The California factories and their locations were:<br />
Spreckels Sugar Co., Spreckels, Monterey County.<br />
Spreckels Sugar Co., Watsonville, Santa Cruz County.<br />
American Beet Sugar Co., Oxnard, Ventura County.<br />
American Beet Sugar Co., Chino, San Bernardino County.<br />
Union Sugar Co., Betteravia, Santa Barbara County.<br />
Los Alamitos Sugar Co., Los Alamitos, Orange County.<br />
Southern California Sugar Co., Santa Ana, Orange County.<br />
Sacramento Valley Sugar Co., Hamilton, Glenn County.<br />
Pacific Sugar Co., Visalia, Tulare County.<br />
Pacific Sugar Co., Corcoran, Kings County.<br />
Anaheim Sugar Co., Anaheim, Orange County.<br />
Holly Sugar Co., Long Beach, Los Angeles County.<br />
The plant at Watsonville and the plants <strong>of</strong> the Pacific Sugar Company at<br />
Visalia and Corcoran were not operated during 1911 and 1912, but will be ready<br />
for 1913. Two new plants entered the lists, the Anaheim Company at Anaheim,<br />
Orange County, and the Holly Sugar Company at Long Beach, Los Angeles<br />
County. One new factory is in course <strong>of</strong> construction at Irvine, Orange County for<br />
the coming campaign. Others at San Diego and at Woodland are mentioned as<br />
being projected. The prices paid to growers <strong>of</strong> sugar beets the past two seasons<br />
were the highest in the history <strong>of</strong> the industry.<br />
The Alameda Company’s plant has been moved from Alvarado and will operate<br />
the coming season near Meridian in Sutter County.<br />
The plant at Spreckels in Monterey County is the largest beet-sugar factory<br />
in the world.<br />
The average yield <strong>of</strong> sugar beets per acre and the average percentage <strong>of</strong> sugar<br />
in California beets is greater than in Colorado or Michigan. In some parts <strong>of</strong> Cali
Digitized for FRASER<br />
http://fraser.stlouisfed.org/<br />
<strong>Federal</strong> <strong>Reserve</strong> <strong>Bank</strong> <strong>of</strong> <strong>St</strong>. <strong>Louis</strong><br />
40 CALIFORNIA DEVELOPMENT BOARD<br />
fornia the soil and climatic conditions are superior for the cultivation <strong>of</strong> sugar beets.<br />
The large average percentage <strong>of</strong> sunlight is probably the main factor in the results<br />
obtained.<br />
The growth <strong>of</strong> the industry in California is shown in the following exhibit for<br />
twenty-five years, beginning with 1888, that being the first year statistics were obtained<br />
and published by the <strong>St</strong>ate Board <strong>of</strong> Trade:<br />
B E E T SU G A R P R O D U C T IO N O F C A L IF O R N IA — T O N S O F 2,000 LBS.<br />
Y ear.<br />
1888 ...........................................<br />
1889 ...........................................<br />
Tons.<br />
1,910<br />
. 2,457<br />
Y ear.<br />
1900<br />
1901<br />
Tons.<br />
.............................. 30,319<br />
............................... 68,700<br />
1890 ........................................... . 3,351 1902 .......... ............................... 73,761<br />
1891 ........................................... . 5,224 1903 .......... ............................... 65,360<br />
1892 .......................................... . 10,761 1904 .......... ............................... 59,147<br />
1893 ........................................... . 17,420 1905 .......... ............................... 64,251<br />
1894 ........................................... .18,615 1906 .......... .............................. 94,285<br />
1895 ........................................... .23,827 1907 .......... .............................. 72,889<br />
1896 ........................................... .31,815 1908 .......... .............................. 99,613<br />
1897 ........................................... .35,280 1909 .......... .............................. 126,621<br />
1898 ........................................... .18,086 1910 .......... .............................. 144,747<br />
1899 ........................................... 42,100 1911<br />
1912<br />
Taken altogether, the industry<br />
the large m oney producers <strong>of</strong><br />
.............................. 162,538<br />
.............................. 155,432<br />
is on a most satisfactory basis and bids fair to becom e<br />
the <strong>St</strong>ate.<br />
MINERAL INDUSTRY<br />
The value <strong>of</strong> California’s mineral product for late years shows a steady increase<br />
mainly due to petroleum. The five years ending December 31, 1912, shows values<br />
as follows:<br />
1908 $66,363,150<br />
1909 82,972,209<br />
1910 88,419,079<br />
1911 87,497,879<br />
1912 ................................................................................. 91,500,000 (est.)<br />
The value for 1912 will reach a total <strong>of</strong> well over $91,500,000, being an increase<br />
<strong>of</strong> $4,000,000 over the production <strong>of</strong> 1911. Great activity has been evident in the<br />
mineral industry and an increased production will undoubtedly be shown in every<br />
branch, with the possible exception <strong>of</strong> copper, (owing to the fact that the “fume<br />
trouble” has not been satisfactorily solved as yet), but the value <strong>of</strong> the copper produced<br />
will show a large increase due to the advance in the price received during the<br />
year, the average being close to 16 cents per pound as against 1 2^ cents per pound<br />
received in 1911.<br />
A conservative estimate <strong>of</strong> the leading mineral products for 1912 is as follows:<br />
(From the <strong>St</strong>ate Mining Bureau).<br />
Petroleum, 87,000,000 bbl., valued at .......................................... $41,000,000<br />
Gold .................................................................................................... 20,000,000<br />
Cement ................................................................................................ 10,500,000<br />
Copper ............................................................ .................................... 5,000,000<br />
Crushed rock, used for all p u rp o ses.......................................... 4,000,000<br />
Brick, <strong>of</strong> all kinds........................................................................ .... 2,500,000<br />
Borax ................................................................................................... 1,500,000<br />
Natural Gas ....................................................................................... 1,500,000<br />
Quicksilver ......................................................................................... 750,000<br />
Silver .................................................................................................... 750.000<br />
Lime and Lim estone ...................................................................... 750,000<br />
Mineral W ater, Salt and Clay-pott r y ...................................... 1,250,000<br />
Miscellaneous minerals .................................................................. 2,000,000<br />
T o ta l................ ' ......................................................................... $91,500,000<br />
The remaining 26 minerals, listed as many <strong>of</strong> them are known to have had a<br />
1911 had a total value <strong>of</strong> $1,800,000, and miscellaneous, which were produced in<br />
greatly increased output during the year just passed, probably far exceeding the<br />
estimated $2,000,000,
Digitized for FRASER<br />
http://fraser.stlouisfed.org/<br />
<strong>Federal</strong> <strong>Reserve</strong> <strong>Bank</strong> <strong>of</strong> <strong>St</strong>. <strong>Louis</strong><br />
PETROLEUM PRODUCTION 41<br />
Some minerals which have had little or no production in the past, and which<br />
have been receiving considerable attention from capital recently, are: Bauxite, for<br />
the manufacture <strong>of</strong> aluminum; various iron deposits throughout the <strong>St</strong>ate; Barytes;<br />
Feldspar; Natural Asphalt; Potash and Nitre deposits; Tellurium, Vanadium and<br />
Magnesite.<br />
While practically all the asphalt used in the <strong>St</strong>ate is a refined product, it is<br />
<strong>of</strong>ten listed with the total mineral output, in which case the total figure would approximate<br />
$95,000,000.<br />
PETROLEUM<br />
PETROLEUM PRODUCTION<br />
The production <strong>of</strong> all the California Oil Fields for the years 1911 and 1912 was as<br />
follows:<br />
(California Derrick)<br />
Field<br />
County<br />
Wells<br />
1911<br />
Production<br />
1912<br />
Production<br />
M idw ay.............<br />
Coalinga............<br />
Kern River<br />
Santa Maria. . .<br />
Fullerton...........<br />
Sunset................<br />
McKittrick........<br />
Salt Lake..........<br />
W hittier............<br />
Lompoc..............<br />
Santa Paula... .<br />
Los Angeles.. . .<br />
Lost Hills..........<br />
Newhall.............<br />
Summerland.. . .<br />
Watsonville. . . .<br />
Puente...............<br />
Arroyo Grande.<br />
Kern....................<br />
Fresno..................<br />
Kern......................<br />
Santa Barbara.. ,<br />
Orange..................<br />
Kern......................<br />
Kern.....................<br />
Los Angeles........<br />
Los Angeles........<br />
Santa Barbara.. .<br />
Ventura................<br />
Los Angeles........<br />
Kern......................<br />
Los Angeles........<br />
Santa Barbara.. .<br />
Santa Cruz..........<br />
Los Angeles.........<br />
San Luis Obispo.<br />
447<br />
736<br />
1605<br />
154<br />
250<br />
196<br />
178<br />
245<br />
141<br />
20<br />
264<br />
415<br />
4<br />
76<br />
131<br />
4-5<br />
56<br />
4<br />
21,584,566<br />
18,324,701<br />
14,978,390<br />
6,670,074<br />
5,978,823<br />
5,559,069<br />
5,447,532<br />
2,794,233<br />
1,069,437<br />
795,000<br />
515,675<br />
429,528<br />
154,960<br />
146,110<br />
71,255<br />
40,850<br />
32,895<br />
20,500<br />
25,948,945<br />
19,446,122<br />
12,446,445<br />
5,788,086<br />
6,764,360<br />
5,590,824<br />
6,462,350<br />
2,662,776<br />
1,125,769<br />
1,013,880<br />
740,173<br />
410,661<br />
1,313,076<br />
119,712<br />
65,715<br />
43,920<br />
29,650<br />
1,950<br />
Total wells all districts in California and operations<br />
191 1<br />
191 2<br />
4,942<br />
5,625<br />
83,744,044<br />
90,074,439<br />
These figures are from private sources and are somewhat greater than those <strong>of</strong> the Geological<br />
Survey lately published.<br />
The U. S. Geological Survey for 1911 (the latest) places the world’s consumption<br />
at one million barrels per day. Of thi total 81,134,391 barrels (estimated) are<br />
credited to California. Special advices from local authorities give the California<br />
production for 1912 at 90,074,439 barrels.<br />
The output <strong>of</strong> petroleum in California for the years 1900 to 1912 inclusive, from<br />
private sources, and the production <strong>of</strong> the United <strong>St</strong>ates from the U. S. Geological<br />
Survey, is as follows :<br />
California United <strong>St</strong>ates California United <strong>St</strong>ates<br />
Year (barrels) (barrels) Year (barrels) (barrels)<br />
1900 4,000,000 63,620,529 1906 32,516,600 126,493,936<br />
1901 8,000,000 69,389,194 1907 40,101,36*0 166,095,335<br />
1902 13,973,500 88,766,916 1908 48,300,758 178,527,355<br />
1903 24,337,828 100,461,337 1909 58,191,723 183,170,874<br />
1904 24,423,860 117,080,960 1910 77,697,568 209,556,048<br />
1905 34,275,701 134,717,580 1911 83,744,044 217,000,000<br />
1912 90,074,439<br />
Production <strong>of</strong> petroleum in the United <strong>St</strong>ates as above, shows a very material<br />
and constant increase during the last few years, due to the California production<br />
and is an important factor in industrial and commercial development.<br />
Though since 1900 the California production <strong>of</strong> oil has increased from 4,000,000<br />
to over 90,000,000 barrels, the consumption keeps up with the increase and the<br />
storage was less in 1912 than in the two previous years. For December, 1912, the<br />
consumption was reported as 6 per cent more than the production during that<br />
month.
Digitized for FRASER<br />
http://fraser.stlouisfed.org/<br />
<strong>Federal</strong> <strong>Reserve</strong> <strong>Bank</strong> <strong>of</strong> <strong>St</strong>. <strong>Louis</strong><br />
42 CALIFORNIA DEVELOPMENT BOARD<br />
Production.<br />
191 0 77,697,568<br />
191 1 83,744,044<br />
191 2 90,074,489<br />
Per cent<br />
Consumption.<br />
85.16<br />
87.09<br />
92.60<br />
Per cent<br />
<strong>St</strong>orage.<br />
14.84<br />
12.91<br />
7.40<br />
Consumption for 1912 was greater than for 1910 by 17,237,257 barrels and for<br />
1911 by 10,449,259 barrels.<br />
The total oil in storage December 31, 1912, was 46,698,054 barrels. The production<br />
above consumption for 1912 was 6,664,809 barrels. Visible supply December<br />
31, 1912, was 186 days. The diminished production <strong>of</strong> other fields presages a<br />
prosperous era for the California fields for some time to come.<br />
R A N K OF STATES.<br />
Total production <strong>of</strong> petroleum by <strong>St</strong>ates, in 1911, as compared with 1910 in<br />
barrels. (U. S. Geological Survey).<br />
<strong>St</strong>ate.<br />
Production.<br />
1910.<br />
Production.<br />
1911.<br />
California ............................................................ 73,010,560 81,134,391<br />
Colorado ................................... 239,794 226,926<br />
Illinois ...................................... .......................... 33,143,362 31,317,038<br />
Indiana ...................................... .......................... 2,159,725 1,695,289<br />
Kansas ..................................... .......................... 1,128,668 1,278,819<br />
Kentucky ................................... .......................... 468,774 472,458<br />
<strong>Louis</strong>iana ................................... .......................... 6,841,395 10,720,420<br />
Michigan )<br />
Missouri S<br />
.......................... 3,615 7,995<br />
New Y ork ................................. .......................... 1,053,838 952,515<br />
Ohio ............................................ ............................ 9,916,370 8,817,112<br />
Oklahoma ................................ .......................... 52,028,718 56,069,637<br />
Pennsylvania .......................... .......................... 8,794,662 8,248,158<br />
Texas ......................................... .......................... 8.899,266 9,526,474<br />
Utah )<br />
W yom in g \<br />
.......................... 115,430 186,695<br />
W est Virginia ........................ .......................... 11,753,071 9,795,464<br />
T o ta l.................................. .......................... 209,557,248 220,449,391<br />
Quantity ”1<br />
California not only led in quantity <strong>of</strong> product but produced almost half as much<br />
again as Oklahoma, the <strong>St</strong>ate second in rank. The Mid-Continent field omitted,<br />
California produced as much oil as the rest <strong>of</strong> the United <strong>St</strong>ates put together; the<br />
United <strong>St</strong>ates being omitted, California produced more oil than any entire nation,<br />
and if Russia and the United <strong>St</strong>ates are omitted, California far surpassed the combined<br />
production <strong>of</strong> all the rest <strong>of</strong> the world, including Mexico, India, Roumania,<br />
Galicia, Japan and South America.<br />
W O RLD ’S PRODUCTION<br />
Country 1909 1910 Barrels<br />
Per Cent<br />
<strong>of</strong> Total<br />
Production<br />
United <strong>St</strong>ates............................................ 183,170,874 209,557,248 220,449,391 63.80<br />
Russia......................................................... 65,970,350 70,336,574 66,183,691 19.16<br />
2,488,742 3,332,807 14,051,643 4.07<br />
11,041,852 11,030,620 12,172,949 3.52<br />
Roumania................................................... 9,327,278 9,723,806 11,101,878 3.21<br />
14,932,799 12,673,688 10,485,726 3.04<br />
India............................................................ 6,676,517<br />
1,889,563<br />
6,137,990<br />
1,930,661 1,658,903<br />
1.87<br />
.48<br />
6,451,203<br />
Peru............................................................. 1,316,118 1,330,105 1,398,036 .40<br />
1,018,837 1,032,522 995,764 .29<br />
420,755 315,895 291,096 .08<br />
Italy............................................................ 42,388 42,388 a 71,905 .02<br />
a30,000 a30,000 o200,000 .06<br />
Total................................................... 298,326,073 327,474,304 345,512,185 100.00
Digitized for FRASER<br />
http://fraser.stlouisfed.org/<br />
<strong>Federal</strong> <strong>Reserve</strong> <strong>Bank</strong> <strong>of</strong> <strong>St</strong>. <strong>Louis</strong><br />
PIPE LINES 43<br />
The United <strong>St</strong>ates in 1911 produced nearly 64 per cent <strong>of</strong> the world’s output<br />
<strong>of</strong> petroleum and <strong>of</strong> this California contributed about 30 per cent.<br />
As illustrating the growing demand for fuel oil <strong>of</strong> which as shown above California<br />
furnishes the best part <strong>of</strong> the supply, we append the following from the U. S.<br />
Geological Survey, 1911:<br />
“Thus far ill locomotive use oil has simply replaced coal under boilers, but<br />
within the last year a locomotive has been constructed in Switzerland on the Diesel<br />
principle and is being subjected to thorough practical tests.”<br />
CONSUMPTION OF FUEL OIL BY THE RAILROADS OF THE U. S., 1906-11<br />
Year<br />
Length <strong>of</strong> Line<br />
operated by<br />
the use <strong>of</strong><br />
Fuel Oil,<br />
Miles<br />
Quantity <strong>of</strong><br />
Fuel Oil consumed<br />
by Railroads,<br />
Barrels<br />
Total Mileage<br />
made by Oil-<br />
burning engines<br />
Miles<br />
Average No.<br />
<strong>of</strong> Miles per<br />
Barrel <strong>of</strong> Oil<br />
consumed<br />
Miles<br />
1906 . . : ............ 15,577,677<br />
1907............................................................. 13,573 18,849,803 74,079,726 3.93<br />
1908............................................................. 15,474 16,870,882 64,279,509 3.81<br />
1909............................................................. 17,676 19,905,335 72,918,118 3.66<br />
1910............................................................. 22,709 23,817,346 89,107,883 2.74<br />
1911............................................................. 27,368 27,774,821 104,270,964 3.75<br />
Some <strong>of</strong> these lines also used coal.<br />
According to Bradstreet the oil companies <strong>of</strong> California have returned to the<br />
stockholders over $60,000,000 in dividends in twenty years ended 1910.<br />
P I P E L IN E S<br />
To take care <strong>of</strong> California’s great petroleum production a vast system <strong>of</strong> pipe<br />
lines has been constructed, a brief description <strong>of</strong> which may be <strong>of</strong> interest.<br />
Four lines in operation are in the Coalinga field. The <strong>St</strong>andard Oil Company<br />
has two lines, one <strong>of</strong> 8-inch and one <strong>of</strong> 6-inch pipe, 133 miles in length, with terminals<br />
at Point Richmond on the Bay <strong>of</strong> San Francisco. The Associated Transportation<br />
Company has one 6-inch line in operation, 110 miles in length, with terminal<br />
at Monterey; also a line at Salinas, and another line <strong>of</strong> 8-inch rifled pipe in<br />
course <strong>of</strong> construction, which will be 198 miles long when completed, from Coalinga<br />
to the terminal at Port Costa. The Producers’ Transportation Company has<br />
just completed (March, 1910) and put in operation an 8-inch pipe line from Coalinga<br />
to Port Ftarford, 100 miles in length, which makes a junction in the<br />
Devil’s Den District with a line coming north from McKittrick, Midway and<br />
Bakersfield. It is said that the pipe line from the junction to Port Harford will<br />
soon be doubled. Shipments <strong>of</strong> crude oil are also made from this field by railroad.<br />
The Associated Pipe Line Company has an 8-inch rifled line extending from<br />
the Kern River field to Port Costa, and the <strong>St</strong>andard Oil Company has lines running<br />
from this field to Point Richmond, a line from the Midway field connecting<br />
with them. The field is also tapped by the Southern Pacific Railroad. The crude<br />
petroleum produced in the McKittrick and Sunset fields in 1909 was shipped by<br />
rail.<br />
Three pipe lines transport petroleum from the Santa Maria oil field. The Union<br />
Oil Company has two lines, one <strong>of</strong> 6-inch and one <strong>of</strong> 8-inch pipe, from Orcutt and<br />
Lompoc to Port Harford. The <strong>St</strong>andard Oil Company has an 8-inch line to Port<br />
Harford and the Associated Transportation Company has an 8-inch line to Gaviota.<br />
Shipments are also made from this field by rail from Careaga, Orcutt and<br />
Palmers.