novel approaches to expression and detection of oestrus in dairy cows
novel approaches to expression and detection of oestrus in dairy cows novel approaches to expression and detection of oestrus in dairy cows
Activity Activity Activity Activity Cow 615 140 120 100 80 60 40 20 0 29/09 04/10 09/10 14/10 19/10 24/10 Date and Time Cow 279 140 120 100 80 60 40 20 0 29/09 04/10 09/10 14/10 19/10 24/10 Date and Time Cow 274 140 120 100 80 60 40 20 0 29/09 04/10 09/10 14/10 19/10 24/10 Date and Time Cow 288 140 120 100 80 60 40 20 0 29/09 04/10 09/10 14/10 19/10 24/10 Date and Time Figure 5.9 (Cont.) Activity graphs from POC 1 showing activity plotted against date and time; cows 615, 274, 279 and 288 did not come into oestrus and have no peak in activity from baseline 132
Activity Activity Activity Activity Cow 539 140 120 100 80 60 40 20 0 07/01 12/01 17/01 22/01 27/01 01/02 Date and Time Cow 320 140 120 100 80 60 40 20 0 07/01 12/01 17/01 22/01 27/01 01/02 Date and Time Cow 323 140 120 100 80 60 40 20 0 07/01 12/01 17/01 22/01 27/01 01/02 Date and Time Cow 611 140 120 100 80 60 40 20 0 07/01 12/01 17/01 22/01 27/01 01/02 Date and Time Figure 5.10 Activity graphs from POC 2 showing activity plotted against date and time; cows 539, 323, 320 and 611 all came into oestrus during the trial and have a clear peak compared with baseline activity, several initial 133 peaks correspond with initial backpack training of the cows and smaller peaks towards the end of the trial are due to routine management - foot trimming.
- Page 97 and 98: CHAPTER 4 - Development of a Novel
- Page 99 and 100: In summary UWB seems a good option
- Page 101 and 102: Initial tests were carried out to i
- Page 103 and 104: Therefore this demonstrates that X
- Page 105 and 106: which is most important for achievi
- Page 107 and 108: Figure 4.9 Horizontal - Vertical Di
- Page 109 and 110: that UWB is matching the ‘truth
- Page 111 and 112: mounting cow. For example height ch
- Page 113 and 114: Backpack 1 st put on in AI stalls E
- Page 115 and 116: Cows’ behaviour was assessed at 5
- Page 117 and 118: or that the cows were in an area of
- Page 119 and 120: plane, but mostly in achieving high
- Page 121 and 122: Develop techniques for analysis of
- Page 123 and 124: in elastic silicone moulded over a
- Page 125 and 126: and time of mount, duration of moun
- Page 127 and 128: observed matched with increases in
- Page 129 and 130: 5.3 RESULTS Results demonstrate pos
- Page 131 and 132: Figure 5.2 Graph showing mounting b
- Page 133 and 134: Table 5.1 Results from POC 2 showin
- Page 135 and 136: Table 5.3 Efficiency and accuracy o
- Page 137 and 138: oestrus and oestrus it is clear to
- Page 139 and 140: P4 Concentration, ng/ml P4 Concentr
- Page 141 and 142: P4 Concentration, ng/ml P4 Concentr
- Page 143 and 144: P4 Concentration, ng/ml P4 Concentr
- Page 145 and 146: P4 Concentration, ng/ml P4 Concentr
- Page 147: Activity Activity Activity Activity
- Page 151 and 152: Activity Activity Activity Activity
- Page 153 and 154: 5.4 DISCUSSION The aim of this work
- Page 155 and 156: averaged 70% which was lower than t
- Page 157 and 158: when the cows lie down, especially
- Page 159 and 160: the level of oestrous activity was
- Page 161 and 162: technology larger herds must be mon
- Page 163 and 164: monitoring could also monitor non-l
- Page 165 and 166: antennae which could affect accurac
- Page 167 and 168: predispose cows to illness e.g. met
- Page 169 and 170: CHAPTER 6 - Overall Discussion & Co
- Page 171 and 172: oestrus, h 2 =0.27 (Lovendahl et al
- Page 173 and 174: The final section of this thesis de
- Page 175 and 176: ate. By using UWB in a commercial s
- Page 177 and 178: provides an insight the potential o
- Page 179 and 180: BLOWEY, R. (2005) Factors associate
- Page 181 and 182: ovine gonadotrophin releasing hormo
- Page 183 and 184: GINTHER, O. J., KOT, K., KULICK, L.
- Page 185 and 186: associated with embryonic survival
- Page 187 and 188: ody condition at parturition on end
- Page 189 and 190: Signs in a 24-h Tie-Stalled Dairy H
- Page 191 and 192: SHERMAN, E. L., NKRUMAH, J. D., MUR
- Page 193 and 194: Influence of negative energy balanc
Activity<br />
Activity<br />
Activity<br />
Activity<br />
Cow 615<br />
140<br />
120<br />
100<br />
80<br />
60<br />
40<br />
20<br />
0<br />
29/09 04/10 09/10 14/10 19/10 24/10<br />
Date <strong>and</strong> Time<br />
Cow 279<br />
140<br />
120<br />
100<br />
80<br />
60<br />
40<br />
20<br />
0<br />
29/09 04/10 09/10 14/10 19/10 24/10<br />
Date <strong>and</strong> Time<br />
Cow 274<br />
140<br />
120<br />
100<br />
80<br />
60<br />
40<br />
20<br />
0<br />
29/09 04/10 09/10 14/10 19/10 24/10<br />
Date <strong>and</strong> Time<br />
Cow 288<br />
140<br />
120<br />
100<br />
80<br />
60<br />
40<br />
20<br />
0<br />
29/09 04/10 09/10 14/10 19/10 24/10<br />
Date <strong>and</strong> Time<br />
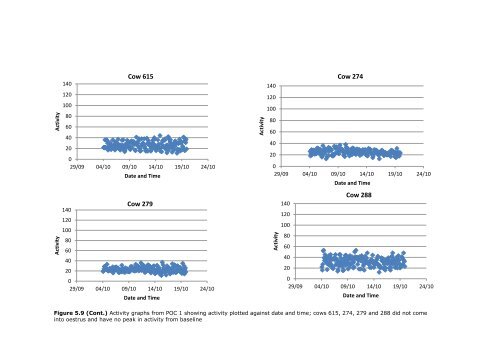
Figure 5.9 (Cont.) Activity graphs from POC 1 show<strong>in</strong>g activity plotted aga<strong>in</strong>st date <strong>and</strong> time; <strong>cows</strong> 615, 274, 279 <strong>and</strong> 288 did not come<br />
<strong>in</strong><strong>to</strong> <strong>oestrus</strong> <strong>and</strong> have no peak <strong>in</strong> activity from basel<strong>in</strong>e<br />
132


