Physical fitness of elite women's rugby union players over a ...
Physical fitness of elite women's rugby union players over a ... Physical fitness of elite women's rugby union players over a ...
Stature (cm) 200 180 160 140 120 100 80 60 40 20 0 Pre-season Mid-season Post-season Forwards Backs * significant at p < 0.01 Figure 2: Mean Stature (cm) by position over the three test sessions 58
the descriptive analysis indicated that forwards (164.9 ± 6.68 cm) in comparison were taller than backs (160.1 ± 6.39 cm). 4.2.2 Body Mass The body mass comparisons between positional groups as well as changes within each position are presented in Figure 3. These data indicate that for each testing session, forwards had a significantly higher body mass than backs (p
- Page 19 and 20: • 10 and 40 m speed • 1 RM benc
- Page 21 and 22: (Gabbett, 2007; Quarrie et al., 199
- Page 23 and 24: Physical performance characteristic
- Page 25 and 26: CHAPTER TWO REVIEW OF RELATED LITER
- Page 27 and 28: LEOPARDS No of Women’s Clubs: 7 N
- Page 29 and 30: 2.2.3 International Women’s Rugby
- Page 31 and 32: 2.3.1 Movement Patterns Time-motion
- Page 33 and 34: Analysis of work-to-rest periods in
- Page 35 and 36: 2.4.1 Body Mass There has been a ma
- Page 37 and 38: Table I: Body Mass (kg) of female r
- Page 39 and 40: Table II: Stature (cm) of female ru
- Page 41 and 42: Table III: Comparison of 10m and 40
- Page 43 and 44: etween age groups (Durandt et al.,
- Page 45 and 46: Durandt et al., (2006) indicate tha
- Page 47 and 48: Table IV: Comparison of Vertical Ju
- Page 49 and 50: to allow accurate comparison (Duthi
- Page 51 and 52: 1988; Ueno, Watai, & Ishii, 1988).
- Page 53 and 54: staff with regards to selection and
- Page 55 and 56: male rugby players may be associate
- Page 57 and 58: Union. The players were sub-divided
- Page 59 and 60: Body mass Skinfolds (biceps, tricep
- Page 61 and 62: held at 90 degrees to the surface o
- Page 63 and 64: knees extended (straight), and bare
- Page 65 and 66: controlled manner to the center of
- Page 67 and 68: withdraw from the test if they are
- Page 69: CHAPTER FOUR RESULTS 4.1 INTRODUCTI
- Page 73 and 74: Sum of skinfolds (mm) 200 180 160 1
- Page 75 and 76: Percentage Body Fat (%) 40 35 30 25
- Page 77 and 78: Within forwards, there was a small
- Page 79 and 80: 10m speed (sec) 2.4 2.2 2.0 1.8 1.6
- Page 81 and 82: 40m speed (sec) 7 6 5 4 3 2 1 * * *
- Page 83 and 84: No difference was apparent within p
- Page 85 and 86: Pull ups 10 8 6 4 2 * * Forwards Ba
- Page 87 and 88: 50 40 * * * Forwards Backs Push-ups
- Page 89 and 90: CHAPTER 5 DISCUSSION, CONCLUSION AN
- Page 91 and 92: Cup (Schick et al., 2006). Attentio
- Page 93 and 94: skinfold thickness throughout the s
- Page 95 and 96: likelihood of injury during a train
- Page 97 and 98: can be possibly attributed to a gre
- Page 99 and 100: provide a good measure of the upper
- Page 101 and 102: mid-season, which performed 12 and
- Page 103 and 104: A reasonably high aerobic fitness l
- Page 105 and 106: these two broad positional groups h
- Page 107 and 108: physical fitness, it may also be ac
- Page 109 and 110: The current study has described the
- Page 111 and 112: Baker, D. and Nance, S. (1999). The
- Page 113 and 114: Crewther, B.T., Gill, N., Weatherby
- Page 115 and 116: Ellis, L., Gastin, P., Lawrence, S.
- Page 117 and 118: Hrysomallis, C. (2010). Upper body
- Page 119 and 120: Maud, P.J. (1983). Physiological an
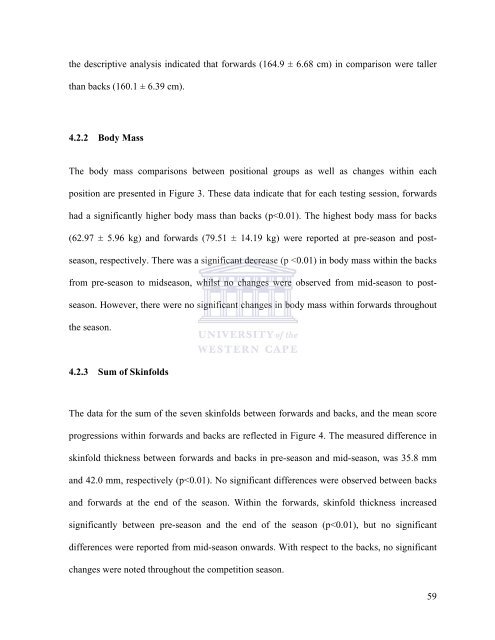
the descriptive analysis indicated that forwards (164.9 ± 6.68 cm) in comparison were taller<br />
than backs (160.1 ± 6.39 cm).<br />
4.2.2 Body Mass<br />
The body mass comparisons between positional groups as well as changes within each<br />
position are presented in Figure 3. These data indicate that for each testing session, forwards<br />
had a significantly higher body mass than backs (p


