DEPARTAMENTO DE CIÊNCIAS DA VIDA ... - Estudo Geral
DEPARTAMENTO DE CIÊNCIAS DA VIDA ... - Estudo Geral DEPARTAMENTO DE CIÊNCIAS DA VIDA ... - Estudo Geral
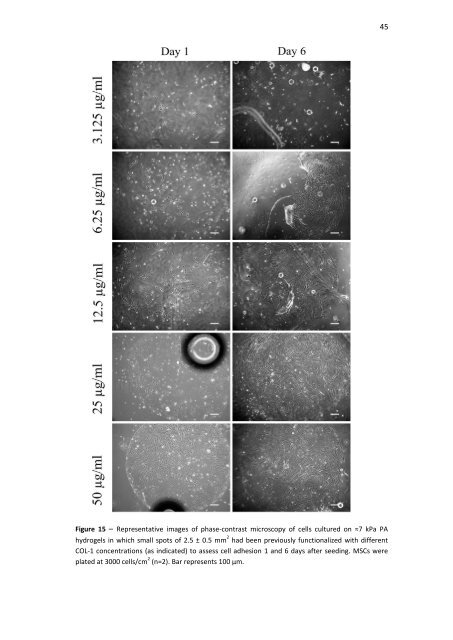
45 Figure 15 – Representative images of phase-contrast microscopy of cells cultured on ≈7 kPa PA hydrogels in which small spots of 2.5 ± 0.5 mm 2 had been previously functionalized with different COL-1 concentrations (as indicated) to assess cell adhesion 1 and 6 days after seeding. MSCs were plated at 3000 cells/cm 2 (n=2). Bar represents 100 µm.
12.5% Ac PBS Fold increase of hMSCs 46 III. 3 – hMSCs Proliferation Assay Mesenchymal stem cells (MSCs) are known to attach and proliferate on polyacrylamide hydrogels functionalized with COL-1 (Engler et al., 2004). Hence, we decided to screen hMSC proliferation on polyacrylamide hydrogels bearing distinct degrees of stiffness (Figure 16). For that, hMSCs were plated at a density of 3000 cells/cm 2 on hydrogels previously functionalized with 50 µg/ml COL-1 diluted in 1x PBS (PBS) or in acetic acid (AA). Cells were fixed after 1 or 5 days in culture, stained with DAPI and counted using a fluorescence microscope. We observed that proliferation was generally higher on the ≈10 kPa hydrogels, especially when COL-1 was diluted in PBS. Although there were no statistically significant differences, this condition showed slightly increased cell proliferation when compared to plastic (Figure 16). We also observed that in general, proliferation in the ≈7kPa and ≈12kPa hydrogels was normally lower than on plastic, being the lowest in the ≈7kPa hydrogels. In order to proliferate hMSCs in polyacrylamide hydrogels, the ≈10 kPa was selected for subsequent experiments. Day 1 Day 5 10 9 8 7 6 5 4 3 2 1 0 Proliferation Assay of hMSCs in Polyacrylamide Hydrogels from day 1 to day 5 ≈12kPa PBS ≈12kPa AA ≈10kPa PBS ≈10kPa AA ≈7kPa PBS ≈7kPa AA Plastic Figure 16 – Left and right upper images: Representative fluorescence microscopy images of hMSCs plated on polyacrylamide hydrogels with 12.5% acrylamide at day 1 (left) and 5 (right) after being fixed and stained with DAPI (in blue). Size bar corresponds to 200µm. Bottom graphic: Proliferation assay of hMSCs in polyacrylamide hydrogels, showing the fold increase of the number of cells from day 1 to day 5 (n=3).
- Page 15 and 16: xiv the change in distribution with
- Page 17 and 18: xvi Cells were stained with anti-B-
- Page 19 and 20: xviii List of abbreviations AA - Ac
- Page 22: 1 Chapter I Introduction
- Page 25 and 26: 4 There are many advantages in usin
- Page 27 and 28: 6 only ones MSCs can differentiate
- Page 29 and 30: Figure 1. Mechanotransduction in a
- Page 31 and 32: 10 1C)(Dogterom et al., 2005). Not
- Page 33 and 34: 12 extracellular ligand and the cyt
- Page 35 and 36: 14 Figure 3 - The Rigidity Sensing
- Page 37 and 38: 16 Figure 5 - Images depicted on A)
- Page 39 and 40: 18 Figure 7 - A) Immunofluorescence
- Page 41 and 42: 20 (GFAP) (is a class-III intermedi
- Page 43 and 44: 22 can specify lineage towards cell
- Page 45 and 46: 24 I.3 - Project rationale and expe
- Page 47 and 48: 26 Figure 12 - MSCs cultured on 1 a
- Page 49 and 50: 28 than that in soft substrate. Thi
- Page 52: 31 Chapter II - Materials and Metho
- Page 55 and 56: 34 Covance and DakoCytomation, resp
- Page 57 and 58: 36 clone SAM1; mouse Pe-Cy7 anti-hu
- Page 59 and 60: 38 To functionalize the complete su
- Page 62: 41 Chapter III Results
- Page 65: 44 2008) and also as previously est
- Page 69 and 70: ≈12 kPa / COL-1 +FN ≈12 kPa / C
- Page 71 and 72: 50 Figure 19 - Immunophenotype of U
- Page 73 and 74: 52 coated with COL-1 (similar to wh
- Page 75 and 76: 54 hydrogels of 1 and 7 kPa (for ce
- Page 77: Figure 23 - hMSCs cultured on TCP (
- Page 81 and 82: 60 Discussion MSCs are widely used
- Page 83 and 84: 62 isolating MSCs on the PA hydroge
- Page 85 and 86: 64 2011) and expanded on TCPs for 5
- Page 88: 67 Conclusion In conclusion, we opt
- Page 91 and 92: 70 Cretu, A., Castagnino, P. & Asso
- Page 93 and 94: 72 McBeath, R. et al., 2004. Cell s
- Page 95: 74 Wang, N., Butler, J.P., and Ingb
45<br />
Figure 15 – Representative images of phase-contrast microscopy of cells cultured on ≈7 kPa PA<br />
hydrogels in which small spots of 2.5 ± 0.5 mm 2 had been previously functionalized with different<br />
COL-1 concentrations (as indicated) to assess cell adhesion 1 and 6 days after seeding. MSCs were<br />
plated at 3000 cells/cm 2 (n=2). Bar represents 100 µm.


