- Page 1 and 2:
Sustainable Biomass Supply Chain fo
- Page 3 and 4:
Foreword This report provides an as
- Page 5 and 6:
include business development (new p
- Page 7 and 8:
Acknowledgments The authors would l
- Page 9 and 10:
4.1 Product Options and Supply Chai
- Page 11 and 12:
Table 4.2 Assessment of current val
- Page 13 and 14:
Figure 3.4 Tracked rigid self-prope
- Page 15 and 16:
Executive Summary What the report i
- Page 17 and 18:
• Biomass production potential of
- Page 19 and 20:
• As the Industry expands, the mo
- Page 21 and 22:
Harvesting, transport and storage s
- Page 23 and 24:
Biomass processing, supply chain pl
- Page 25 and 26:
Key barriers to biomass industries
- Page 27 and 28:
Crop-Biomass Production Production
- Page 29 and 30:
Figure 1.1 The cropping and pasture
- Page 31 and 32:
Table 1.1 Mallee species used for p
- Page 33 and 34:
1.1.4 Growth Cycle Mallee System Ma
- Page 35 and 36:
northern New South Wales (where it
- Page 37 and 38:
Almost 80% of the industry now cuts
- Page 39 and 40:
Bark has relatively high ash but as
- Page 41 and 42:
Carbon sinks Planting of mallees to
- Page 43 and 44:
Table 1.5(a) State Land area devote
- Page 45 and 46: out the fluctuations in farm income
- Page 47 and 48: Mallee system Most of the mallee bi
- Page 49 and 50: inconclusive result may have been d
- Page 51 and 52: For a sustainable woody crop indust
- Page 53 and 54: changed significantly since they we
- Page 55 and 56: Figure 2.2 Biosystems Engineering p
- Page 57 and 58: Whole-of-crop harvesting represents
- Page 59 and 60: During the last decade the harvesti
- Page 61 and 62: single row, as this would improve t
- Page 63 and 64: 2.2.2.2 Weight Sugar System The Aus
- Page 65 and 66: Table 2.1 Harvester Comparison Tabl
- Page 67 and 68: The quality of cut may be less impo
- Page 69 and 70: ate than a 170 tonne/ha crop of sta
- Page 71 and 72: Dry Leaf 6.1 - 3.5 17.0 58.9 53.2 T
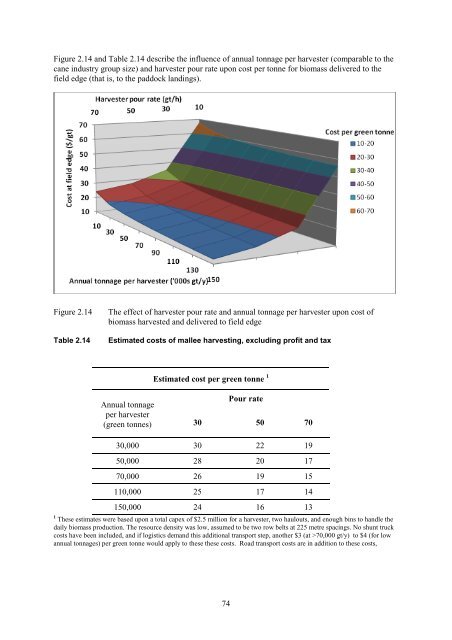
- Page 73 and 74: Bulk density will be a key consider
- Page 75 and 76: Table 2.4 EM levels in cane supply
- Page 77 and 78: L/T L/T 60 0.97 0.71 80 0.92 0.66 1
- Page 79 and 80: Total 7.5-26 16.5 Mallee System The
- Page 81 and 82: • waiting for mill delivery of em
- Page 83 and 84: perhaps at 10 - 20 km intervals. Th
- Page 85 and 86: transport arrangements, harvest gro
- Page 87 and 88: contractors and growers, and the fa
- Page 89 and 90: experience of the sugar industry wi
- Page 91 and 92: Table 2.11 Alternative harvest paym
- Page 93 and 94: onto the harvester. BR+F still send
- Page 95: Repairs and maintenance 2.10 Capita
- Page 99 and 100: Sichter et al. (2005)), harvest and
- Page 101 and 102: Transport efficiencies may be possi
- Page 103 and 104: 3. Transport and Storage Systems Tr
- Page 105 and 106: same time, the potential problems o
- Page 107 and 108: Figure 3.3 Articulated self-propell
- Page 109 and 110: • The harvester will not have any
- Page 111 and 112: Figure 3.7 Gross mass compared with
- Page 113 and 114: external factors dramatically impac
- Page 115 and 116: Figure 3.11 The effect of haulout t
- Page 117 and 118: 3.3 Road Transport 3.3.1 Configurat
- Page 119 and 120: Figure 3.15 shows an example of the
- Page 121 and 122: Road distance one way < 20 km 70 km
- Page 123 and 124: Haul distance is largely outside th
- Page 125 and 126: 3.6 Recommendations The nature of t
- Page 127 and 128: • The strategy offered lower tota
- Page 129 and 130: sugarcane billets are such that wit
- Page 131 and 132: • Transfer the whole tree product
- Page 133 and 134: Figure 4.5(b) Energy balance of con
- Page 135 and 136: 2010). Table 4.2 presents a summary
- Page 137 and 138: 4.4.2 Activated charcoal Activated
- Page 139 and 140: Nett Product Value ($/t) $475.00 $
- Page 141 and 142: Table 4.9 presents an estimation of
- Page 143 and 144: • Oil from leaf @ $2/kg • Synth
- Page 145 and 146: • The mallee oil would be extract
- Page 147 and 148:
5. Industry and Business Structures
- Page 149 and 150:
is conducted into tariff levels on
- Page 151 and 152:
Bx is % brix in first expressed jui
- Page 153 and 154:
Hildebrand (2002) estimated that th
- Page 155 and 156:
also has a flow on effect to the sp
- Page 157 and 158:
Sugar Industry Illustrative Example
- Page 159 and 160:
with super size multi-lift bins ove
- Page 161 and 162:
farmer vs. harvester) is the next l
- Page 163 and 164:
6. Supply Chain Planning and Manage
- Page 165 and 166:
Figure 6.1 Building blocks of the s
- Page 167 and 168:
weighed against the costs of operat
- Page 169 and 170:
• There is close contact between
- Page 171 and 172:
6.4 Planning, Management Tools and
- Page 173 and 174:
• Harvest and transport logistics
- Page 175 and 176:
interface. The system allows users
- Page 177 and 178:
Case Study 6.2 - Model Application
- Page 179 and 180:
Relationships between sectors and p
- Page 181 and 182:
7. Supply Chain Modelling and Econo
- Page 183 and 184:
It was assumed that there was a fif
- Page 185 and 186:
Table 7.2 Scenario two capital equi
- Page 187 and 188:
Table 7.4 Fuel burn rates harvester
- Page 189 and 190:
Figure 7.5 Effect of capital equipm
- Page 191 and 192:
Figure 7.7 Effect of annual tonnes
- Page 193 and 194:
30 1.8 7.0 12.3 17.5 50 1.1 4.3 7.6
- Page 195 and 196:
8. Conclusions and Recommendations
- Page 197 and 198:
Biomass bulk density has a large im
- Page 199 and 200:
Vehicles used for infield haulout w
- Page 201 and 202:
This can be compared with harvest a
- Page 203 and 204:
While diversification can add value
- Page 205 and 206:
Appendix 1: Comparative Assessment
- Page 207 and 208:
and transport conditions. Billet le
- Page 209 and 210:
that cane production is the most pr
- Page 211 and 212:
on sugar only, other proceeds (mola
- Page 213 and 214:
References Agnew, J 2002. A Partici
- Page 215 and 216:
Enecon 2001. Integrated Tree Proces
- Page 217 and 218:
Keating, BA, Antony, G, Brennan, LE
- Page 219 and 220:
Ridge, DR and Linedale, AL, 1997. T
- Page 221:
Willcox, T, Hussey, B, Chapple, D a