ABSTRACT - DRUM - University of Maryland
ABSTRACT - DRUM - University of Maryland
ABSTRACT - DRUM - University of Maryland
SHOW LESS

You also want an ePaper? Increase the reach of your titles
YUMPU automatically turns print PDFs into web optimized ePapers that Google loves.
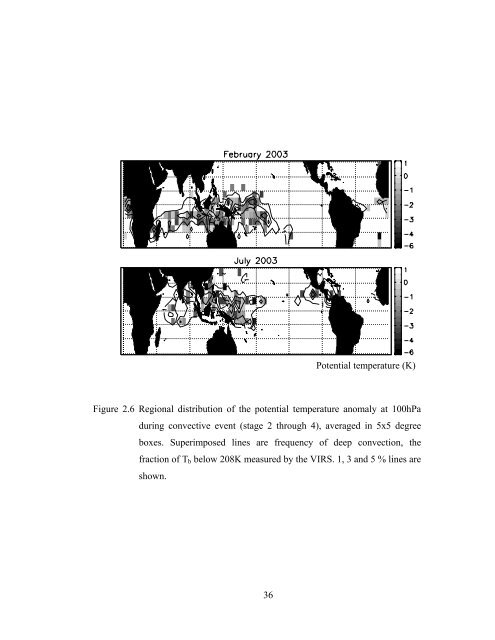
Potential temperature (K)<br />
Figure 2.6 Regional distribution <strong>of</strong> the potential temperature anomaly at 100hPa<br />
during convective event (stage 2 through 4), averaged in 5x5 degree<br />
boxes. Superimposed lines are frequency <strong>of</strong> deep convection, the<br />
fraction <strong>of</strong> T b below 208K measured by the VIRS. 1, 3 and 5 % lines are<br />
shown.<br />
36