Additional railway noise source terms for ... - ARCHIVE: Defra
Additional railway noise source terms for ... - ARCHIVE: Defra
Additional railway noise source terms for ... - ARCHIVE: Defra

Create successful ePaper yourself
Turn your PDF publications into a flip-book with our unique Google optimized e-Paper software.
www.defra.gov.uk<br />
<strong>Additional</strong> <strong>railway</strong> <strong>noise</strong> <strong>source</strong> <strong>terms</strong><br />
For “Calculation of Railway Noise 1995”<br />
A report produced <strong>for</strong> <strong>Defra</strong> by AEAT<br />
January 2007
Department <strong>for</strong> Environment, Food and Rural Affairs<br />
Nobel House<br />
17 Smith Square<br />
London SW1P 3JR<br />
Telephone 020 7238 6000<br />
Website: www.defra.gov.uk<br />
© Queen's Printer and Controller of HMSO 2007<br />
This publication is value added. If you wish to re-use this material, please<br />
apply <strong>for</strong> a Click-Use Licence <strong>for</strong> value added material at<br />
http://www.opsi.gov.uk/click-use/value-added-licence-in<strong>for</strong>mation/index.htm.<br />
Alternatively applications can be sent to Office of Public Sector In<strong>for</strong>mation,<br />
In<strong>for</strong>mation Policy Team, St Clements House, 2-16 Colegate, Norwich NR3<br />
1BQ; Fax: +44 (0)1603 723000; email: hmsolicensing@cabinetoffice.x.gsi.gov.uk<br />
In<strong>for</strong>mation about this publication and further copies are available from:<br />
LEQ<br />
<strong>Defra</strong><br />
Ashdown House<br />
123 Victoria Street, Zone 7/G10<br />
London, SW1E 6DE<br />
This document is also available on the <strong>Defra</strong> website.<br />
Published by the Department <strong>for</strong> Environment, Food and Rural Affairs
<strong>Additional</strong> <strong>railway</strong> <strong>noise</strong><br />
<strong>source</strong> <strong>terms</strong> <strong>for</strong> "Calculation<br />
of Railway Noise 1995"<br />
A report produced <strong>for</strong> <strong>Defra</strong><br />
AEJ Hardy<br />
RRK Jones<br />
CE Wright<br />
May 2004
Executive Summary<br />
When the procedure “Calculation of Railway Noise 1995” (CRN) [Ref 1] was devised, the list<br />
of stock that was included was aimed at representing the majority of typical vehicles<br />
operating on the <strong>railway</strong> at that time. However, since 1995 the nature of the rolling stock fleet<br />
has changed considerably and there are many types of vehicle currently in operation that are<br />
not included in CRN. There are also several types of stock pre-dating CRN that are not<br />
included.<br />
Within this report, data <strong>for</strong> CRN rolling <strong>noise</strong> <strong>terms</strong> <strong>for</strong> a range of vehicles agreed with <strong>Defra</strong><br />
have been calculated by application of AEA Technology’s experience in this field and by<br />
reference to its database of in<strong>for</strong>mation on the acoustic and physical characteristics of the<br />
stock. Data have also been obtained from field measurements <strong>for</strong> the Class 390 Pendolino<br />
Brittanico, the Class 220 Virgin Voyager, the Class 221 tilting Virgin Voyager and the<br />
Class 170 Turbostar. Rolling <strong>noise</strong> <strong>source</strong> term corrections, measured previously in the field<br />
by AEA Technology <strong>for</strong> the main UK rail freight operator EWS, are also provided <strong>for</strong> an<br />
agreed set of freight wagons and diesel locomotives, and the measured “on-power” <strong>source</strong><br />
term is also provided <strong>for</strong> these locomotives. These latter sets of data are provided with the<br />
permission of EWS.<br />
Eventually it would be advisable to base all such <strong>terms</strong> on measurement, especially if they are<br />
to be incorporated within a revised CRN document, but the calculated values presented in this<br />
report can be considered as being sufficiently accurate <strong>for</strong> initial <strong>noise</strong> mapping purposes.<br />
iii
Contents<br />
1 Introduction 1<br />
2 Calculation Methodology 2<br />
3 Results of calculations and separate measurements <strong>for</strong> EWS 4<br />
4 Discussion of predictions 6<br />
5 Introduction to measurements of Source Term Corrections <strong>for</strong> Classes 390, 220, 221<br />
and 170 7<br />
6 Measurement methodology 8<br />
7 Analysis of measured data 9<br />
7.1 BACKGROUND 9<br />
7.2 SEPARATION OF CONTRIBUTIONS 10<br />
7.3 MEASURED DATA 11<br />
7.4 TRACK CORRECTION 13<br />
7.5 RESULTS 14<br />
8 Conclusions 16<br />
9 References 17<br />
iv
1 Introduction<br />
When the procedure “Calculation of Railway Noise 1995” (CRN) [Ref 1] was devised, the list<br />
of stock that was included was aimed at representing the majority of typical vehicles<br />
operating on the <strong>railway</strong> at that time. However, since 1995 the nature of the rolling stock fleet<br />
has changed considerably and there are many types of vehicle currently in operation that are<br />
not included in CRN. There are also several types of stock pre-dating CRN that are not<br />
included. The following is a list of this missing stock and an indication, in parenthesis, of the<br />
number of vehicles:<br />
[The entire registered UK passenger and freight fleet at 3 January 2004 comprised 50939<br />
vehicles, including 35230 freight wagons of which 6506 are international vehicles not<br />
necessarily always in the UK. There are also 4647 de-registered vehicles that may be reregistered<br />
in the future.]<br />
Diesel Multiple Units pre-privatisation<br />
Class 142 (192), 143 (50), 144 (56), 150 (278), 153 (86), 155 (14), 156 (230), 158 (368), 159<br />
(88)<br />
Diesel Multiple Units near or post-privatisation<br />
Class 168 Turbostar (46), 170 Turbostar (248), 175 Coradia (70), 180 Coradia (56), 220<br />
Voyager (136), 221 Voyager (216)<br />
Electric Multiple Units pre-privatisation<br />
Class 312 (196), 313 (192), 314 (48), 315 (244), 317 (328), 318 (63), 320 (66), 321 (468), 322<br />
(20), 325 (64), 365 (164), 411/412 (326), 421 (444), 423 (888), 442 (140), 455 (576), 456<br />
(48), 483 (14), 488/489 (78), 507/508 (222)<br />
Electric Multiple Units near or post-privatisation<br />
Class 323 (129), 332 Heathrow Express (56), 333 (64), 334 Juniper (120), 350 (24), 357<br />
Electrostar (296), 375 Electrostar (210), 377 Electrostar (404), 390 Pendolino Britannico<br />
(477), 444 Desiro (225 on order), 450 Desiro (560), 458 Juniper (120), 460 Gatwick Juniper<br />
(64)<br />
Diesel locomotives near or post-privatisation<br />
Class 57 (17), 66 (328), 67 (30)<br />
Electric locomotive near or post-privatisation<br />
Class 92 (46)<br />
There is also a very large fleet of freight wagons not included specifically within CRN, eg<br />
BAA (143), BBA (308), BDA (533), BZA (98), MEA (437), TDA (156), TEB (56), TIA (41),<br />
HTA (1144) and KQA/KTA “pocket” wagons (75).<br />
The numbers of vehicles shown are a good indication of the actual proportion of usage,<br />
especially <strong>for</strong> the passenger stock.<br />
1
CRN <strong>source</strong> term corrections cover rolling <strong>noise</strong> and, <strong>for</strong> diesel locomotives, “on-power”<br />
<strong>noise</strong>, ie the exhaust and engine <strong>noise</strong> resulting from the locomotive being on full power. The<br />
rolling <strong>noise</strong> term can be measured under conditions specified in CRN. Diesel locomotive<br />
on-power <strong>source</strong> <strong>terms</strong> can also be measured under carefully controlled conditions. However,<br />
it is not easy to find sites where the required train types pass and which fulfil the conditions<br />
needed to obtain good rolling <strong>noise</strong> data (eg a non-corrugated rail head and no intervening<br />
track, and no intervening or reflecting structures between the track and a measurement point<br />
15m – 25m from the track). It is, however, possible to use the known physical characteristics<br />
of a particular type of vehicle to calculate an approximate CRN rolling <strong>noise</strong> <strong>source</strong> term or to<br />
identify a vehicle with a known <strong>source</strong> term likely to be acoustically similar to the unknown<br />
vehicle.<br />
Within this report, data <strong>for</strong> CRN rolling <strong>noise</strong> <strong>terms</strong> <strong>for</strong> an agreed range of vehicles have been<br />
calculated by application of AEA Technology’s experience in this field and by reference to its<br />
database of in<strong>for</strong>mation on the acoustic and physical characteristics of the stock. Rolling<br />
<strong>noise</strong> <strong>source</strong> term corrections, measured in the field by AEA Technology <strong>for</strong> EWS, the main<br />
UK rail freight operator, are also provided <strong>for</strong> an agreed set of freight wagons and diesel<br />
locomotives. The measured “on-power” <strong>source</strong> term is also provided <strong>for</strong> these locomotives.<br />
These measured data are provided with the permission of EWS.<br />
<strong>Additional</strong>ly, the rolling <strong>noise</strong> <strong>source</strong> term corrections <strong>for</strong> the Class 390 Pendolino Brittanico,<br />
the Class 220 Virgin Voyager Diesel Multiple Unit, the Class 221 tilting Virgin Voyager and<br />
the Class 170 Turbostar diesel multiple unit have been acquired by measurement.<br />
2 Calculation Methodology<br />
The baseline Sound Exposure Level (SEL) <strong>for</strong> rolling <strong>noise</strong> at 25m from CRN is speed-based:<br />
SEL = 31.2 + 20 log 10 V(km/h) dB(A)<br />
The fundamental <strong>source</strong> term <strong>for</strong> single vehicles is then obtained by adding a “Correction” to<br />
the baseline SEL, as presented in Table A1.1 of the procedure.<br />
Although the corrected SELs from CRN have a range of values dependent on speed, rolling<br />
<strong>noise</strong> is a function of a limited number of parameters. The most significant of these are the<br />
number of wheels and whether the vehicle has cast-iron tread brakes or disc<br />
brakes/composition tread brakes, as cast-iron brakes lead to rough wheels and higher rolling<br />
<strong>noise</strong> emission.<br />
The effect of the number of wheels can be clearly seen in CRN Table A1.1 where locomotives<br />
have a rolling <strong>noise</strong> correction of either 14.8 dB or 16.6 dB. The difference between these<br />
two groups is that they have 4 or 6 axles respectively (10log 10 (6/4) = 1.8 dB).<br />
The difference between vehicles with and without cast-iron tread brakes is also clear from<br />
CRN Table A1.1. The Mk I and Mk II coaches have cast-iron tread brakes while the Mk III<br />
and Mk IV have disc brakes. It can be seen in CRN that the correction <strong>for</strong> the Mk I and Mk II<br />
2
vehicles is 8.8 dB higher than <strong>for</strong> the Mk III and Mk IV. This difference can be explained by<br />
the relative values of the combined wheel and rail surface roughness <strong>for</strong> the different braking<br />
systems.<br />
Although the number of wheels and the difference between cast-iron tread brakes and other<br />
brake types account <strong>for</strong> much of the variation between vehicles, there are other factors to<br />
consider. For example, the Mk III has a correction of 6 dB but multiple units have a higher<br />
figure. One probable explanation is that some of the wheels on multiple units are powered,<br />
resulting in rougher wheels.<br />
The methodology adopted in calculating rolling <strong>noise</strong> corrections has been to apply AEA<br />
Technology’s experience, and in<strong>for</strong>mation from our database of measurements, to specify<br />
algorithms relating the correction to the total number of axles, the number of powered axles,<br />
and the type of braking and, in the case of the unloaded freight vehicle, its length. In this<br />
latter case, it has been found that measurements of some unloaded freight wagons in the UK<br />
indicate increased levels over the same wagons when loaded. This is contrary to the findings<br />
of the “Silent Freight” EC 4 th Framework project where a tank wagon and a “Tombereau”<br />
wagon were investigated, but is nevertheless a measurable effect on some UK stock.<br />
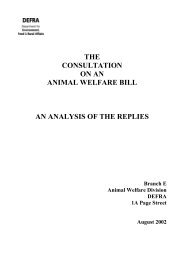
To validate this rolling <strong>noise</strong> prediction methodology, a comparison has been made between<br />
(a) a set of CRN corrections predicted by applying this methodology (ie “from first<br />
principles”) and (b) correction values either enshrined in the CRN 1995 document or obtained<br />
by measurement in the past by AEA Technology. The results of this can be seen in Figure 1.<br />
20<br />
+ 3dB -3 dB<br />
18<br />
Predicted Correction (dBA)<br />
16<br />
14<br />
12<br />
10<br />
8<br />
6<br />
4<br />
HAA<br />
Cl 319<br />
Cl 43<br />
2<br />
0<br />
0 2 4 6 8 10 12 14 16 18 20 22 24 26<br />
CRN or Measured Correction (dBA)<br />
Figure 1 CRN corrections predicted using the AEA Technology methodology vs values<br />
either in the CRN 1995 document or obtained from measurement<br />
The solid straight line represents y=x and there<strong>for</strong>e indicates the situation that would occur if<br />
the predictions using the methodology of this report agreed exactly with the CRN 1995<br />
3
figures or earlier AEA Technology measurements. Figure 1 shows a good correlation,<br />
providing confidence in the methodology applied within the current study, but highlights a<br />
few anomalies:<br />
Cl 319<br />
HAA<br />
Cl 43<br />
(InterCity<br />
125/HST<br />
Power Car)<br />
Recent measurements made at several locations indicate that the<br />
correction in the CRN 1995 document is high.<br />
Although the HAA wagon has disc brakes it also has cast iron tread<br />
brakes on two diagonally opposite wheels, which are intended to be<br />
used only when the vehicle is stationary. The correction from CRN<br />
<strong>for</strong> this wagon (8.0 dB) is high <strong>for</strong> a disc-braked two-axled vehicle,<br />
suggesting that the tread brakes may bear on the wheel when it is<br />
moving, increasing wheel roughness. Modelling the HAA wagon<br />
with 2 disc-braked and 2 cast-iron tread-braked wheels gives<br />
predicted <strong>source</strong> term corrections of 9.1 dB unloaded and 7.2 dB<br />
loaded, which can be seen to be significantly closer to the CRN value.<br />
The rolling <strong>noise</strong> <strong>source</strong> term in CRN <strong>for</strong> the Class 43 locomotive is<br />
higher than <strong>for</strong> any other diesel locomotive with 4 axles. It is known<br />
that the Class 43 produces high levels of high frequency engine <strong>noise</strong><br />
and it is considered possible that the rolling <strong>noise</strong> correction in Table<br />
A1.1 of CRN includes an element of engine <strong>noise</strong>.<br />
If the Class 319, Class 43 and the HAA data are excluded, the root mean squared difference<br />
between the predictions and the CRN/measured data is 1 dB.<br />
The methodology employed <strong>for</strong> deriving the CRN correction from the measured values of<br />
EWS freight wagon and locomotive pass-by <strong>noise</strong> is to capture the time-history of each event<br />
which can often consist of pass-by in<strong>for</strong>mation from a range of different vehicle types and,<br />
always, a locomotive. Those data are then used to synthesise an event comprising solely the<br />
vehicles in question, enabling the correction to be obtained (an AEA Technology procedure<br />
known as “T-Noise”). A similar approach was used in order to extract on-power corrections<br />
<strong>for</strong> locomotives, which were acquired during dedicated measurement exercises within an<br />
EWS depot.<br />
3 Results of calculations and separate measurements<br />
<strong>for</strong> EWS<br />
The results of the various approaches described in Section 2 are shown in Table 1.<br />
( * = freight vehicle data measured by AEA Technology, provided with the permission of<br />
EWS, + = On-Power correction, rather than rolling <strong>noise</strong> correction, where a negative value<br />
indicates a quieter locomotive than those shown in CRN, the majority of which have an On-<br />
Power correction of 0.0 dB). Note that the Class 444 Desiro EMU, which has just<br />
commenced testing, has been added to the list agreed previously with <strong>Defra</strong>.<br />
4
Vehicle type<br />
(EMU = electric<br />
multiple unit,<br />
DMU = diesel<br />
multiple unit)<br />
Arrangement per<br />
unit if DMU/EMU<br />
(M= motor vehicle,<br />
T= trailer vehicle)<br />
Code in brackets =<br />
variant<br />
Brake type <strong>for</strong><br />
prediction<br />
D=Disc<br />
T= Cast Iron<br />
Tread<br />
No of<br />
powered<br />
axles per<br />
motor<br />
vehicle <strong>for</strong><br />
prediction<br />
CRN<br />
vehicle<br />
<strong>source</strong><br />
term<br />
correction<br />
dB(A)<br />
168 Turbostar DMU MMMM D 2 +7.6<br />
170 Turbostar DMU M(M)M D 2 +7.6<br />
175 Coradia DMU M(M)M D 2 +7.6<br />
180 Coradia DMU MMMMM D 2 +7.6<br />
220 Voyager DMU MMMM D 2 +7.6<br />
221 Voyager DMU MM(M)MM D 2 +7.6<br />
323 EMU MTM D 4 +8.7 (M)<br />
+6.0 (T)<br />
332 Heathrow<br />
Express EMU<br />
MTTM D 2 +7.6 (M)<br />
+6.0 (T)<br />
333 EMU MT(T)M D 2 +7.6 (M)<br />
+6.0 (T)<br />
334 Juniper EMU MTM D 2 +7.6 (M)<br />
+6.0 (T)<br />
350 Desiro EMU MTTM D 4 +8.7 (M)<br />
+6.0 (T)<br />
357 Electrostar EMU MTMM D 2 +7.6 (M)<br />
+6.0 (T)<br />
375 Electrostar EMU MT(M)M D 2 +7.6 (M)<br />
+6.0 (T)<br />
377 Electrostar EMU MT(M)M D 2 +7.6 (M)<br />
+6.0 (T)<br />
390 Pendolino<br />
Britannico<br />
MMTM(T)MTMM D 2 +7.6 (M)<br />
+6.0 (T)<br />
444 Desiro EMU MTTTM D 4 +8.7 (M)<br />
+6.0 (T)<br />
450 Desiro EMU MT(T)TM D 4 +8.7 (M)<br />
+6.0 (T)<br />
458 Juniper EMU MTMM D 2 +7.6 (M)<br />
+6.0 (T)<br />
460 Gatwick Juniper<br />
EMU<br />
KQA loaded Pocket<br />
wagon<br />
KQA empty Pocket<br />
wagon<br />
Class 92 locomotive<br />
Dual voltage electric<br />
BAA wagon<br />
Steel carrier, 4 axle<br />
MTTMTMM D 2 +7.6 (M)<br />
+6.0 (T)<br />
T +15.0<br />
T +17.5<br />
T 6 +16.6<br />
+15.2*<br />
5
BBA wagon loaded<br />
Steel carrier, 4 axle<br />
BBA wagon empty<br />
Steel carrier, 4 axle<br />
BDA wagon empty<br />
Bolster 4 axle<br />
BZA wagon loaded<br />
Steel carrier, 4 axle<br />
MEA wagon empty<br />
Box mineral, 2 axle<br />
TDA wagon loaded<br />
Tank, 4 axle<br />
TEB wagon loaded<br />
Tank, 4 axle<br />
TIA wagon loaded<br />
Tank, 2 axle<br />
HTA wagon loaded<br />
Hopper, 4 axle<br />
HTA wagon empty<br />
Hopper, 4 axle<br />
Class 66 rolling<br />
Diesel locomotive<br />
Class 66 on-power<br />
Diesel locomotive<br />
Class 67 rolling<br />
Diesel locomotive<br />
Class 67 on-power<br />
Diesel locomotive<br />
+13.4*<br />
+16.1*<br />
+10.8*<br />
+11.8*<br />
+5.6*<br />
+17.8*<br />
+20.2*<br />
+17.8*<br />
+7.1*<br />
+10.4*<br />
+13.0*<br />
-13.4* +<br />
+7.4*<br />
-10.8* +<br />
Table 1 CRN <strong>source</strong> term corrections <strong>for</strong> stock not included within the current issue of the<br />
procedure.<br />
4 Discussion of predictions<br />
The in<strong>for</strong>mation provided in Table 1 will enable CRN predictions to be carried out <strong>for</strong> the<br />
stock shown with an acceptable level of confidence <strong>for</strong> indicative purposes, as shown by the<br />
validation data presented in Figure 1.<br />
In addition to the measurement of rolling <strong>noise</strong> <strong>source</strong> <strong>terms</strong> to verify the above calculations,<br />
a complete database of the current UK fleet will require measured in<strong>for</strong>mation on on-power<br />
levels and rolling <strong>noise</strong> from the Class 57 locomotive, and on-power in<strong>for</strong>mation <strong>for</strong> reengined<br />
Class 43 power cars. It would also be advisable to measure the fan <strong>noise</strong> from the<br />
Class 92 locomotive in order to establish whether this is as significant a <strong>source</strong> as is the case<br />
<strong>for</strong> the Eurostar, necessitating the inclusion of an additional term in the prediction procedure.<br />
6
In <strong>terms</strong> of likely impact on the mapping exercise, the Class 43 power cars on full power<br />
could be of the greatest significance. Although these are now at least 22 years old, they are<br />
still extensively used (197 units), and are unlikely to be withdrawn from service in the<br />
<strong>for</strong>eseeable future. It should be noted, however, that the measurement of full power <strong>terms</strong> <strong>for</strong><br />
use in CRN is not a straight<strong>for</strong>ward matter, as it will normally require a dedicated train set to<br />
be made available so that controlled acceleration, and preferably control over the mode of<br />
operation of the cooling system (a potentially major contributor), can be realised in an<br />
acoustically acceptable environment.<br />
The fan <strong>noise</strong> from the Class 92 electric locomotive (dual voltage freight) may also be of<br />
some significance <strong>for</strong> accurate <strong>noise</strong> mapping, as these operate from Scotland to the south of<br />
England on the West Coast Main Line, and on the Channel Tunnel route. However, as there<br />
are only 46 in service, and as the fan <strong>noise</strong> will be significantly lower in level than Class 43<br />
Full Power <strong>noise</strong>, they do not need to be considered as a priority issue.<br />
As there are only 17 Class 57 locomotives, their impact on the mapping will be of even less<br />
significance, and it is there<strong>for</strong>e only appropriate to measure their full power and rolling <strong>noise</strong><br />
levels if a complete database is required.<br />
5 Introduction to measurements of Source Term<br />
Corrections <strong>for</strong> Classes 390, 220, 221 and 170<br />
Following the calculations reported in Section 3, <strong>Defra</strong> requested that AEA Technology carry<br />
out a limited set of field measurements to validate the predictions and to enhance the currently<br />
available measurement database. The set of vehicles chosen was as shown in Table 2.<br />
Class Name Description<br />
390 Pendolino Brittanico (tilting)<br />
(477 vehicles in fleet)<br />
Virgin’s inter-city train <strong>for</strong> the West Coast Main<br />
Line, capable of 140 mph on appropriate track<br />
220 Voyager<br />
(136 vehicles in fleet)<br />
Virgin’s cross country diesel multiple unit, capable<br />
of 125 mph<br />
221 Voyager (tilting)<br />
Tilting version of the 220, capable of 125 mph<br />
(216 vehicles in fleet)<br />
170 Turbostar<br />
(248 vehicles in fleet)<br />
Widely-used 100 mph diesel multiple unit, with<br />
wheels designed <strong>for</strong> reduced rolling <strong>noise</strong> by ISVR<br />
(Southampton University), constructed 1998<br />
onwards<br />
Table 2 Stock chosen <strong>for</strong> the measurement exercise<br />
These vehicle classes were chosen <strong>for</strong> several reasons that made them of particular interest.<br />
The Class 390 is based on an Italian design, with distributed electrical power and a number of<br />
features that are different from typical UK stock, including tilt, and comprises around 3.5% of<br />
the passenger fleet. The Class 220 and 221 Voyagers are very powerful diesel multiple units<br />
(560 kW engines) and again comprise (with a new variant in production, the 222) around<br />
7
3.5% of the total passenger fleet. The 220 has “inside frame” bogies, while the 221 has the<br />
more conventional “outside frame” but with a tilting capability. The Class 170 diesel<br />
multiple unit (315 kW engines) has wheels that were designed to reduce rolling <strong>noise</strong> in order<br />
to meet the procurement specification and comprises around 2% of the passenger fleet.<br />
6 Measurement methodology<br />
Measurements were carried out in a large, grassed, rear garden of a cottage on the outskirts of<br />
the small village of Cranberry (with the prior agreement of the resident) at OS map reference<br />
SJ 825362 on 2 nd April 2004. The garden lies adjacent to, and on the east side of, the West<br />
Coast Main Line between Staf<strong>for</strong>d and Crewe, at mileage 144ml, 339yd. This is a 4-track<br />
section with the first and second (nearest two) tracks to the measurement site being the “Up<br />
Fast” and the “Down Fast” respectively. The third and fourth tracks were the “Up Slow” and<br />
“Down Slow” respectively, but were excluded from the analysis because vehicles of known<br />
characteristics did not pass over them during the measurement period, and they could<br />
there<strong>for</strong>e not be “calibrated”.<br />
The land is flat and open, lying approximately 0.5m below the level of the rails. The line is<br />
reasonably straight at this location, with both Fast tracks appearing to have been recently relaid<br />
with fresh ballast. The rails of both Fast tracks had evidently been recently re-ground,<br />
each still showing grinding marks either side of a smooth and narrow wear band.<br />
Using tripods and poles, microphones were mounted at the following positions:<br />
• Microphone 1 at 25m horizontal distance from the Up Fast (nearest track, carrying<br />
southbound trains) at 3.5m above the level of the rail head.<br />
• Microphone 2 at 25m from the Down Fast, also at 3.5m above rail head height.<br />
• Microphone 3 at 7.5m from the Up Fast, 1.5m above rail head height.<br />
Microphones 1 and 2 were used <strong>for</strong> measurement, while Microphone 3 provided better<br />
resolution of the time-history of the sound recording.<br />
The microphones (all Bruel & Kjaer Type 4165) were connected via Norsonic Type 112 preamplifiers<br />
and Type 336 signal conditioning frontends to a Sony Type PC208 digital audio<br />
tape (DAT) recorder. All microphone channels were calibrated by means of a pistonphone<br />
be<strong>for</strong>e and after the tests. Rail vehicles were identified on site but, in addition, a digital video<br />
camera was used to allow later confirmation of vehicle types, numbers and speeds. Wind<br />
speeds were monitored using a hand-held anemometer to ensure that no measurements were<br />
made where wind speeds exceeded the recommended limit of 5m/s in any direction and 2 m/s<br />
from rail to reception point. Sound and video recordings were made during the pass-by of<br />
every train. The recordings were analysed at a later date in the AEA Technology Rail<br />
Acoustics Laboratory in Derby.<br />
8
7 Analysis of measured data<br />
7.1 BACKGROUND<br />
It is rarely possible to measure CRN <strong>source</strong> term corrections directly from measurements<br />
because (a) the track is often not adequately smooth even when free from visible corrugations,<br />
(b) rolling <strong>noise</strong> from other vehicles in the train can influence the measured levels, (c) nonrolling<br />
<strong>noise</strong> <strong>source</strong>s may be present in the train 1 and (d) wheel faults can adversely affect<br />
levels.<br />
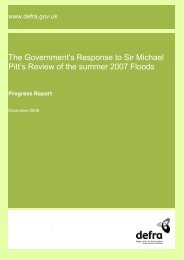
Figure 2 shows a typical time history of a train pass-by at the measurement site.<br />
100<br />
95<br />
60 millisecond L Aeq (dB)<br />
90<br />
85<br />
80<br />
75<br />
70<br />
Measured<br />
Predicted<br />
65<br />
60<br />
-200 -100 0 100 200 300 400<br />
Distance from the front of the train (m)<br />
Figure 2 Typical Measured and Predicted Time History of a Train Pass-by<br />
It should be noted that, to illustrate the effects more clearly, the data in Figure 2 are <strong>for</strong> a<br />
microphone 7.5 metres from the nearest rail. For calculating the <strong>source</strong> term corrections it is<br />
necessary under the requirements of CRN to use data measured at a distance of between<br />
15 metres and 25 metres from the nearest rail.<br />
The “High Speed Train” (HST) illustrated in Figure 2 has a Class 43 power car at each end<br />
and eight Mk III 2 coaches in between. The Mk III coach is disc braked and the Class 43 has<br />
cast-iron tread brakes, which is one reason <strong>for</strong> the peaks in level at either end of the time<br />
history. Furthermore, the Class 43 has a diesel engine, which also contributes to pass-by<br />
1 The presence of <strong>noise</strong> from traction equipment may contaminate the rolling <strong>noise</strong> signal. Because rolling <strong>noise</strong><br />
and traction <strong>noise</strong> vary differently with speed it is important that the <strong>source</strong> term corrections <strong>for</strong> these two<br />
phenomena are considered separately.<br />
2 In an HST the Mk III coaches are termed “trailer cars”.<br />
9
<strong>noise</strong>. The rear engine provides the electrical power <strong>for</strong> the coaches, which is why the<br />
measured peak <strong>for</strong> the rear power car is slightly higher than <strong>for</strong> the front.<br />
The small peak near the middle of the measured pass-by is common with this type of train and<br />
is associated with the buffet car.<br />
Figure 2 also shows the time history of the rolling <strong>noise</strong> predicted using the techniques<br />
developed by Peters [Ref 2] . It can be seen that although the agreement is good during the actual<br />
train pass-by the predicted levels rise and fall more rapidly than those that are measured. This<br />
is because the predicted levels are <strong>for</strong> rolling <strong>noise</strong> while the measured levels include<br />
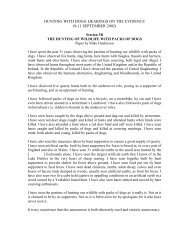
contributions from the <strong>noise</strong> from the diesel engines. Figure 3 compares the measured time<br />
history with a prediction that includes an engine <strong>noise</strong> component and it can be seen that the<br />
agreement is much improved.<br />
100<br />
95<br />
60 millisecond L Aeq (dB)<br />
90<br />
85<br />
80<br />
75<br />
70<br />
Measured<br />
Predicted<br />
65<br />
60<br />
-200 -100 0 100 200 300 400<br />
Distance from the front of the train (m)<br />
Figure 3 Typical Measured and Predicted Time History of a Train Pass-by with the<br />
Prediction including Engine Noise<br />
7.2 SEPARATION OF CONTRIBUTIONS<br />
The rolling <strong>noise</strong> model used here treats each wheel as an individual <strong>source</strong>. By adjusting the<br />
<strong>source</strong> term corrections iteratively to achieve a good fit between the measured and predicted<br />
time histories, the effects of individual vehicles or groups of vehicles can be removed, as<br />
illustrated in Figure 4.<br />
10
100<br />
60 millisecond L Aeq (dB)<br />
95<br />
90<br />
85<br />
80<br />
75<br />
70<br />
Measured<br />
Predicted Power Car Rolling<br />
Noise<br />
Predicted Mk 3 Rolling Noise<br />
65<br />
60<br />
-200 -100 0 100 200 300 400<br />
Distance from the front of the train (m)<br />
Figure 4 Predicted and Measured Time History of a Train Pass-by with the Predicted Levels<br />
<strong>for</strong> the Power Cars and Mk III coaches separated<br />
From this example pass-by, the rolling <strong>noise</strong> <strong>source</strong> term correction <strong>for</strong> the Mk III coaches in<br />
this train (ignoring the buffet car) is calculated as being 6.0 dB, while <strong>for</strong> the power cars it is<br />
15.9 dB. The measured Mk III <strong>source</strong> term correction is there<strong>for</strong>e identical to the value given<br />
in CRN but the power car term is 2.1 dB lower than the CRN value of 18.0 dB. The <strong>source</strong><br />
term correction <strong>for</strong> similar locomotives is 14.8 dB. Because of the difficulties inherent in<br />
separating the measured locomotive rolling <strong>noise</strong> from that of the rest of the train and from<br />
the traction <strong>noise</strong> it is possible that the Class 43 rolling <strong>noise</strong> <strong>source</strong> term correction in CRN<br />
includes some traction equipment <strong>noise</strong>.<br />
The same process can be used to calculate the <strong>source</strong> term corrections <strong>for</strong> the traction <strong>noise</strong><br />
from the power cars. The values are –5.8 dB <strong>for</strong> the front power car and –4.7 dB <strong>for</strong> the rear.<br />
As the locomotive was not on full power these values cannot be compared directly with the<br />
CRN “full power” term of 0 dB. However, they do indicate that traction equipment <strong>noise</strong> can<br />
make a significant contribution to overall pass-by <strong>noise</strong> even when the engines are not on full<br />
power and the train is travelling at a speed of around 75 mph.<br />
7.3 MEASURED DATA<br />
It is shown in Reference 3 that <strong>for</strong> statistical robustness it is necessary to measure the <strong>noise</strong><br />
from a number of vehicles. For example, <strong>for</strong> there to be a 90% probability of the sample<br />
mean being within +1.1 dB and –0.9 dB of the population mean it is necessary to measure the<br />
<strong>noise</strong> from at least 34 vehicles, requiring several trains to be considered.<br />
When the time histories <strong>for</strong> some of the other trains measured at the site were examined they<br />
were found to have unusual characteristics. Figure 5 presents the time history <strong>for</strong> a second<br />
HST at the site.<br />
11
105<br />
100<br />
60 millisecond L Aeq (dB)<br />
95<br />
90<br />
85<br />
80<br />
75<br />
70<br />
Measured<br />
Predicted<br />
65<br />
60<br />
-200 -100 0 100 200 300 400<br />
Distance from the front of the train (m)<br />
Figure 5 The Measured and Predicted Rolling Noise Time History <strong>for</strong> a Second HST<br />
It can be seen that there are measured levels at the centre of the train that are much higher<br />
than the predicted levels of rolling <strong>noise</strong>. Further examination of the data revealed that the<br />
bogies appeared to be ‘hunting’ 3 <strong>for</strong> these vehicles. Examination of other data <strong>for</strong> trains<br />
containing Mk III coaches revealed that this is a fairly common problem at this location.<br />
However, there were enough data from Mk III coaches running normally to allow an accurate<br />
quantification of the acoustic condition of the track at this location, as shown in Table 3.<br />
Track Number of Vehicles Average <strong>source</strong> term<br />
Correction (dB)<br />
Standard Deviation<br />
(dB)<br />
Up Fast 9 6.2 0.65<br />
Down Fast 12 6.3 0.52<br />
Table 3 Measured CRN Source Term Correction <strong>for</strong> Mk III Coaches (value in CRN is<br />
+6.0 dB)<br />
The Table shows that, although there are less than the 34 vehicles suggested in Reference 3,<br />
the standard deviations are relatively low and there is little variation between tracks.<br />
Furthermore, measurements made at the site on other vehicles <strong>for</strong> which <strong>source</strong> term<br />
corrections were already known showed that the measured corrections were consistently close<br />
to those given in CRN. There<strong>for</strong>e, the track quality indicated by the measurements of Mk III<br />
coaches was considered sufficiently statistically reliable.<br />
3 Hunting is a lateral oscillation of the bogie that occurs when the lateral damping in the bogie is insufficient <strong>for</strong><br />
the combination of wheel and rail dynamics at a site.<br />
12
Measurements on the Class 390, Class 221, Class 220 and Class 170 showed no evidence of<br />
the bogies ‘hunting’. However, it was found, with the exception of the Class 390 (which has<br />
electric traction), that there are significant levels of engine <strong>noise</strong> on some vehicles. Figure 6<br />
is a typical example <strong>for</strong> two Class 220 units (ie 2x4 vehicles) coupled together.<br />
105<br />
100<br />
60 millisecond L Aeq (dB)<br />
95<br />
90<br />
85<br />
80<br />
75<br />
70<br />
Measured<br />
Predicted<br />
65<br />
60<br />
-200 -100 0 100 200 300 400<br />
Distance from the front of the train (m)<br />
Figure 6 Typical Measured and Predicted Time History <strong>for</strong> two Class 220 Voyagers coupled<br />
together<br />
Because the engines on each Class 220 unit provide both traction power and local power <strong>for</strong><br />
the train air-conditioning, lighting, etc, it is possible <strong>for</strong> the engines to be running at different<br />
speeds. The peaks in Figure 6 show this effect, with wheel-rail <strong>noise</strong> only being obviously<br />
discernible at the centre of the train. The techniques indicated above allow the rolling <strong>noise</strong><br />
and traction <strong>noise</strong> components to be separated from each other.<br />
7.4 TRACK CORRECTION<br />
The measured <strong>source</strong> term corrections <strong>for</strong> the Mk III coach indicate that the track is slightly<br />
noisier than it should be to meet the CRN requirements exactly. However, the difference is<br />
not large enough to justify rejection of the data, which have instead been corrected to take<br />
account of the track roughness. This correction is derived from the fact that the rolling <strong>noise</strong><br />
is excited by the combined rail and wheel surface roughness. As the rail roughness is the<br />
same <strong>for</strong> all trains on one track and the combined wheel/rail roughness <strong>for</strong> a Mk III coach on<br />
track that would produce a CRN correction of 6 dB is dominated by the rail roughness, it is<br />
possible to produce a true correction <strong>for</strong> all other types of vehicle. The difference between the<br />
measured Mk III <strong>source</strong> term correction and the value presented in CRN is known as the<br />
Acoustic Track Quality (ATQ) which, at the measurement site, was there<strong>for</strong>e 0.2 dB <strong>for</strong> the<br />
Up Fast track and 0.3 dB <strong>for</strong> the Down Fast track. Figure 7 shows the effect of ATQ on the<br />
measured <strong>source</strong> term corrections <strong>for</strong> three different vehicles.<br />
13
16<br />
Corrected Source Term (dB).<br />
14<br />
12<br />
10<br />
8<br />
6<br />
4<br />
Mk 3 coach<br />
Mk 2 coach<br />
Class 165 DMU<br />
2<br />
0<br />
-1 -0.5 0 0.5 1 1.5 2<br />
Acoustic Track Quality (dB)<br />
Figure 7 Effect of Acoustic Track Quality on the Corrected Source Terms<br />
It can be seen that the corrected <strong>source</strong> term <strong>for</strong> the cast iron tread-braked Mk II coach<br />
increases less rapidly with ATQ than <strong>for</strong> the disc-braked Mk III. The <strong>source</strong> term <strong>for</strong> the<br />
Class 165 is close to the Mk III but increases less rapidly, having some driven axles and hence<br />
somewhat rougher wheels than the unpowered Mk III coach.<br />
The data acquired during this exercise were similarly corrected <strong>for</strong> the measured ATQ values<br />
<strong>for</strong> each track under consideration at the site. The data from the two tracks were then<br />
combined.<br />
7.5 RESULTS<br />
Table 4 shows the measured rolling <strong>noise</strong> <strong>source</strong> term corrections <strong>for</strong> Class 390, Class 221,<br />
Class 220 and Class 170.<br />
Number of Vehicles Average Source<br />
Term (dB)<br />
Standard Deviation<br />
(dB)<br />
Class 390 86 8.7 1.4<br />
Class 221 10 6.0 0.4<br />
Class 220 4 7.7 2.0<br />
Class 170 4 7.6 0.4<br />
Table 4 Average Measured Rolling Noise Source Terms Corrected <strong>for</strong> Acoustic Track<br />
Quality<br />
It can be seen that, except <strong>for</strong> the Class 390, the number of vehicles is less than the 34 that<br />
Reference 3 suggests. This is because the rolling <strong>noise</strong> from a number of vehicles was<br />
contaminated with engine <strong>noise</strong> and could not be included.<br />
14
The extraction of traction <strong>noise</strong> <strong>source</strong> term corrections from the measured data is difficult on<br />
an operating <strong>railway</strong> as engine condition is unknown. However, from the noisiest Class 220<br />
and Class 221 units the traction <strong>noise</strong> <strong>source</strong> term correction was found to be of the order of<br />
–3dB (compared with typical full power correction <strong>terms</strong> <strong>for</strong> diesel locomotives of 0.0 dB in<br />
CRN). This indicates that, despite CRN’s current non-inclusion of traction <strong>noise</strong> <strong>for</strong> Diesel<br />
Multiple Units, more powerful modern Units may need to be treated within CRN similarly to<br />
locomotives, with <strong>source</strong> term corrections both <strong>for</strong> rolling <strong>noise</strong> and traction <strong>noise</strong>.<br />
The effect of the number of vehicles that were available is shown in Table 5.<br />
Range of Population Source Terms Based on Measured Values (dB)<br />
5% 25% 75% 95%<br />
Class 390 9.4 9.0 8.5 8.2<br />
Class 221 8.0 6.8 5.3 4.4<br />
Class 220 11.2 9.1 6.7 5.3<br />
Class 170 11.1 9.1 6.6 5.2<br />
Table 5 Effect of Number of Vehicles Available on the Possible Range of the Rolling Noise<br />
Source Terms (from the cumulative distribution)<br />
The results in Table 5 there<strong>for</strong>e show, <strong>for</strong> example, that there is a 90% chance that the<br />
population <strong>source</strong> term correction <strong>for</strong> the Class 390 lies between 9.4 dB and 8.2 dB, and a<br />
50% chance that it lies between 9.0 dB and 8.5 dB.<br />
Table 6 compares the measured <strong>source</strong> term corrections with those predicted in Section 3.<br />
Rolling Noise Source Term (dB)<br />
Measured Predicted Difference (dB)<br />
Class 390 4 8.7 7.1 1.6<br />
Class 221 6.0 7.6 -1.6<br />
Class 220 7.7 7.6 0.1<br />
Class 170 7.6 7.6 0.0<br />
Table 6 The Measured and Predicted Rolling Noise Source Terms<br />
From these data the Class 390 is seen to be noisier than predicted while the Class 221 is<br />
quieter. It can also be seen that the Class 221 is quieter than the Class 220. This difference in<br />
characteristics has a less than 9% chance of arising by chance.<br />
4 Based on a 9-car train comprising 3 trailer cars and 6 motor cars.<br />
15
8 Conclusions<br />
Source correction <strong>terms</strong> <strong>for</strong> rolling <strong>noise</strong> have been calculated <strong>for</strong> an agreed set of <strong>railway</strong><br />
vehicles representing a large proportion of the current types that are absent from the CRN<br />
procedure. Measured data have also been provided <strong>for</strong> a range of freight vehicles, with the<br />
permission of EWS. Eventually it would be advisable to base all such <strong>terms</strong> on measurement,<br />
especially if they are to be incorporated within a revised CRN document, but the predicted<br />
values presented in this report can be considered to be sufficiently accurate <strong>for</strong> initial <strong>noise</strong><br />
mapping purposes.<br />
Rolling <strong>noise</strong> <strong>source</strong> term corrections have been obtained by measurement <strong>for</strong> the Class 390<br />
Pendolino Brittanico tilting electric train, the Class 220 Virgin Voyager Diesel Multiple Unit,<br />
the Class 221 tilting Virgin Voyager and the Class 170 Turbostar Diesel Multiple Unit<br />
Intrusive traction <strong>noise</strong> elements and abnormal rolling <strong>noise</strong> behaviour have been separated<br />
from the pass-by characteristics by an iterative process that involves the fitting of idealised<br />
pass-by time histories to the measured time histories.<br />
Although the rail head was visually in good condition at the measurement site, measurements<br />
of known vehicles (Mk III coaches) showed that it was a little rougher than “CRN” track, and<br />
the results have been corrected accordingly.<br />
The corrections are: Class 390, 8.7 dB; Class 221, 6.0 dB; Class 220, 7.7 dB; Class 170,<br />
7.6 dB.<br />
The Class 390 has been shown to be noisier in rolling than predicted in Section 3. The most<br />
likely reason <strong>for</strong> this is that the wheels of the Class 390 have a higher surface roughness than<br />
expected. Although it is known that wheels on powered axles tend to have a surface<br />
roughness higher than that found on unpowered axles, and the Class 390 has a large number<br />
of powered axles, the Class 221 also has a high percentage of powered axles and yet is quieter<br />
than predicted. There<strong>for</strong>e, it is possible that development of the surface roughness of a<br />
powered axle depends on a complex combination of factors.<br />
The significant presence of traction <strong>noise</strong> from the Class 220 and Class 221 indicates that this<br />
<strong>noise</strong> <strong>source</strong> should be included additionally within CRN predictions if these vehicles are to<br />
be represented accurately in <strong>noise</strong> maps. Currently DMU traction <strong>noise</strong> is excluded from the<br />
CRN procedure. It is likely that this stock produces higher levels of traction <strong>noise</strong> than found<br />
with earlier DMUs because their engines are more than twice as powerful as those on older<br />
units. However, collecting appropriate data would require measurements to be taken where<br />
the trains were developing full power, which was not necessarily the case during the current<br />
measurements where rolling <strong>noise</strong> was the prime concern.<br />
16
9 References<br />
1 Department of Transport, ‘Calculation of Railway Noise 1995’, published by HMSO<br />
2 S Peters, ‘The Prediction of Railway Noise Profiles’, Journal of Sound and Vibration,<br />
Volume 32, No 1, 1974, pages 87-99<br />
3 AEJ Hardy and RRK Jones, ‘Reducing the Errors when Measuring Railway Noise and<br />
Vibration’, Proceedings of the Institution of Civil Engineers, Transport 153, Issue 2,<br />
May 2002, pages 103-109<br />
.<br />
17