A Guide to Mechanical Impedance and Structural Respons...
A Guide to Mechanical Impedance and Structural Respons...
A Guide to Mechanical Impedance and Structural Respons...

Create successful ePaper yourself
Turn your PDF publications into a flip-book with our unique Google optimized e-Paper software.
A <strong>Guide</strong> <strong>to</strong> <strong>Mechanical</strong> <strong>Impedance</strong><br />
<strong>and</strong> <strong>Structural</strong> <strong>Respons</strong>e Techniques<br />
17—179
A <strong>Guide</strong> <strong>to</strong> <strong>Mechanical</strong> <strong>Impedance</strong> <strong>and</strong><br />
<strong>Structural</strong> <strong>Respons</strong>e Techniques<br />
by H. P. Olesen <strong>and</strong> R. B. R<strong>and</strong>all<br />
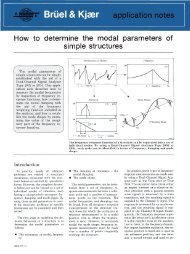
Introduction<br />
In recent years there has been a that the comfort of passengers is en- 1. Determination of natural frequenrapidly<br />
developing interest in the sured. cies <strong>and</strong> mode shapes.<br />
field of mechanical dynamics for a<br />
2. Measurement of specific material<br />
variety of reasons. An example of a different kind is properties such as damping cagiven<br />
by the machine <strong>to</strong>ol industry, parity or dynamic stiffness.<br />
Firstly, the development of where excessive vibration can se- 3. As a basis of an analytical<br />
stronger materials <strong>and</strong> greater econ- verely limit the quality of machining model. From measurements of<br />
omy in design has led <strong>to</strong> increas- <strong>and</strong> grinding operations. the impedances of individual comingly<br />
lighter structures, more prone<br />
ponents or substructures it is pos<strong>to</strong><br />
vibration problems. At the same The overall result is that the dy- sibie <strong>to</strong> predict the behaviour of<br />
time, increasing rotational speeds namic behaviour of a machine or combined systems, in a manner<br />
also give increasing likelihood of structure is now an important fac<strong>to</strong>r completely analogous <strong>to</strong> the<br />
having <strong>to</strong> deal with structural reso- in design <strong>and</strong> development along study of complex electrical cirnances.<br />
with the analysis of static stresses cuits.<br />
<strong>and</strong> deflections, <strong>and</strong> is normally<br />
Another important fac<strong>to</strong>r is the re- studied in its own right, rather than The concepts of mechanical imcent<br />
upsurge of interest in environ- just being allowed for in an exces- pedance <strong>and</strong> mobility were develmentai<br />
questions since the improve- sive "safety fac<strong>to</strong>r", or treated as oped from electro-mechanical <strong>and</strong><br />
ment of both noisy <strong>and</strong> vibrating en- an afterthought when problems electro-acoustic analogies in the<br />
vironments often can be simplified have been encountered. 1920s. Since then the usefulness<br />
<strong>to</strong> a question of reducing the me-<br />
of these concepts in forced vibration<br />
chanicaf vibration, either at its One very useful experimental techniques <strong>and</strong> in the theoretical<br />
source or somewhere along the technique for the study of dynamic evaluation of structures has imtransmission<br />
path. behaviour of machines <strong>and</strong> struc- proved considerably. This is due<br />
tures concerns the measurement of partly <strong>to</strong> more sophisticated vibra-<br />
Typical examples are provided by what is loosely termed "mechanical tion transducers, vibration exciters<br />
the transportation industries, where impedance". Broadly speaking, this <strong>and</strong> analysis equipment <strong>and</strong> partly<br />
in the development of for example defines the relationships between <strong>to</strong> the acceptance in mechanical <strong>and</strong><br />
aircraft, au<strong>to</strong>mobiles <strong>and</strong> ships, forces <strong>and</strong> motions at various civil engineering of mechanical imcare<br />
has <strong>to</strong> be taken not only that points, both with respect <strong>to</strong> ampii- pedance <strong>and</strong> related concepts so<br />
the various components can with- tude <strong>and</strong> phase. Ref. 10 lists the that they could be h<strong>and</strong>led on their<br />
st<strong>and</strong> the dynamic loadings <strong>to</strong> three main applications of imped- own without resorting <strong>to</strong> a previous<br />
which they are subjected, but also ance testing as: conversion <strong>to</strong> electrical circuits.<br />
<strong>Mechanical</strong> impedance <strong>and</strong> mobility<br />
The mechanical impedance <strong>and</strong> not be given here. The units after of motion relative <strong>to</strong> the direction of<br />
mobility (for simple harmonic mo- each ratio are Sl-units*. force when this is not obvious from<br />
tion) are defined as the complex ra- the measurement conditions or<br />
tios of force vec<strong>to</strong>r <strong>to</strong> velocity vec- As both force <strong>and</strong> motion are vec- from the calculations.<br />
<strong>to</strong>r, <strong>and</strong> velocity vec<strong>to</strong>r <strong>to</strong> force vec- <strong>to</strong>rs in space as well as in time care * mtemat.onai Organ.zat.on for st<strong>and</strong>ards<br />
<strong>to</strong>r respectively. This is shown in should be taken <strong>to</strong> define directions tion (ISO).<br />
Table 1 where, in addition, the simi- ,__^____________________^^^__^_^<br />
iar ratios involving acceleration <strong>and</strong><br />
displacement are given. Dynamic pv* Mass ^ s F<br />
Ns N£ 2<br />
(Acce(eratjon h | , JIL ]<br />
l<br />
(Apparent Weight}<br />
a<br />
1 m ! s (Acceleration through M Force) a<br />
1<br />
F Ns^ Ns2<br />
The terms given in the table are <strong>Mechanical</strong> <strong>Impedance</strong> — | ~ j Mobility<br />
JL V < H i<br />
v V m<br />
taken from the American St<strong>and</strong>ard<br />
(<strong>Mechanical</strong> Admittance) F<br />
\[<br />
— J<br />
Ns<br />
i<br />
USAS S2.6-1963: Specifying the F N d m<br />
<strong>Mechanical</strong> <strong>Impedance</strong> of Struc- Stiffness<br />
j [-<br />
1<br />
| T ' N~ ]<br />
i d m ' , Compliance 6<br />
F<br />
— 1<br />
1<br />
N<br />
J<br />
tures (1). Other terms have been ' —"~—~ ~ ■<br />
<strong>Mechanical</strong> <strong>Impedance</strong> _F<br />
USed by different authors but will Table 1. Terminology for complex dynamic ratios of force <strong>and</strong> motion<br />
Ns<br />
m ,<br />
J<br />
3
When force <strong>and</strong> motion values in<strong>to</strong> motion. By measuring, for ex- ledge about the response ability of<br />
are measured at the same point <strong>and</strong> ample, the mechanical impedance of the strucutres involved, <strong>and</strong> of the<br />
in the same direction the ratios are points on a structure, knowledge is actual responses or forces. After<br />
termed driving point values, or in gained about its response <strong>to</strong> vibra- combination of this information the<br />
short, point values, e.g., point im- tional forces at different frequencies. need or the possibility of corrective<br />
pedance. Similarly, a measurement of the mo- measures may be evaluated.<br />
tion of the structure, after it has<br />
When force <strong>and</strong> motion are meas- been placed on a vibrating support. In the following sections, after a<br />
ured at different points or at the may be compared <strong>to</strong> its mechanical brief discussion of narrow b<strong>and</strong> fresame<br />
point with an angle between impedance <strong>to</strong> obtain information quency analysis, rules are given for<br />
them they are termed transfer val- about the forces which act on the evaluating mechanical impedance<br />
ues e.g., transfer impedance. structure. data by graphical means, the instrumentation<br />
used for practical meas-<br />
The ratios given in the first <strong>and</strong> To solve vibrational problems, urement is discussed <strong>and</strong> a few<br />
second column of Table 1 really re- therefore, both a mechanical imped- practical examples are given, as well<br />
present, as functions of frequency, ance may have <strong>to</strong> be measured, <strong>and</strong> as references <strong>to</strong> further literature<br />
the difficulty or ease, respectively, a narrow b<strong>and</strong> frequency analysis about <strong>Mechanical</strong> impedance appliwith<br />
which a structure can be set carried out <strong>to</strong> obtain detailed know- cations.<br />
Narrow B<strong>and</strong> Frequency Analysis<br />
One of the major reasons for stu- from the source excitation, or in Where the Q-fac<strong>to</strong>rs (see later<br />
dying dynamic phenomena as func- modifying the structure <strong>to</strong> "detune" for definition) are greater than about<br />
tions of frequency is the simplicity or damp that particular frequency re- 50, however, it may be necessary <strong>to</strong><br />
that this introduces for linear sys- gion. go <strong>to</strong> constant b<strong>and</strong>width filters,<br />
terns, since many actual structures _. , , , purely in order <strong>to</strong> obtain a b<strong>and</strong>width<br />
. . . . The type of frequency analysis less , tnan iU - ft/ - * • x<br />
have approximately linear parame- , 7 ... ;_ \ - n<br />
1% m certain frequency<br />
, /: . . , _ performed will perhaps be influters<br />
(stiffness, damping, mass). One _ , . . u u ^ ranges.<br />
x<br />
a<br />
, , ,. enced by the approach chosen, <strong>and</strong><br />
important property of such linear , ■_-,_, . . . ,<br />
. . / , thus a brief discussion is given of „ _ . . ._. , . ,<br />
systems is that of superposition. In . . , ., , , , , Constant b<strong>and</strong>width analysis (par-<br />
K K<br />
. ,<br />
. , the methods available for frequency . . , ,. , ■ *<br />
particular, an input at a given fre-<br />
ticularly on a linear frequency scale)<br />
quency gives an output at the same<br />
is also beneficial for the analysis of<br />
frequency, though modified in ampli- One of the first decisions <strong>to</strong> be excitations with a high harmonic<br />
tude <strong>and</strong> phase according <strong>to</strong> the fre- made is between constant b<strong>and</strong>- content, since the harmonics are<br />
quency response function, <strong>and</strong> the width <strong>and</strong> constant proportional then uniformly separated.<br />
behaviour at this frequency is thus b<strong>and</strong>width analysis, it is often<br />
independent of what is going on at claimed that "narrow b<strong>and</strong> analysis" The overall consideration in<br />
other frequencies. A related advan- is synonymous with narrow constant choice of analysis method is that it<br />
tage is that combination of cascaded b<strong>and</strong>width analysis, but this is not should everywhere give sufficient<br />
systems involves only multiplication necessarily the case. For example resolution, without giving <strong>to</strong>o much<br />
of their characteristics at each fre- the Analyzer Type 2120 has con- information in other areas, because<br />
quency, <strong>and</strong> this in turn is simplified stant percentage b<strong>and</strong>widths down of the detrimental effect of the lat<strong>to</strong><br />
addition when logarithmic (dB) <strong>to</strong> 1%, <strong>and</strong> this will often give ade- ter on analysis speed <strong>and</strong> effiamplitude<br />
sca\es are used. Even quate resolution. In fact, the re- ciency. Frequency Analysis is<br />
though excitation is rarely sinusoidal sponse of mechanical structures covered in depth in Ref.17.<br />
at a single frequency, the use of tends <strong>to</strong> be similar in principle <strong>to</strong> a<br />
Fourier analysis (narrow b<strong>and</strong> fre- constant percentage b<strong>and</strong>width filter Perhaps the best compromise is<br />
quency analysis) makes it possible <strong>to</strong> (a certain amplification fac<strong>to</strong>r Q the Heterodyne Analyzer Type 2010<br />
break down a more complex signal corresponding <strong>to</strong> a certain percen- which has both linear <strong>and</strong> logarithin<strong>to</strong><br />
its components at various fre- tage b<strong>and</strong>width). Thus, where the mic frequency sweeps covering the<br />
quencies, thus considerably simpli- excitation is fairly broadb<strong>and</strong> it may range from 2 Hz <strong>to</strong> 200 kHz. Alfying<br />
its interpretation. be most efficient <strong>to</strong> analyze the re- though it is primarily a constant<br />
sponse with constant percentage b<strong>and</strong>width instrument it can be pro-<br />
A typical dynamic problem would b<strong>and</strong>width filters. grammed <strong>to</strong> step up au<strong>to</strong>matically in<br />
involve obtaining the frequency b<strong>and</strong>width with increasing frespectrum<br />
of the input <strong>to</strong> a mechani- Another advantage of constant quency, thus approximating a concal<br />
system (be it force or motion) <strong>and</strong> percentage analysis is that it gives stant percentage b<strong>and</strong>width analysis<br />
by comparing this with the meas- uniform resolution on a logarithmic (where the percentage can be conured<br />
response characteristics <strong>to</strong> de- frequency scale, <strong>and</strong> thus can be siderably lower than 1%). The main<br />
termine whether a problem will arise used over a wide frequency range. disadvantage of such an analyzer,<br />
due <strong>to</strong> coincidence of peaks in the As explained later, logarithmic viz. long analysis time, can be obviexcitation<br />
<strong>and</strong> mobility. The solution scales are moreover advantageous ated by use of the Digital Event Reof<br />
such a problem would consist for the interpretation of mechanical corder Type 7502 as described in<br />
either in eliminating that component impedance data. Ref. 11. The large frequency trans-<br />
4
' "formations available with this instrument<br />
(which incidentally can equally<br />
well be used with the Analyzer Type<br />
2120) allow reduction of analysis<br />
time <strong>to</strong> the order of a minute or so,<br />
<strong>and</strong> also allow the effective b<strong>and</strong>width<br />
<strong>to</strong> be made smaller than the<br />
minimum available on the 2010<br />
(3,16Hz).<br />
When even faster analysis is required,<br />
or where a very large num-<br />
ber of spectra must be averaged <strong>to</strong> AM the analyzers mentioned can<br />
give a stable result, the Real-Time write out a "hard copy" of the analy-<br />
Narrow B<strong>and</strong> Analyzer Type 3348 sis results on a Level Recorder Type<br />
will often be preferred. The real-time 2306, or 2307 which, as described<br />
capability also gives the possibility of later, can also be used for recording<br />
visually following non-stationary the impedance amplitude <strong>and</strong> phase<br />
phenomena e.g., seeing how the re- characteristics. Output in digital<br />
sponse of a machine varies as it form (ASCII-coded BCD) on punch<br />
runs up or down in speed, <strong>and</strong> thus tape is also possible.<br />
quickly establishing "dangerous"<br />
operating areas.<br />
<strong>Impedance</strong> <strong>and</strong> mobility of struct :tural elements<br />
The vibrational response of structures<br />
may in many cases be represented<br />
by a theoretical model which<br />
consists of masses, springs <strong>and</strong><br />
dampers. If the structure is complicated<br />
<strong>and</strong> if the response must be<br />
duplicated exactly over a large frequency<br />
range the number of elements<br />
needed may be very large.<br />
However, for simple systems, <strong>and</strong><br />
even for complicated structures in a<br />
limited frequency range, the response<br />
may be represented sufficiently<br />
well by a few elements.<br />
three elements are given in Fig.1 <strong>to</strong>- end <strong>to</strong> correspond <strong>to</strong> the relative mogether<br />
with their mechanical imped- tion between their ends. They are<br />
ance <strong>and</strong> mobility.<br />
considered massless. in cases where<br />
both ends of a spring or damper<br />
Note that the mass is free in move, then it is the difference bespace<br />
<strong>and</strong> that the spring <strong>and</strong> dam- tween the absolute motions of their<br />
per require one end fixed in order for ends which must be substituted in<strong>to</strong><br />
the absolute motion of the excited equations (2) <strong>and</strong> (3).<br />
The force F needed <strong>to</strong> set a pure<br />
mass m in<strong>to</strong> vibration is proportional<br />
<strong>to</strong> the acceleration a.<br />
F-ma [Nl (1}<br />
The force required <strong>to</strong> deflect a<br />
spring with stiffness k is proportional<br />
<strong>to</strong> the relative displacement d<br />
of the two ends of the spring<br />
F = kd [N] (2)<br />
Finally the force is proportional <strong>to</strong><br />
the relative velocity v of the two<br />
ends of a damper with damping coefficient<br />
c for pure viscous damping.<br />
F ^ cv [N] (3)<br />
For sinusoidal motions, acceleration,<br />
velocity <strong>and</strong> displacement measured<br />
at a given point are related by<br />
the relationships<br />
a = JOJV = -u) 2 d (4)<br />
v = \OJ6 ~ (1/jo>)a (5)<br />
d = (1/jw) v - (1/-w 2 )a (6)<br />
here OJ = 2ni<br />
<strong>and</strong> f is the frequency of vibration<br />
The graphical signatures for the<br />
Fig.3. Mobility for mass, spring <strong>and</strong> damper<br />
5
The impedances <strong>and</strong> the mobili- this representation the impedances tance on both abcissae <strong>and</strong> ordities<br />
of the elements are best illu- <strong>and</strong> mobilities are given as straight nates <strong>and</strong> whereby the slopes for<br />
strated in log-log diagrams with fre- lines. (See Figs.2 <strong>and</strong> 3 where a mass <strong>and</strong> spring impedance lines<br />
quency f = co/ln as the abcissae. In fac<strong>to</strong>r of 10 equals the same dis- are + 1 <strong>and</strong> —1 respectively).<br />
Combination of elements<br />
A mass supported on springs is a<br />
common case in practice, e.g., in vibration<br />
isolation. In simple systems<br />
the mass can be considered <strong>to</strong> be<br />
placed on one spring which has<br />
a stiffness value equal <strong>to</strong> the sum<br />
of stiffnesses of the supports.<br />
(Damped systems will be considered<br />
later).<br />
In the literature this basic system<br />
is very often symbolized as in<br />
Fig.4a for force applied <strong>to</strong> the mass<br />
as for instance with a mo<strong>to</strong>r placed<br />
on springs. However, this representation<br />
may lead <strong>to</strong> the misconcepion<br />
that the system is a so-called from equation 7 but it is less time<br />
series system while it is, in fact, a consuming <strong>to</strong> combine the curves<br />
parallel system where the force is graphically. (Remember that the<br />
shared between the mass <strong>and</strong> the mass impedance has a positive<br />
spring as indicated clearly in Fig.4b. phase angle of 90° (j) <strong>and</strong> the<br />
Here the force is applied <strong>to</strong> a mov- spring impedance has a negative<br />
ng plane <strong>to</strong> which both the mass phase angle of 90° (—j or 1/j) relamd<br />
the spring are attached. (See tive <strong>to</strong> the force). The curves can be<br />
^ef.2).<br />
obtained by subtracting the lowest<br />
value from the highest value at<br />
As the motion is common <strong>to</strong> the each frequency but a more straight<br />
wo elements their impedances forward method is <strong>to</strong> construct a sofrom<br />
Table 2) can be added <strong>to</strong> ob- called impedance skele<strong>to</strong>n, as given<br />
ain the point impedance. by Salter (2). This is shown in<br />
-7-7.-7 • , I /■ Fig.5b<br />
a<br />
where the spring <strong>and</strong> mass<br />
Z = Zrn<br />
m + Z K = j<strong>to</strong>m + k/j<strong>to</strong><br />
. , . -<br />
(7) lines are combined up <strong>to</strong> their inter- ;<br />
= j (com — k/co) section at fp where they counteract<br />
At low frequencies <strong>to</strong> is very each other <strong>to</strong> produce a vertical line<br />
>mall <strong>and</strong> Z equals k/jaj as jojm can for Z - 0.<br />
)e neglected. At high frequencies <strong>to</strong><br />
s large <strong>and</strong> Z equals jwm.<br />
The impedance curve can then be<br />
drawn <strong>to</strong> the desired accuracy by de-<br />
At a frequency fR where jo>m = termining two or more points from<br />
—k/jw a resonance occurs where Z the spring <strong>and</strong> mass curves <strong>and</strong><br />
= 0 <strong>and</strong> o) = co 0 = v k/m. drawing a curve through the points<br />
from the skele<strong>to</strong>n values at 0,1 fR,<br />
The impedance can be plotted fR <strong>and</strong> 10 fp (Fig.5c).<br />
Fig.4. A mass supported on a spring shown<br />
in an often used representation (a) <strong>and</strong><br />
in the correct way (b)<br />
Fig.5. Graphical construction of the mechanical impedance of a mass supported on a spring<br />
Base excited system<br />
If the system of Fig.4 is excited at<br />
the base as shown in Fig.6 it is<br />
seen that the velocities at the base<br />
<strong>and</strong> at the mass are different, i.e.,<br />
both point <strong>and</strong> transfer values do exist.<br />
As the force on the mass is<br />
equal <strong>to</strong> the force at the base the<br />
system can best be evaluated from<br />
the mobilities of the mass <strong>and</strong> the<br />
spring. These are directly taken by<br />
inversion of the impedance curves of<br />
Fig.5 (see Fig.7a).<br />
From these curves the point mobility<br />
skele<strong>to</strong>n <strong>and</strong> the point mobility<br />
curve can be constructed in a similar<br />
manner <strong>to</strong> the impedance curve of<br />
Fig.5c (seeFig.7b).<br />
Fig.6. Base excited system<br />
6
However, it is a mobility plot <strong>and</strong><br />
the minimum at fA represents an<br />
antiresonance, i.e. an infinite force<br />
would be required <strong>to</strong> produce any<br />
motion at all.<br />
The transfer mobility, on the<br />
other h<strong>and</strong>, experiences no discontinuity.<br />
As the force transmitted<br />
through the spring remains constant<br />
<strong>and</strong> equal <strong>to</strong> F the velocity Vt<br />
of the mass remains the same as it<br />
would be for a mass suspended in<br />
space <strong>and</strong> hence the transfer mobility<br />
is a straight line with the same<br />
slope <strong>and</strong> position as a point mobility<br />
curve for the mass alone. The<br />
motion of the mass being reduced<br />
rapidly suggests that at high fre-<br />
Fig. 7. Point mobility <strong>and</strong> transfer mobility for a base excited system<br />
quencies <strong>to</strong> all practical purposes placed on a rigid support as that of<br />
the spring can be considered as Fig. 1 b.<br />
The mass-spring-mass system<br />
An example of further extension<br />
of the model is given by the evaluation<br />
of the mass-spring-mass system<br />
which is often encountered.<br />
This system is shown in Fig.8, <strong>and</strong><br />
it is seen that the force is divided<br />
between the mass <strong>and</strong> the spring<br />
supported mass (the sprung mass).<br />
Hence, the point impedance must<br />
be found from the combination of<br />
the mass impedance line (shown for<br />
three different masses in Fig.9),<br />
<strong>and</strong> the point impedance skele<strong>to</strong>n of<br />
the sprung mass which has antiresonance<br />
at fA The point impedance<br />
skele<strong>to</strong>n is obtained by inversion of<br />
the point mobility skele<strong>to</strong>n of Fig.7b<br />
<strong>and</strong> is shown in Fig.10. The resulting<br />
point impedance skele<strong>to</strong>ns <strong>and</strong><br />
Fig.8. A mass-spring-mass system<br />
curves for the three values of rri2<br />
are given in Fig. 1 1.<br />
It is seen that the impedance is<br />
obtained by the combination of the<br />
curves in Figs.9 <strong>and</strong> 10 by keeping<br />
the highest value <strong>and</strong> by letting the<br />
Fig. 10. Point impedance skele<strong>to</strong>n of the<br />
sprungmass shown in Fig.6<br />
Fig.9. Mass impedance lines for three values of m2 drawn <strong>to</strong> the same scales as used in Figs.10 <strong>and</strong> 11<br />
7
Fig. 11.<br />
Point impedance for the mass-spring-mass system for three different ratios of m2/m-|<br />
values go <strong>to</strong> infinity at the antireso- <strong>to</strong> mi + m2 <strong>and</strong> after the peak- Disregarding for the moment the<br />
nance <strong>and</strong> <strong>to</strong> zero at the resonance. notch they continue as impedances point impedance curve it can be<br />
Thereby the so-catled peak-notch re- with respect <strong>to</strong> nri2 as m-j is now seen that <strong>to</strong> maintain a constant<br />
sponse curve is obtained. That this decoupled. Between the peak <strong>and</strong> transfer velocity Vt below <strong>and</strong> over<br />
is the case can be derived from the the notch there is an interval in the antiresonance, the force F must<br />
fact that at the antiresonance the which the impedance is springlike. be jw(mi + 1H2) V t <strong>and</strong>, hence, the<br />
point impedance switches instan- transfer impedance value continues<br />
taneously from an infinitely high<br />
Tn e frequency of antiresonance is as a straight line with slope + 1 acmass<br />
value <strong>to</strong> an infinitely high stiff- equal <strong>to</strong> ross tne antiresonance (see Fig. 12).<br />
ness value which is negative ^ „ ^<br />
(180°phase shift) with respect <strong>to</strong> the<br />
f A = (1/2ff) / ] ^ < 8)<br />
impedance of m?. As the hiqh y stiff- . iU , , At the resonance, however, it is<br />
. .<br />
<strong>and</strong> the frequency of resonance is t ,<br />
ness value is reduced with increa- seen from the point impedance<br />
sing frequency the point impedances f = {■sfe-n) Jk (m, +m 2 )/m 1 m 2 (9) curve that no matter which velocity<br />
of the sprung mass <strong>and</strong> rri2 will V p (<strong>and</strong> thereby the force input <strong>to</strong><br />
compensate each other at the reson- <strong>and</strong> it is seen that the sprung mass) is chosen the <strong>to</strong>ance<br />
<strong>to</strong> produce zero impedance. , „ _ tal input force is zero. Hence the<br />
form 2 «m 1/ f R = (1/2*)/k7n^ (10) tfansfer jmpedance atso goes t0<br />
In Figs.11a, 11b <strong>and</strong> 11c it is = f = (1/2ff) j ^ ^ = yy, (1 1} zero. Above the resonance the point<br />
seen that the curves commence as impedance slope changes <strong>to</strong> +1,<br />
mass like impedances with respect m 2 » m 1; - f R =s (1/2TT) Jk/m } = f A (12) compared <strong>to</strong> —1 before the reso-<br />
^<br />
Fig. 12. Transfer impedance skele<strong>to</strong>ns for the mass-spring-mass system<br />
8
Fig. 13<br />
Damped mobility curves<br />
nance. As the <strong>to</strong>tal force required pie conversion as above. In this respect reference (2)<br />
<strong>to</strong> keep V p constant, <strong>and</strong> thereby _ by Salter is valuable as it extends<br />
keep the force input <strong>to</strong> the sprung the discussion <strong>to</strong> larger systems<br />
mass constant, must experience a By adding subsystems <strong>to</strong> the sys- <strong>and</strong> <strong>to</strong> systems with more than one<br />
similar change of slope the transfer tern in Fig.8 or by letting itself be axis, <strong>and</strong> describes the inclusion of<br />
impedance slope will increase from part of a larger model the <strong>to</strong>tal re- simple rotary systems. Similarly it<br />
+ 1 <strong>to</strong> + 3. From the impedance skel- sponse can be evaluated by combin- discusses the influence of damping<br />
e<strong>to</strong>ns in Figs. 11 <strong>and</strong> 12, the mobii- ing either impedance or mobility skel- on the impedance <strong>and</strong> mobility<br />
ity skele<strong>to</strong>ns can be obtained by sim- e<strong>to</strong>ns following the rules given curves which is treated below.<br />
The influence of damping<br />
On most structures which have cation fac<strong>to</strong>rs Q. In simple viscoelas- name implies, represents the fac<strong>to</strong>r<br />
not been treated specifically <strong>to</strong> be tic systems only with which <strong>to</strong> multiply or divide*the<br />
highly damped one must expect Q = c/ /"km (14) intersection values between mass<br />
rather low damping values, <strong>and</strong> con-<br />
<strong>and</strong> stiffness lines in the mobility disequently<br />
high mechanical amplifi- The amplification fac<strong>to</strong>r, as its agram <strong>to</strong> obtain the mobility values<br />
Fig.14.<br />
Damped impedance curves<br />
* For systems with closely spaced antfresonances <strong>and</strong> resonances the Q value should be applied <strong>to</strong> the antiresonant subsystems before combination<br />
with other elements.<br />
9
of the resonances <strong>and</strong> the antireson- formed from one piece of raw mateances<br />
respectively, <strong>and</strong> vice versa rial the Q values found may range<br />
for the impedance values. This is il- <strong>to</strong> more than a hundred.<br />
lustrated in Figs. 13 <strong>and</strong> 14 where<br />
the mobility curve from Fig.7b <strong>and</strong> On the other h<strong>and</strong>, s<strong>and</strong>wich conthe<br />
impedance curve from Fig.11b structions with viscoelastic layers in<br />
have been redrawn for Q values of shear, specially designed dampers<br />
4, 10 <strong>and</strong> 25. or even materials with high integral<br />
damping, may provide Q values con-<br />
Q values of 4 <strong>to</strong> 10 are often siderably lower than 4. When the Q<br />
experienced for e.g. masses placed value is 0,5 or smaller, the system<br />
on rubber isola<strong>to</strong>rs. Other isolating is said <strong>to</strong> be critically damped (see<br />
materials used in compression may Fig.15) i.e. after a forcing function<br />
provide Q fac<strong>to</strong>rs around 10 while has been discontinued the vibration<br />
many other mechanical engineering amplitude will die out without any<br />
or civil engineering constructions oscillations. All systems with higher<br />
are found with Q values in the Q wilt oscillate at their resonance<br />
range from 10 <strong>to</strong> 25. However, for frequency for a shorter or longer peintegral<br />
metal constructions as for riod after excitation depending on<br />
example castings or parts cut or the O value.<br />
Fig.1 5.<br />
Critically damped impedance curve<br />
Phase relationships in mechanical impedance <strong>and</strong> mobility<br />
In the above sections the phases bility or the impedance as it is<br />
of the different impedances <strong>and</strong> mo- either + 90° or —90° correspondences<br />
have only been briefly men- ing <strong>to</strong> a positive slope (+ 1) or a netioned.<br />
However, it may be useful gative slope (—1) respectively of the<br />
<strong>to</strong> consider the phase relationships skele<strong>to</strong>n lines. The sudden shift of<br />
as they may prove important in slope by a positive or negative value<br />
some applications.<br />
of 2 at antiresonances <strong>and</strong> resonances<br />
corresponds <strong>to</strong> phase shifts of<br />
If the phase of the exciting force 180°.<br />
is taken as reference it is seen from<br />
the unity vec<strong>to</strong>r diagram Fig.1 6 that From this it can be concluded that<br />
the velocities of the mass, the the point impedances of Fig.11<br />
spring <strong>and</strong> the damper of Fig.1 re- have + 90° phase below the antiresspectively<br />
have —90°, + 90° <strong>and</strong> onance. —90° between the antires-<br />
0° phase shift (—j, + j, + 1). onance <strong>and</strong> the resonance <strong>and</strong><br />
again + 90° above the resonance.<br />
The transfer impedances of Fig. 12<br />
As the impedances <strong>and</strong> mobilities have + 90° phase below the resoare<br />
given by<br />
nance <strong>and</strong> —90° above the resonance<br />
as the slope of the curve<br />
2= F/v<strong>and</strong> M = v/F = 1/Z (15) changes by + 2. For point <strong>and</strong> transfer<br />
mobilities similar rules are valid<br />
their phases are found from<br />
Fig. 16. The phase relationships for single<br />
elements<br />
i.e. as the mobility curve is changed<br />
by inversion, the phase changes<br />
from positive <strong>to</strong> negative or vice<br />
versa.<br />
<strong>and</strong><br />
LZ = LF -LM (16}<br />
LM=Lv-L? = -LZ (17)<br />
As an example the angle of the<br />
impedance of the mass is (see<br />
Fig.17)<br />
Z_Z m =0°-(-90V + 90° (18)<br />
In all undamped cases it is very<br />
simple <strong>to</strong> find the phase of the mo-<br />
Fig.17.<br />
The phases of the impedances <strong>and</strong> mobilities of single elements<br />
10
In the damped case the phase series damper, which provides a Q<br />
does not change immediately but va- - 4 is therefore chosen <strong>to</strong> allow dines<br />
gradually between + 90° <strong>and</strong> rect addition of the three mobilities.<br />
—90° as the frequency is swept The response curve for the system<br />
over an antiresonance or reso- is given by Fig. 13a.<br />
nance, the direction of variation being<br />
dependent on which representa- It is seen that at 0,4fA the mobiltion<br />
is chosen. For the point imped- ity of the mass is the largest at<br />
ance <strong>and</strong> the point mobility the —90°. The +90° mobility is subphase<br />
is zero at the resonance <strong>and</strong> tracted from the mass mobility <strong>and</strong><br />
the antiresonance, whereby these the remaining —90° mobility is<br />
frequencies can be determined accu- added vec<strong>to</strong>riaily <strong>to</strong> the mobility of<br />
ra f ely by phase measurements even the damper (which is 0,25) <strong>to</strong> obfor<br />
highly damped structures.<br />
tain a resultant of app. 2 with a<br />
phase of —82,4°.<br />
The phase relationships are given<br />
by vec<strong>to</strong>r diagrams in Fig. 19 for an At the antiresonance the —90°<br />
antiresonant system (Fig.18) with Q <strong>and</strong> +90° mobilities of the mass<br />
- 4 at three frequencies. The sys- <strong>and</strong> the spring compensate each<br />
tern is equivalent <strong>to</strong> that of Fig.6 other exactly <strong>and</strong> the resulting<br />
with a damper added. As the damp- mobility is that of the damper at 0°<br />
ing is only evaluated around the an- phase. At 2,5fA the spring mobility<br />
tiresonance the most suitable dam- is the largest resulting in a positive<br />
per configuration can be chosen. A phase angle of 82,4°.<br />
Fig.18.<br />
Damped iintiresonant system<br />
For transfer impedances the<br />
phase angle may turn several times<br />
through 360° depending on the<br />
complexity of the system. The direction<br />
would be positive for positive<br />
changes in slope <strong>and</strong> negative for<br />
negative changes in slop*; (a change<br />
in slope of 2 being equal <strong>to</strong> a phase<br />
change of 180'- <strong>and</strong> a change in<br />
slope of 1 being equal <strong>to</strong> 90° phase<br />
change).<br />
F*9.19.<br />
The phase relationships around the antiresonance of Fig.13a. See also Fig.18 for the mathematical model<br />
Practical considerations in the measurement <strong>and</strong><br />
evaluation of mechanical impedance, mobility,<br />
<strong>and</strong> other ratios of force <strong>and</strong> motion<br />
To measure mechanical imped- In Fig.20 is shown an example of The arrangement was first used in<br />
ance it is necessary <strong>to</strong> have a force a measurement arrangement which the measurement of sttftness of assource,<br />
force <strong>and</strong> motion transdu- provides the various functions phait bars <strong>to</strong> provide he complex<br />
cers as well as analysing <strong>and</strong> re- which may be needed for most im- modulus of asphalt at frequencies<br />
cording equipment pedance or mobility measurements. below the first bending resonance<br />
(Ref.4).<br />
11
Fig.20.<br />
Measurement arrangement for mechanical impedance measurements<br />
This particular application de- any other of the ratios mentioned in tion configurations from economical<br />
m<strong>and</strong>ed that the test specimen was Table 1. or technical reasons <strong>and</strong> it may be<br />
excited with a constant displace- Although the set-up shown may useful <strong>to</strong> examine each function of<br />
ment over the frequency range in be used for a great number of appli- the system <strong>to</strong> find the dem<strong>and</strong>s <strong>and</strong>,<br />
question. However, the measure- cations it may sometimes be an ad- thereby make the correct choice of<br />
ment arrangement is suitable for vantage <strong>to</strong> use other instrumenta- instrumentation.<br />
The Vibration Exciter <strong>and</strong> the Power Amplifier<br />
The Vibration Exciter <strong>and</strong> the<br />
Power Amplifier should be considered<br />
as an inseparable pair. In certain<br />
circumstances, naturally, a<br />
larger Power Amplifier may be<br />
chosen <strong>to</strong> drive two or more Vibration<br />
Exciters in series or parallel<br />
from the same amplifier, or a Vibration<br />
Exciter may be driven by an inferior<br />
amplifier for non-dem<strong>and</strong>ing<br />
purposes. However, in most cases<br />
the Power Amplifier should be<br />
chosen according <strong>to</strong> the vibration exciter<br />
for example as given in Table 2<br />
which shows the present range of<br />
Briiei & Kjaer Vibration Exciters.<br />
Vibration<br />
Exctier No.<br />
4801<br />
4802<br />
4803<br />
4809<br />
4810<br />
Force<br />
Npeak<br />
380- 445<br />
1450- 1780<br />
5340 - 6670<br />
44.5<br />
7<br />
I<br />
Stroke<br />
12,7 -25,4<br />
19 -38<br />
27,9 - 55,9<br />
8<br />
6<br />
Velocity<br />
m/s peak<br />
1,01 -1,27<br />
1,27<br />
1,27<br />
1,65<br />
Max. Frequency<br />
kHz<br />
5,4 -10<br />
4,5- 5,5<br />
2,9- 3,5<br />
20<br />
18<br />
Power<br />
Amplifier No.<br />
j Table 2. Specifications lecifications for Vibration Exciters Excit< 3rs <strong>and</strong> Power Amplifiers<br />
073040<br />
The limiting parameter for the desired is the more important pail<br />
choice of Vibration Exciter is nor- rameter, <strong>and</strong> the interchangeability<br />
3 mally the max. force required. This of Exciter Heads of the 4801, 4802<br />
B is also the parameter of highest eco- <strong>and</strong> 4803 family may provide the<br />
nomic importance as it puts re- optimal solution of large stroke or<br />
2 quirements on both the Vibration Ex- max. force applied <strong>to</strong> the payload<br />
f citer <strong>and</strong> the Power Amplifier. How- for any given size of Vibration Exciever,<br />
in some cases the max. stroke ter (See Ref.5).<br />
2707<br />
2708<br />
2709<br />
2706<br />
2706<br />
Power<br />
VA<br />
120<br />
1200<br />
6000<br />
75<br />
75<br />
073040<br />
The force <strong>and</strong> motion transducers<br />
The dem<strong>and</strong> <strong>to</strong> the force transdu- 1 kg mass the <strong>Impedance</strong> Head Unit Type 5565 may be directly incer<br />
is that it provides a true force Type 8101 proves very useful as it terconnected <strong>to</strong> compensate for the<br />
signal <strong>to</strong> the preamplifiers in the combines a Force Transducer <strong>and</strong> 1 gramme mass below the active<br />
force range required. For applica- an accelerometer with a relative po- elements of the Force Transducer if<br />
tions on very light structures below larity so that a Mass Compensation needed.<br />
12
" i<br />
I Type No. I B200 6200 j 8201<br />
[ most any type of Bruei & Kjaer accel- Although at! the accelerometers<br />
I<br />
Max Tensile icoo 1C00 M N 4coo 4C0O N<br />
erometer may be used although the mentioned may be used down <strong>to</strong><br />
j . .<br />
"M^~C7^. Max. Compr. |~ 5C00 SCOVN N j ZO.CSON 20.C30 N " ran 9e of Uni-Gain® types are pre- 1 Hz extra care should be executed<br />
ferred<br />
~chl^7sl^r~ Charge Sens. A AJCV pC N ] I 4 P pC CNN<br />
(charge sensitivity = below app. 5 Hz especially at <strong>to</strong>w<br />
_ ^J- - ^ -. *—<br />
~te^^H^~T^z ' ^T'<br />
1 P c/ms ~ 2 or 10pC/ms- 2 L<br />
Resonant Freq. .<br />
Types signal levels. This is due <strong>to</strong> the fact<br />
(5gload> J35 kHz 20 kHz<br />
g load)<br />
j , 4371, 4370 respectively, <strong>and</strong> vol- that most piezoelectric transducers<br />
Mstenal Material<br />
Stainless<br />
stainless steel<br />
Stee<br />
tage sensj t j v j tv 1 mV/ms ~~ 2 Type are sensitive <strong>to</strong> temperature tran-<br />
Height<br />
1 —* ' * " " ""<br />
13 mm 36 8 mm<br />
He| 9 ht I 13mm I 568mm I 8301). sients which may be induced in<br />
*<br />
Table3. Specifications for Force Transducers<br />
HJ "<br />
t h e<br />
accelerometers by Slight<br />
For application on very light struc- movements in the room where<br />
For structures larger than app. tures, for very high levels of vibra- measurements are taking place. To<br />
1 kg mass Force Transducers Types tion <strong>and</strong> for high frequencies the reduce this effect the accelerometers<br />
8200 or 8201 should be used ac- range of Miniature Accelerometers may be covered by insulating matecording<br />
<strong>to</strong> the force dem<strong>and</strong>s (see Types 4344, 8307, or 8309 may rial or alternatively the above-men-<br />
Table 3 <strong>and</strong> Ref.6). be used <strong>to</strong> avoid loading the speci- tioned Type 8306 or Quartz Accefermen<br />
<strong>and</strong> <strong>to</strong> ensure correct measure- ometer Type 8305 may be used.<br />
The motion is normally best ments.<br />
measured by an Accelerometer. The Quartz Accelerometer may be<br />
This is due <strong>to</strong> the large dynamic For applications with low signal ie- used down <strong>to</strong> virtually DC becaus<br />
range, the large frequency range, vels Type 8306 which has a sensi- of the stability of the quartz crystal.<br />
<strong>and</strong> the reliability provided by these tivity of 1 V/ms ~~ 2 may be used. It may be screwed <strong>to</strong> the Force<br />
transducers. However, some consid- The latter accelerometer also pro- Transducer Type 8200 <strong>to</strong> form an<br />
eration should be given <strong>to</strong> the vides stable operation down <strong>to</strong> <strong>Impedance</strong> Head if so desired.<br />
choice of accelerometer type. For 0,3 Hz.<br />
most non-dem<strong>and</strong>ing purposes at-<br />
air<br />
Preamplifiers<br />
As Accelerometers <strong>and</strong> Force sitivity due <strong>to</strong> different cable For accelerometers with other sensi-<br />
Transducers have very high electri- lengths. tivities <strong>and</strong> Force Transducers,<br />
cal output impedances, a preampii- preamplifiers Types 2626, 2628<br />
fier must be inserted after each Type 2634 is a small unit only <strong>and</strong> 2650 provide both accurate<br />
transducer in order <strong>to</strong> provide a high 21 mm * 34,5 mm * 100 mm sensitivity adjustment <strong>and</strong> adjusinput<br />
impedance <strong>to</strong> the transducer which can be placed near the mea- table gain. Type 2650 has 4 digit<br />
signal <strong>and</strong> a low output impedance suring point, <strong>and</strong> which is operated adjustment compared <strong>to</strong> 3 digits for<br />
<strong>to</strong> the fofiowing electronic instru- from an external 28 V source. The the other two, <strong>and</strong> Type 2628 proments.<br />
Thereby low frequency <strong>and</strong> Type 2651 is especially intended vides very low frequency operation<br />
low noise operation is made possi- for use with Uni-Gain®charge cali- <strong>to</strong> 10 Hz.<br />
bie. brated accelerometers such as<br />
Types 4371 <strong>and</strong> 4370, <strong>and</strong> gives In addition, both Type 2626 <strong>and</strong><br />
Charge preamplifiers au<strong>to</strong>mati- then a calibrated output propor- Type 2628 provide adjustable low<br />
cally compensate for change in sen- tiona! <strong>to</strong> acceleration or velocity. pass <strong>and</strong> high pass filtering of the<br />
signal.<br />
Exciter Control<br />
The Exciter Control Type 1047 or displacement over the frequency the specimen in question. The most<br />
contains a fully electronically con- range. It has no built-in filters but obvious ones would be the Heterotrolled<br />
oscilla<strong>to</strong>r section <strong>to</strong> drive the controls external fitters <strong>and</strong> record- dyne Analyzer Type 2010 or per-<br />
Power Amplifier in the frequency ing devices. haps the Sine R<strong>and</strong>om Genera<strong>to</strong>r<br />
range from 5 Hz <strong>to</strong> 10 kHz. It con-<br />
Type 1027. The former in addition<br />
tains one measurement <strong>and</strong> control Similarly a number of other instru- gives excellent frequency analysis<br />
channel, allowing two preset con- ments may be used <strong>to</strong> obtain a con- capability from 2 Hz <strong>to</strong> 200 kHz.<br />
trol values of acceleration, velocity trolled force or vibration level on<br />
13
Recording Device<br />
The Level Recorders Types 2306<br />
or 2307 may be used with precalibrated<br />
recording paper as shown in<br />
Figs.21 <strong>and</strong> 22. Recording papers<br />
can have a 50 mm, or a 100 mm<br />
ordinate (2307 only} which can be<br />
used for logarithmic scales of 10,<br />
25, 50 or 75 dB according <strong>to</strong> the<br />
Recorder Potentiometer used (50dB<br />
being the most usual) or for a linear<br />
scale (Potentiometer ZR 0002 for<br />
2307) which must be used for<br />
phase recordings. The frequency<br />
scale of Fig.21 has a decade length<br />
of 50 mm which provides the possibility<br />
of drawing the skele<strong>to</strong>ns as described<br />
in the theoretical section.<br />
(The slopes being ±20dB for 1 decade<br />
or multiples of that).<br />
h Fig.21. Recording paper with precalibrated frequency scate <strong>and</strong> an ordinate calibrated in dB<br />
To obtain better accuracy with<br />
closely spaced resonances or antiresonances<br />
the recordings can also<br />
be made with an enlarged frequency<br />
scale (either logarithmic or<br />
linear). For the latter a redrawing<br />
must be made <strong>to</strong> have log-log representation<br />
for final evaluation.<br />
Similarly X-Y recorders may be<br />
used for recording of the graphs provided<br />
either the recorder output<br />
used (Heterodyne Analyzer Type<br />
2010 or Measuring Amplifier Type<br />
2607) has a logarithmic output, or<br />
the X-Y recorder has a logarithmic<br />
preamplifier.<br />
Fig.22.<br />
Recording paper with calibrated ordinate<br />
If acceleration or displacement is<br />
measured or used for control instead<br />
of velocity the graph can be<br />
recalibrated <strong>to</strong> mobility or impedance<br />
by drawing a reference line on<br />
the log-log graph <strong>and</strong> reading the<br />
values above this line for each frequency.<br />
See Fig.23.<br />
Fig.23.<br />
Conversion of recorded curves <strong>to</strong> mobility <strong>and</strong> impedance curves<br />
14
Fig.24<br />
Nomograph of the relations of sinusoidal acceleration, velocity <strong>and</strong> displacement as functions of frequency<br />
15
As acceleration for sinusoidal vi- impedance lines are given with posi- the above relationship or from the<br />
bration a = jwv the velocity is re- tive slope 20dB/decade in Fig.23b. graph in Fig.24.<br />
duced for increasing frequency <strong>and</strong><br />
lines with negative slope The curves are drawn through When displacement has been<br />
20dB/decade would represent con- points at one frequency for which measured the calibration is carried<br />
stant mobility lines in the represen- the mobility or impedance respec- out in a similar way but with oppotation<br />
of Fig.23a. Similarly constant tively have been determined from site signs for the slopes.<br />
Phase measurements<br />
The phase is best measured by tion between their resonances or acceleration or velocity at a given<br />
means of a phase meter. For many antiresonances, it proves very use- point may be the result of contribupurposes<br />
however, phase moni<strong>to</strong>r- ful <strong>to</strong> know the phases of the sys- tions from transla<strong>to</strong>ry motion <strong>and</strong><br />
ing may be sufficiently well carried tern responses. When the reson- one or two <strong>to</strong>rsional motions, <strong>and</strong><br />
out by means of an oscilloscope on ances or antiresonances of highly phase measurement with respect <strong>to</strong><br />
which either the beam is deflected damped systems must be measured force or <strong>to</strong> other points may be necin<br />
the X <strong>and</strong> Y direction by the two accurately, phase indication is vital. essary <strong>to</strong> determine the mutual insignals<br />
in question, or where one When the damping of a system fluence of these vibration modes.<br />
signal is displayed below the other. must be determined outside reson- Similarly in mode studies on sys-<br />
In many cases, however the need ance accurate phase measurement terns with varying stiffness the<br />
for phase measurements does not by a phase meter is absolutely ne- wavelength of vibration at a given<br />
arise. From good recordings of point cessary. frequency may vary considerably<br />
impedances <strong>and</strong> transfer imped- from one part of the system <strong>to</strong><br />
ances it is possible <strong>to</strong> evaluate the Under many other circumstances another <strong>and</strong> phase measurements<br />
response from the amplitude the phase measurements provide provide an extra control that all ancurves.<br />
However, when two sys- an extra check on the measure- tinodes <strong>and</strong> nodes have been detems<br />
are <strong>to</strong> be joined <strong>to</strong>gether <strong>and</strong> ments. For example in measure- tected.<br />
there is no large frequency separa- ment on complicated systems, the<br />
Examples of Application<br />
In Fig.25 is shown an arrangement<br />
which was used <strong>to</strong> determine<br />
the point impedances of the surface<br />
of a hermetically sealed container<br />
for a refrigera<strong>to</strong>r compressor<br />
(Fig.26). The purpose of the investigation<br />
was <strong>to</strong> find the optimal<br />
points <strong>to</strong> secure the springs in<br />
which the compressor was <strong>to</strong> be suspended,<br />
in order <strong>to</strong> reduce the<br />
transmission of vibration <strong>to</strong> a minimum<br />
<strong>and</strong> thereby <strong>to</strong> minimize the<br />
sound emitted from the container.<br />
The measurements revealed that at<br />
most points the impedance curve<br />
showed numerous resonances <strong>and</strong><br />
antiresonances (see Fig27a) whereas<br />
four points had relatively high<br />
impedance <strong>and</strong> very small variations<br />
over the entire frequency<br />
"Y Fig.25. Measuring arrangement suitable <strong>to</strong> determine the point impedance at various points of<br />
range (Fig.27b).<br />
the surface of a steel container for a refrigera<strong>to</strong>r compressor<br />
16
Fig.26.<br />
Cross-section of a refrigera<strong>to</strong>r compressor<br />
suspended in a hermetically<br />
sealed container<br />
These nodal points would give<br />
minimum transmission of vibration<br />
energy when combined with the<br />
low impedance of the springs <strong>and</strong><br />
were, therefore, selected as fixing<br />
points. (There would be a high transfer<br />
impedance from the compressor<br />
<strong>to</strong> the point; compare with the system<br />
of Fig.6 <strong>and</strong> with the inverse of<br />
its mobility curve in Fig.7).<br />
Fig.28 shows a very similar system<br />
used for the determination of<br />
the modulus of elasticity of bars in<br />
longitudinal vibration. The bar is<br />
fixed on<strong>to</strong> the combination of a<br />
Force Transducer Type 8200 <strong>and</strong> a<br />
St<strong>and</strong>ard Quartz acceierometer<br />
Type 8305 <strong>and</strong> the point impedance<br />
curve is obtained (Fig. 2 9),<br />
From the exact frequencies of resonance<br />
or antiresonance <strong>and</strong> the form<br />
of the curve the modulus of elasticity<br />
<strong>and</strong> the damping coefficient can be<br />
obtained (see Ref.16). In Fig.30 the<br />
antiresonant peaks have been enlarged<br />
by using a reduced paper<br />
speed <strong>and</strong> a 10dB potentiometer.<br />
In Fig.31 is given an improved<br />
version of the instrumentation used<br />
for the measurements described in<br />
Ref .7. The measurements were<br />
taken <strong>to</strong> obtain knowledge about<br />
the response of a prefabricated<br />
building structure by means of mobility<br />
measurements. The acceleration<br />
signal is integrated by the Conditioning<br />
Amplifier Type 2635 <strong>and</strong><br />
led through the Tracking Filter Type<br />
5716 <strong>to</strong> exclude ambient vibration<br />
from nearby punch presses. The mobility<br />
recording obtained is shown in<br />
Fig.32.<br />
Further examples of applications<br />
are given in the Briiel & Kjaer Application<br />
Note No. 1 3—1 20 "Measurement<br />
of the Dynamic Properties of<br />
Materials <strong>and</strong> Structures" (Ref.8).<br />
fig.27.<br />
Point impedance recordings obtained from measurements on the steel container, a) as<br />
recorded at most points, b) as recorded in four points<br />
Fig.28. Measurement configuration for determination<br />
of the modulus of elasticity<br />
of a PVC bar by impedance<br />
measurements<br />
17
Concluding Remarks<br />
Measurement of the mechanical<br />
impedance, mobility or any other of<br />
the complex dynamic ratios given<br />
in Table 1 may provide useful knowledge<br />
about a structure. By comparison<br />
of the obtained recordings with<br />
lines for masslike or springlike response<br />
one will gain insight in<strong>to</strong> the<br />
dynamic characteristics of the structure<br />
<strong>to</strong> aid in further development or<br />
in corrective measures.<br />
Fig.29.<br />
The mechanical impedance recording obtained for a PVC bar<br />
The existing forces may be derived<br />
by comparison with e.g., the<br />
mobility plot, <strong>and</strong> the need for correction<br />
may often be directly decided<br />
upon, by frequency analysis<br />
of signals generated during operation.<br />
Fig.30.<br />
Extended recordings of the antiresonant peaks of Fig.29<br />
in more complicated applications<br />
the measurements may be used <strong>to</strong><br />
find the elements of a mode!. Then<br />
comparison between calculated values<br />
for the model <strong>and</strong> measurement<br />
results may be used for correcting<br />
the parameters of the model until<br />
sufficient accuracy is obtained.<br />
Similarly comparisons with frequency<br />
analyses may be used <strong>to</strong> calculate<br />
all relevant forces or couples<br />
in the system.<br />
In other cases the response of<br />
subsystems may be measured <strong>and</strong><br />
the properties of the <strong>to</strong>tal system be<br />
calculated before final assembly (See<br />
Ref. 12).<br />
Fig.31.<br />
Measurement arrangement for measurement of the mobility of a concrete beam<br />
Fig.32.<br />
Mobility recording obtained for a concrete beam<br />
18
References<br />
1. USAS S2.6-1 963, "Specifying 8. H. P. Olesen, "Measurement of 13. N. F. Hunter et a!., "The measthe<br />
<strong>Mechanical</strong> impedance of the Dynamic Properties of Mate- urement of <strong>Mechanical</strong> Imped-<br />
Structures" rials <strong>and</strong> Structures" Bruel & ance <strong>and</strong> its use in Vibration<br />
Kjaer Application Note No. Testing". U.S. Nav. Res. Lab. r<br />
2.J.-P. Salter, "Steady State Vi- 17—180 Shock Vib. Bull. 42, Pt. 1, Jan.<br />
oration". Kenneth Mason 1969<br />
1972, P.55—69<br />
9. C. M. Harris <strong>and</strong> C. E. Crede,<br />
3. Jens Trampe Broch, "Mechani- "Shock <strong>and</strong> Vibration H<strong>and</strong>- 14. E. F. Ludwig et al., "Measurecal<br />
Vibration <strong>and</strong> Shock Meas- book". McGraw-HiiM 961 ment <strong>and</strong> Application of Meurements"<br />
Bruel & Kjaer, 1972<br />
chanicai <strong>Impedance</strong>". U.S. Nav.<br />
10. D. J. Ewins, "Some whys <strong>and</strong> Res. Lab., Shock Vib. Bull. 42<br />
4. K. Zaveri <strong>and</strong> H. P. Olesen, wherefores of impedance test- Pt. 1, Jan. 1 972 P. 43—45<br />
"Measurement of Elastic Modu- ing". See Dynamic Testing Symlus<br />
<strong>and</strong> Loss Fac<strong>to</strong>r of Asphalt". posium, Jan. 5—6, 71, London 15. M. E. Szendrei et al,, "Road Re-<br />
Bruet & Kjaer Technical Review sponses <strong>to</strong> Vibration Tests".<br />
No. 4-1972 1 1. R. B. R<strong>and</strong>all, "High Speed Nar- Journal of the Soil Mechanics<br />
row B<strong>and</strong> Analysis using the <strong>and</strong> Foundation Division, No-<br />
5 Gait Booth, "Interchangeable Digital Event Recorder Type vember, 1970<br />
Head Vibration Exciters" Bruel & 7502", Bruel & Kjaer Technical<br />
Kjaar Technical Review No.2- Review No. 2, 1 973 1 6. Measurement of the Complex<br />
1971 Modulus of Elasticity: A Brief<br />
12. A. L. Kiosterman, "A combined Survey. Bruel & Kjaer Applica-<br />
6. Willy Braender, "High Frequency Experimental <strong>and</strong> Analytical tion Note No. 17—051<br />
<strong>Respons</strong>e of Force Transdu- Procedure for Improving Au<strong>to</strong>cers".<br />
Briiei & Kjaer Technical motive System Dynamics". SAE, 17. R. B. R<strong>and</strong>all, "Frequency Ana-<br />
Review No. 3-1972 Au<strong>to</strong>motive Engineering Con- lysis" Briiel & Kjaer, 1977<br />
gress, Detroit Mich., January<br />
7.Torben Licht, "Measurement of 10—14, 1972<br />
Low Level Vibrations in Buildings"<br />
Bruel & Kjasr Technical<br />
Review No. 3-1972<br />
19