

US-Listed ETFs Sorted by Asset Class and Year-to-Date Return
US-Listed ETFs Sorted by Asset Class and Year-to-Date Return
US-Listed ETFs Sorted by Asset Class and Year-to-Date Return

Create successful ePaper yourself
Turn your PDF publications into a flip-book with our unique Google optimized e-Paper software.
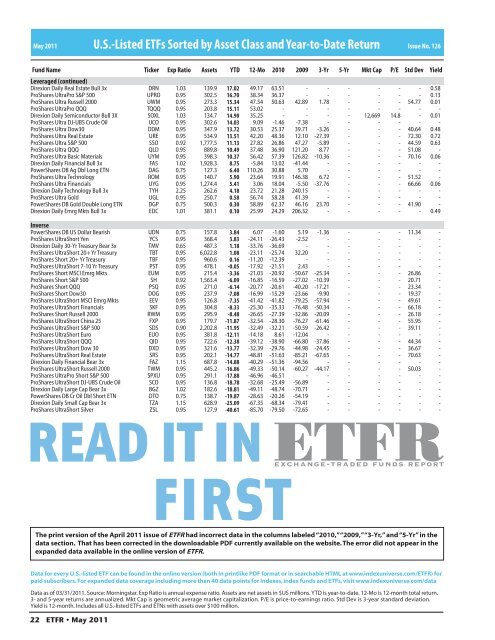
May 2011 U.S.-<strong>Listed</strong> <strong>ETFs</strong> <strong>Sorted</strong> <strong>by</strong> <strong>Asset</strong> <strong>Class</strong> <strong>and</strong> <strong>Year</strong>-<strong>to</strong>-<strong>Date</strong> <strong>Return</strong><br />
Issue No. 126<br />
Fund Name Ticker Exp Ratio <strong>Asset</strong>s YTD 12-Mo 2010 2009 3-Yr 5-Yr Mkt Cap P/E Std Dev<br />
Leveraged (continued)<br />
Direxion Daily Real Estate Bull 3x DRN 1.03 139.9 17.02 49.17 63.51 - - - - - - 0.58<br />
ProShares UltraPro S&P 500 UPRO 0.95 302.5 16.70 38.34 36.37 - - - - - - 0.13<br />
ProShares Ultra Russell 2000 UWM 0.95 273.3 15.34 47.54 50.63 42.89 1.78 - - - 54.77 0.01<br />
ProShares UltraPro QQQ TQQQ 0.95 203.8 15.11 53.02 - - - - - - - -<br />
Direxion Daily Semiconduc<strong>to</strong>r Bull 3X SOXL 1.03 134.7 14.90 35.25 - - - - 12,669 14.8 - 0.01<br />
ProShares Ultra DJ-UBS Crude Oil UCO 0.95 302.6 14.03 9.09 -1.46 -7.38 - - - - - -<br />
ProShares Ultra Dow30 DDM 0.95 347.9 13.72 30.53 25.37 39.71 -3.26 - - - 40.64 0.48<br />
ProShares Ultra Real Estate URE 0.95 534.9 13.51 42.20 48.36 12.10 -27.39 - - - 72.30 0.72<br />
ProShares Ultra S&P 500 SSO 0.92 1,777.5 11.13 27.82 26.86 47.27 -5.89 - - - 44.59 0.63<br />
ProShares Ultra QQQ QLD 0.95 889.8 10.49 37.48 36.90 121.20 8.77 - - - 51.08 -<br />
ProShares Ultra Basic Materials UYM 0.95 398.3 10.37 56.42 57.39 126.82 -10.36 - - - 70.16 0.06<br />
Direxion Daily Financial Bull 3x FAS 1.02 1,928.3 8.75 -5.84 13.02 -41.44 - - - - - -<br />
PowerShares DB Ag Dbl Long ETN DAG 0.75 127.3 6.40 110.26 30.88 5.70 - - - - - -<br />
ProShares Ultra Technology ROM 0.95 140.7 5.90 23.64 19.91 146.38 6.72 - - - 51.52 -<br />
ProShares Ultra Financials UYG 0.95 1,274.4 5.41 3.06 18.04 -5.50 -37.76 - - - 66.66 0.06<br />
Direxion Daily Technology Bull 3x TYH 2.25 262.6 4.18 23.72 21.28 240.15 - - - - - -<br />
ProShares Ultra Gold UGL 0.95 250.7 0.58 56.74 58.28 41.39 - - - - - -<br />
PowerShares DB Gold Double Long ETN DGP 0.75 500.3 0.30 58.89 62.37 46.16 23.70 - - - 41.90 -<br />
Direxion Daily Emrg Mkts Bull 3x EDC 1.01 381.1 0.10 25.99 24.29 206.32 - - - - - 0.49<br />
Yield<br />
Inverse<br />
PowerShares DB <strong>US</strong> Dollar Bearish UDN 0.75 157.8 3.84 6.07 -1.60 5.19 -1.36 - - - 11.34 -<br />
ProShares UltraShort Yen YCS 0.95 368.4 3.83 -24.11 -26.43 -2.52 - - - - - -<br />
Direxion Daily 30-Yr Treasury Bear 3x TMV 0.65 487.3 1.18 -33.76 -36.69 - - - - - - -<br />
ProShares UltraShort 20+ Yr Treasury TBT 0.95 6,022.8 1.08 -23.11 -25.74 32.20 - - - - - -<br />
ProShares Short 20+ Yr Treasury TBF 0.95 960.6 0.16 -11.20 -12.39 - - - - - - -<br />
ProShares UltraShort 7-10 Yr Treasury PST 0.95 478.1 -0.05 -17.92 -21.51 2.43 - - - - - -<br />
ProShares Short MSCI Emrg Mkts EUM 0.95 215.4 -3.36 -21.03 -20.92 -50.67 -25.34 - - - 26.86 -<br />
ProShares Short S&P 500 SH 0.92 1,563.4 -6.09 -16.85 -16.59 -27.02 -10.39 - - - 20.71 -<br />
ProShares Short QQQ PSQ 0.95 271.0 -6.14 -20.77 -20.61 -40.20 -17.21 - - - 23.34 -<br />
ProShares Short Dow30 DOG 0.95 237.9 -7.08 -16.99 -15.29 -23.66 -9.90 - - - 19.37 -<br />
ProShares UltraShort MSCI Emrg Mkts EEV 0.95 126.8 -7.35 -41.42 -41.82 -79.25 -57.94 - - - 49.61 -<br />
ProShares UltraShort Financials SKF 0.95 304.8 -8.33 -25.30 -35.33 -76.48 -50.34 - - - 66.18 -<br />
ProShares Short Russell 2000 RWM 0.95 295.9 -8.48 -26.65 -27.39 -32.86 -20.09 - - - 26.18 -<br />
ProShares UltraShort China 25 FXP 0.95 179.7 -11.87 -32.54 -28.30 -76.27 -61.46 - - - 55.95 -<br />
ProShares UltraShort S&P 500 SDS 0.90 2,202.8 -11.95 -32.49 -32.21 -50.59 -26.42 - - - 39.11 -<br />
ProShares UltraShort Euro EUO 0.95 381.8 -12.11 -14.18 8.61 -12.04 - - - - - -<br />
ProShares UltraShort QQQ QID 0.95 722.6 -12.38 -39.12 -38.90 -66.80 -37.86 - - - 44.34 -<br />
ProShares UltraShort Dow 30 DXD 0.95 321.6 -13.77 -32.39 -29.76 -44.98 -24.45 - - - 36.67 -<br />
ProShares UltraShort Real Estate SRS 0.95 202.1 -14.77 -48.81 -51.63 -85.21 -67.65 - - - 70.63 -<br />
Direxion Daily Financial Bear 3x FAZ 1.15 687.8 -14.88 -40.29 -51.36 -94.56 - - - - - -<br />
ProShares UltraShort Russell 2000 TWM 0.95 445.2 -16.86 -49.33 -50.14 -60.27 -44.17 - - - 50.03 -<br />
ProShares UltraPro Short S&P 500 SPXU 0.95 291.1 -17.88 -46.96 -46.51 - - - - - - -<br />
ProShares UltraShort DJ-UBS Crude Oil SCO 0.95 136.8 -18.78 -32.68 -25.49 -56.89 - - - - - -<br />
Direxion Daily Large Cap Bear 3x BGZ 1.02 182.6 -18.81 -49.11 -48.74 -70.71 - - - - - -<br />
PowerShares DB Cr Oil Dbl Short ETN DTO 0.75 138.7 -19.87 -28.63 -20.26 -54.19 - - - - - -<br />
Direxion Daily Small Cap Bear 3x TZA 1.15 628.9 -25.09 -67.35 -68.34 -79.41 - - - - - -<br />
ProShares UltraShort Silver ZSL 0.95 127.9 -40.61 -85.70 -79.50 -72.65 - - - - - -<br />
READ IT IN<br />
FIRST ETFR<br />
The print version of the April 2011 issue of ETFR had incorrect data in the columns labeled “2010,” “2009,” “3-Yr,” <strong>and</strong> “5-Yr” in the<br />
data section. That has been corrected in the downloadable PDF currently available on the website. The error did not appear in the<br />
exp<strong>and</strong>ed data available in the online version of ETFR.<br />
Data for every U.S.-listed ETF can be found in the online version (both in printlike PDF format or in searchable HTML at www.indexuniverse.com/ETFR) for<br />
paid subscribers. For exp<strong>and</strong>ed data coverage including more than 40 data points for indexes, index funds <strong>and</strong> <strong>ETFs</strong>, visit www.indexuniverse.com/data<br />
Data as of 03/31/2011. Source: Morningstar. Exp Ratio is annual expense ratio. <strong>Asset</strong>s are net assets in $<strong>US</strong> millions. YTD is year-<strong>to</strong>-date. 12-Mo is 12-month <strong>to</strong>tal return.<br />
3- <strong>and</strong> 5-year returns are annualized. Mkt Cap is geometric average market capitalization. P/E is price-<strong>to</strong>-earnings ratio. Std Dev is 3-year st<strong>and</strong>ard deviation.<br />
Yield is 12-month. Includes all U.S.-listed <strong>ETFs</strong> <strong>and</strong> ETNs with assets over $100 million.<br />
22 ETFR • May 2011


