

US-Listed ETFs Sorted by Asset Class and Year-to-Date Return
US-Listed ETFs Sorted by Asset Class and Year-to-Date Return
US-Listed ETFs Sorted by Asset Class and Year-to-Date Return

You also want an ePaper? Increase the reach of your titles
YUMPU automatically turns print PDFs into web optimized ePapers that Google loves.
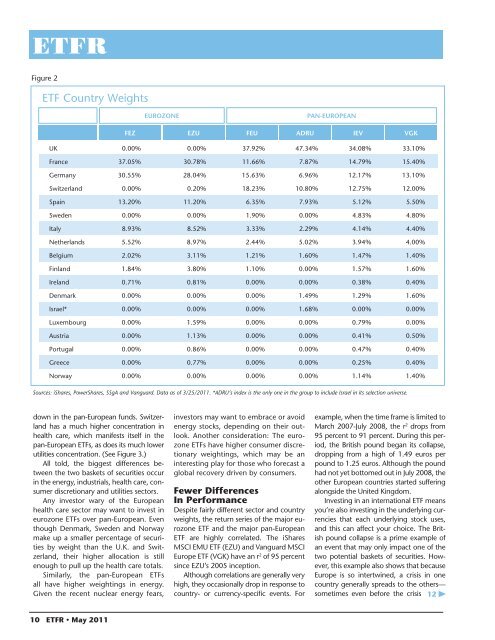
Figure 2<br />
ETF Country Weights<br />
EUROZONE<br />
PAN-EUROPEAN<br />
FEZ EZU FEU ADRU IEV VGK<br />
UK 0.00% 0.00% 37.92% 47.34% 34.08% 33.10%<br />
France 37.05% 30.78% 11.66% 7.87% 14.79% 15.40%<br />
Germany 30.55% 28.04% 15.63% 6.96% 12.17% 13.10%<br />
Switzerl<strong>and</strong> 0.00% 0.20% 18.23% 10.80% 12.75% 12.00%<br />
Spain 13.20% 11.20% 6.35% 7.93% 5.12% 5.50%<br />
Sweden 0.00% 0.00% 1.90% 0.00% 4.83% 4.80%<br />
Italy 8.93% 8.52% 3.33% 2.29% 4.14% 4.40%<br />
Netherl<strong>and</strong>s 5.52% 8.97% 2.44% 5.02% 3.94% 4.00%<br />
Belgium 2.02% 3.11% 1.21% 1.60% 1.47% 1.40%<br />
Finl<strong>and</strong> 1.84% 3.80% 1.10% 0.00% 1.57% 1.60%<br />
Irel<strong>and</strong> 0.71% 0.81% 0.00% 0.00% 0.38% 0.40%<br />
Denmark 0.00% 0.00% 0.00% 1.49% 1.29% 1.60%<br />
Israel* 0.00% 0.00% 0.00% 1.68% 0.00% 0.00%<br />
Luxembourg 0.00% 1.59% 0.00% 0.00% 0.79% 0.00%<br />
Austria 0.00% 1.13% 0.00% 0.00% 0.41% 0.50%<br />
Portugal 0.00% 0.86% 0.00% 0.00% 0.47% 0.40%<br />
Greece 0.00% 0.77% 0.00% 0.00% 0.25% 0.40%<br />
Norway 0.00% 0.00% 0.00% 0.00% 1.14% 1.40%<br />
Sources: iShares, PowerShares, SSgA <strong>and</strong> Vanguard. Data as of 3/25/2011. *ADRU’s index is the only one in the group <strong>to</strong> include Israel in its selection universe.<br />
down in the pan-European funds. Switzerl<strong>and</strong><br />
has a much higher concentration in<br />
health care, which manifests itself in the<br />
pan-European <strong>ETFs</strong>, as does its much lower<br />
utilities concentration. (See Figure 3.)<br />
All <strong>to</strong>ld, the biggest differences between<br />
the two baskets of securities occur<br />
in the energy, industrials, health care, consumer<br />
discretionary <strong>and</strong> utilities sec<strong>to</strong>rs.<br />
Any inves<strong>to</strong>r wary of the European<br />
health care sec<strong>to</strong>r may want <strong>to</strong> invest in<br />
eurozone <strong>ETFs</strong> over pan-European. Even<br />
though Denmark, Sweden <strong>and</strong> Norway<br />
make up a smaller percentage of securities<br />
<strong>by</strong> weight than the U.K. <strong>and</strong> Switzerl<strong>and</strong>,<br />
their higher allocation is still<br />
enough <strong>to</strong> pull up the health care <strong>to</strong>tals.<br />
Similarly, the pan-European <strong>ETFs</strong><br />
all have higher weightings in energy.<br />
Given the recent nuclear energy fears,<br />
inves<strong>to</strong>rs may want <strong>to</strong> embrace or avoid<br />
energy s<strong>to</strong>cks, depending on their outlook.<br />
Another consideration: The eurozone<br />
<strong>ETFs</strong> have higher consumer discretionary<br />
weightings, which may be an<br />
interesting play for those who forecast a<br />
global recovery driven <strong>by</strong> consumers.<br />
Fewer Differences<br />
In Performance<br />
Despite fairly different sec<strong>to</strong>r <strong>and</strong> country<br />
weights, the return series of the major eurozone<br />
ETF <strong>and</strong> the major pan-European<br />
ETF are highly correlated. The iShares<br />
MSCI EMU ETF (EZU) <strong>and</strong> Vanguard MSCI<br />
Europe ETF (VGK) have an r 2 of 95 percent<br />
since EZU’s 2005 inception.<br />
Although correlations are generally very<br />
high, they occasionally drop in response <strong>to</strong><br />
country- or currency-specific events. For<br />
example, when the time frame is limited <strong>to</strong><br />
March 2007-July 2008, the r 2 drops from<br />
95 percent <strong>to</strong> 91 percent. During this period,<br />
the British pound began its collapse,<br />
dropping from a high of 1.49 euros per<br />
pound <strong>to</strong> 1.25 euros. Although the pound<br />
had not yet bot<strong>to</strong>med out in July 2008, the<br />
other European countries started suffering<br />
alongside the United Kingdom.<br />
Investing in an international ETF means<br />
you’re also investing in the underlying currencies<br />
that each underlying s<strong>to</strong>ck uses,<br />
<strong>and</strong> this can affect your choice. The British<br />
pound collapse is a prime example of<br />
an event that may only impact one of the<br />
two potential baskets of securities. However,<br />
this example also shows that because<br />
Europe is so intertwined, a crisis in one<br />
country generally spreads <strong>to</strong> the others—<br />
sometimes even before the crisis 12<br />
10 ETFR • May 2011


