LANTEK User Manual - Ideal Industries
LANTEK User Manual - Ideal Industries
LANTEK User Manual - Ideal Industries

Create successful ePaper yourself
Turn your PDF publications into a flip-book with our unique Google optimized e-Paper software.
Chapter 3<br />
Structured Cable Field Calibration and Testing<br />
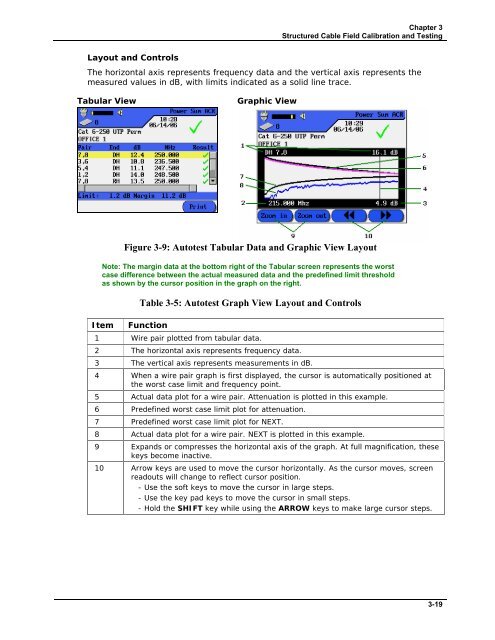
Layout and Controls<br />
The horizontal axis represents frequency data and the vertical axis represents the<br />
measured values in dB, with limits indicated as a solid line trace.<br />
Tabular View<br />
Graphic View<br />
Figure 3-9: Autotest Tabular Data and Graphic View Layout<br />
Note: The margin data at the bottom right of the Tabular screen represents the worst<br />
case difference between the actual measured data and the predefined limit threshold<br />
as shown by the cursor position in the graph on the right.<br />
Item<br />
Table 3-5: Autotest Graph View Layout and Controls<br />
Function<br />
1 Wire pair plotted from tabular data.<br />
2 The horizontal axis represents frequency data.<br />
3 The vertical axis represents measurements in dB.<br />
4 When a wire pair graph is first displayed, the cursor is automatically positioned at<br />
the worst case limit and frequency point.<br />
5 Actual data plot for a wire pair. Attenuation is plotted in this example.<br />
6 Predefined worst case limit plot for attenuation.<br />
7 Predefined worst case limit plot for NEXT.<br />
8 Actual data plot for a wire pair. NEXT is plotted in this example.<br />
9 Expands or compresses the horizontal axis of the graph. At full magnification, these<br />
keys become inactive.<br />
10 Arrow keys are used to move the cursor horizontally. As the cursor moves, screen<br />
readouts will change to reflect cursor position.<br />
- Use the soft keys to move the cursor in large steps.<br />
- Use the key pad keys to move the cursor in small steps.<br />
- Hold the SHIFT key while using the ARROW keys to make large cursor steps.<br />
3-19