LANTEK User Manual - Ideal Industries
LANTEK User Manual - Ideal Industries
LANTEK User Manual - Ideal Industries

You also want an ePaper? Increase the reach of your titles
YUMPU automatically turns print PDFs into web optimized ePapers that Google loves.
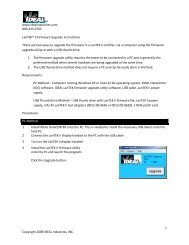
Chapter 3<br />
Structured Cable Field Calibration and Testing<br />
To view an Autotest graph:<br />
1. Configure the Autotest Preferences.<br />
2. In Autotest Preferences, make sure the Save Graphs checkbox is selected.<br />
3. Press AUTOTEST. Upon completion of the test suite for the cable type selected,<br />
the Overall Autotest results screen displays.<br />
4. To display tabular data, highlight the desired test result (the NEXT test) and press<br />
ENTER.<br />
5. To display a graph of the tabular data, highlight the tabular data of interest (pairs<br />
7, 8 and 3, 6) and press ENTER.<br />
6. The graph will always open with the cursor positioned on the worst case margin. In<br />
this example, the cursor is positioned on the horizontal axis at 215.00 MHz.<br />
7. Press ESCAPE to return to the previous screen.<br />
Figure 3-7: Typical Autotest Graphic Display<br />
Graph Formats, Layouts, and Controls<br />
Graphs are useful for observing the relationship between two network cable<br />
parameters, actual measured parameters and predefined worst case margins.<br />
There are two different graph formats: single and dual plot.<br />
Single Plot<br />
Dual Plot<br />
Figure 3-8: Single and Dual Plot Graphic Display<br />
3-18