LANTEK User Manual - Ideal Industries
LANTEK User Manual - Ideal Industries LANTEK User Manual - Ideal Industries
Chapter 6 Fiber Optics Diagnostics (TRACETEK) TRACETEK displays its measurement data in a graphical format similar to that of an ODTR, with the X-axis representing the distance from the handset and the Y-axis displaying the relative reflection (Return Loss) of each event. TRACETEK instantly displays the overall length to the end of the fiber and allows the operator to scroll a cursor to find the distance to any event on the screen. This functionality allows the operator to quickly measure overall fiber length, locate breaks in the fiber, locate individual reflective events, and check the relative reflection of events to identify defective connections. The TRACETEK display provides a “roadmap” of the fiber at a glance. The number at the bottom of the screen, marker 5, indicates the measured distance to the end of the fiber. As with an OTDR, TRACETEK does not require a piece of equipment or a person at the opposite end of the fiber under test. For this reason, TRACETEK cannot differentiate between the expected end of the fiber or a break in the cable. If there is a break in the cable this reading will tell you how far down to look for the break. ‣ Marker 1 indicates the first connector attached to your launch jumper. ‣ Marker 2 indicates the two connectors in the middle of the fiber under test. The height of the reflected pulse (called a Fresnel) indicates the relative reflection of each event. In the High-Resolution mode, a good connector should not go much above the halfway point on the display. In this example, the two connectors should be cleaned, and the first appears to be a bit worse than the second. ‣ Marker 3 is at the end of fiber. This reflection is expected to be quite large since it is at the end of the cable and represents a glass-to-air interface. Markers 1 and 6 indicate the user-moveable cursor and its position respectively. The cursor can be move by three methods: in very fine steps using the left and right arrow keys on the keypad, in medium size steps using the and soft-keys, or in large steps by holding the SHIFT button while pressing the LEFT/RIGHT ARROW keys on the keypad. In the figure above, the display shows a trace of the same fiber as before, but the two connectors in the middle were cleaned using the IDEAL Starter Cleaning Kit included with your TRACETEK module. It is clearly evident that a dirty connector, even one that appears clean to the naked eye, can cause significant return loss problems in the link. After being cleaned, both connectors are well below half scale and should present no problems with network operation. Cleaning connectors with any fiber-optic system is of utmost importance. Whenever there is any doubt about a test result, the first action is to clean the suspect connectors and retest the link. 6-6
Chapter 6 Fiber Optics Diagnostics (TRACETEK) There are many creative ways to clean connectors, and we’ve seen quite a few of these methods used in the field. It’s also common that test technicians do not take the time to visually inspect or clean connectors before testing the link. Some technicians will check for cleanliness with their naked eyes, but the human eye cannot possibly see the type of contaminants that affect fiber-optic connectors. Cleaning is a mundane but very important task. To illustrate this point, we have provided some magnified images of connectors cleaned with various methods. Dirty connector Wiped “clean” with finger “Cleaned” on shirt Cleaned w/IDEAL cleaning kit Again, using the same fiber, but before the connectors were cleaned, the figure above displays the results when the optimal TRACETEK resolution mode is not selected. In this case the Medium Resolution mode was used. The resulting Fresnels are much higher than before and the “Batman ears” are caused by the saturation of the receiver. This is due to excessive reflection. 6-7
- Page 54 and 55: Chapter 3 Structured Cable Field Ca
- Page 56 and 57: Chapter 3 Structured Cable Field Ca
- Page 58 and 59: Chapter 3 Structured Cable Field Ca
- Page 60 and 61: Chapter 3 Structured Cable Field Ca
- Page 62 and 63: Chapter 3 Structured Cable Field Ca
- Page 64 and 65: Chapter 3 Structured Cable Field Ca
- Page 66 and 67: Chapter 3 Structured Cable Field Ca
- Page 68 and 69: Chapter 3 Structured Cable Field Ca
- Page 70 and 71: Chapter 3 Structured Cable Field Ca
- Page 72 and 73: Chapter 3 Structured Cable Field Ca
- Page 74 and 75: Chapter 3 Structured Cable Field Ca
- Page 76 and 77: Chapter 3 Structured Cable Field Ca
- Page 78 and 79: Chapter 3 Structured Cable Field Ca
- Page 80 and 81: Chapter 3 Structured Cable Field Ca
- Page 82 and 83: CHAPTER 4 COAX CABLE FIELD CALIBRAT
- Page 84 and 85: Chapter 4 Coax Cable Field Calibrat
- Page 86 and 87: CHAPTER 5 FIBER OPTICS CABLE FIELD
- Page 88 and 89: Chapter 5 Fiber Optics Cable Field
- Page 90 and 91: Chapter 5 Fiber Optics Cable Field
- Page 92 and 93: Chapter 5 Fiber Optics Cable Field
- Page 94 and 95: Chapter 5 Fiber Optics Cable Field
- Page 96 and 97: Chapter 5 Fiber Optics Cable Field
- Page 98 and 99: Chapter 5 Fiber Optics Cable Field
- Page 100 and 101: Chapter 6 Fiber Optics Diagnostics
- Page 102 and 103: Chapter 6 Fiber Optics Diagnostics
- Page 106 and 107: Chapter 6 Fiber Optics Diagnostics
- Page 108 and 109: Chapter 6 Fiber Optics Diagnostics
- Page 110 and 111: Chapter 6 Fiber Optics Diagnostics
- Page 112 and 113: CHAPTER 7 LANTEK REPORTER SOFTWARE
- Page 114 and 115: Chapter 7 LANTEK REPORTER Software
- Page 116 and 117: Chapter 7 LANTEK REPORTER Software
- Page 118 and 119: Chapter 7 LANTEK REPORTER Software
- Page 120 and 121: Chapter 7 LANTEK REPORTER Software
- Page 122 and 123: Chapter 7 LANTEK REPORTER Software
- Page 124 and 125: Chapter 7 LANTEK REPORTER Software
- Page 126 and 127: Chapter 7 LANTEK REPORTER Software
- Page 128 and 129: Chapter 7 LANTEK REPORTER Software
- Page 130 and 131: Chapter 7 LANTEK REPORTER Software
- Page 132 and 133: Chapter 7 LANTEK REPORTER Software
- Page 134 and 135: Chapter 7 LANTEK REPORTER Software
- Page 136 and 137: Chapter 7 LANTEK REPORTER Software
- Page 138 and 139: Chapter 7 LANTEK REPORTER Software
- Page 140 and 141: APPENDIX A SAFETY PRECAUTIONS HANDL
- Page 142 and 143: APPENDIX B CUSTOMER SUPPORT CUSTOME
- Page 144 and 145: Appendix B Customer Support IDEAL I
- Page 146 and 147: Appendix C Fiber Optic Cabling Stan
Chapter 6<br />
Fiber Optics Diagnostics (TRACETEK)<br />
There are many creative ways to clean connectors, and we’ve seen quite a few of<br />
these methods used in the field. It’s also common that test technicians do not take the<br />
time to visually inspect or clean connectors before testing the link. Some technicians<br />
will check for cleanliness with their naked eyes, but the human eye cannot possibly<br />
see the type of contaminants that affect fiber-optic connectors. Cleaning is a mundane<br />
but very important task.<br />
To illustrate this point, we have provided some magnified images of connectors<br />
cleaned with various methods.<br />
Dirty<br />
connector<br />
Wiped<br />
“clean”<br />
with finger<br />
“Cleaned”<br />
on shirt<br />
Cleaned<br />
w/IDEAL<br />
cleaning kit<br />
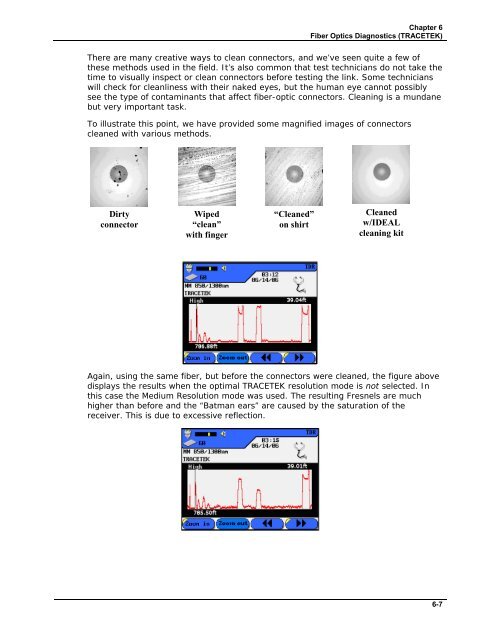
Again, using the same fiber, but before the connectors were cleaned, the figure above<br />
displays the results when the optimal TRACETEK resolution mode is not selected. In<br />
this case the Medium Resolution mode was used. The resulting Fresnels are much<br />
higher than before and the “Batman ears” are caused by the saturation of the<br />
receiver. This is due to excessive reflection.<br />
6-7


