Comprehensive Annual Financial Report - Harford County Public ...
Comprehensive Annual Financial Report - Harford County Public ...
Comprehensive Annual Financial Report - Harford County Public ...

You also want an ePaper? Increase the reach of your titles
YUMPU automatically turns print PDFs into web optimized ePapers that Google loves.
Table 5<br />
<strong>Harford</strong> <strong>County</strong> <strong>Public</strong> Schools<br />
Enrollment by School and Student to Teacher Ratio<br />
Last Ten Years at September 30,<br />
2002 2003 2004 2005 2006 2007 2008 2009 2010 2011 Capacity Capacity<br />
Abingdon Elementary 853 836 841 822 751 769 795 766 798 893 864 103.36%<br />
Bakersfield Elementary 506 510 507 463 447 463 477 457 444 366 500 73.20%<br />
Bel Air Elementary 577 525 533 524 505 487 512 508 505 488 500 97.60%<br />
Church Creek Elementary 730 733 754 778 755 736 743 774 781 699 793 88.15%<br />
Churchville Elementary 384 398 383 383 371 359 363 371 376 375 388 96.65%<br />
Darlington Elementary 123 141 137 139 130 126 125 123 123 124 192 64.58%<br />
Deerfield Elementary 639 687 670 584 569 545 520 514 633 797 816 97.67%<br />
Dublin Elementary 258 260 268 239 250 246 247 247 246 289 295 97.97%<br />
Edgewood Elementary 442 458 506 473 422 419 393 434 422 451 511 88.26%<br />
Emmorton Elementary 576 580 617 617 653 667 676 704 732 539 549 98.18%<br />
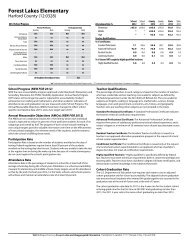
Forest Hill Elementary 536 580 603 579 585 575 564 579 550 557 581 95.87%<br />
Forest Lakes Elementary 684 675 679 714 707 695 664 682 681 511 546 93.59%<br />
Fountain Green Elementary 616 647 616 664 643 662 651 604 567 562 571 98.42%<br />
George D. Lisby Elementary at Hillsda 391 383 378 347 333 311 350 333 347 427 455 93.85%<br />
Halls Cross Roads Elementary 401 359 364 383 415 437 430 446 492 475 562 84.52%<br />
Havre de Grace Elementary 481 487 461 413 368 373 393 416 424 443 566 78.27%<br />
Hickory Elementary 693 693 667 696 664 693 702 687 720 653 655 99.69%<br />
Homestead-Wakefield Elementary 982 992 970 958 934 919 905 937 937 892 907 98.35%<br />
Jarrettsville Elementary 480 470 455 455 423 443 414 416 434 470 548 85.77%<br />
Joppatowne Elementary 593 564 567 581 522 515 546 548 581 667 653 102.14%<br />
Magnolia Elementary 589 566 574 515 512 526 536 563 466 385 518 74.32%<br />
Meadowvale Elementary 588 602 574 603 571 549 545 538 512 532 568 93.66%<br />
Norrisville Elementary 191 194 184 207 221 206 192 170 181 199 252 78.97%<br />
North Bend Elementary 500 481 470 449 428 399 402 389 401 377 500 75.40%<br />
North <strong>Harford</strong> Elementary 532 539 534 551 518 502 469 490 453 442 500 88.40%<br />
Prospect Mill Elementary 911 879 907 976 1,008 980 951 931 902 651 680 95.74%<br />
Red Pump Elementary - 596 696 85.63%<br />
Ring Factory Elementary 596 567 555 541 530 527 500 513 511 542 548 98.91%<br />
Riverside Elementary 544 564 559 554 568 547 504 502 523 501 522 95.98%<br />
Roye-Williams Elementary 620 563 641 577 546 493 426 440 388 440 683 64.42%<br />
William Paca/Old Post Road Elementa 1,055 1,033 1,026 1,052 1,044 1,010 1,020 1,005 845 663 954 69.50%<br />
William S. James Elementary 560 526 520 498 496 501 487 481 521 514 522 98.47%<br />
Youths Benefit Elementary 1,003 985 1,008 1,029 1,044 1,067 1,072 1,041 1,029 998 958 104.18%<br />
Total Elementary Schools 18,634 18,477 18,528 18,364 17,933 17,747 17,574 17,609 17,525 17,518 19,353 90.52%<br />
Aberdeen Middle 1,299 1,293 1,301 1,247 1,207 1,095 1,120 1,095 1,087 1,043 1,444 72.23%<br />
Bel Air Middle 1,429 1,461 1,402 1,434 1,403 1,244 1,249 1,267 1,291 1,296 1,318 98.33%<br />
Edgewood Middle 1,349 1,346 1,275 1,216 1,164 1,151 1,028 1,046 1,022 1,073 1,370 78.32%<br />
Fallston Middle 1,274 1,228 1,224 1,212 1,180 925 905 892 887 929 1,105 84.07%<br />
Havre de Grace Middle 657 650 605 589 599 609 613 584 530 529 775 68.26%<br />
Magnolia Middle 935 903 913 916 869 874 785 795 735 710 1,073 66.17%<br />
North <strong>Harford</strong> Middle 1,226 1,200 1,118 1,123 1,085 1,153 1,134 1,113 1,056 1,019 1,243 81.98%<br />
Patterson Mill Middle - - - - - 735 763 775 753 732 711 102.95%<br />
Southampton Middle 1,613 1,541 1,528 1,535 1,549 1,252 1,295 1,256 1,270 1,276 1,540 82.86%<br />
Total Middle Schools 9,782 9,622 9,366 9,272 9,056 9,038 8,892 8,823 8,631 8,607 10,579 81.36%<br />
Aberdeen High 1,250 1,250 1,357 1,543 1,589 1,569 1,504 1,464 1,459 1,411 1,679 84.04%<br />
Bel Air High 1,573 1,649 1,636 1,639 1,683 1,403 1,380 1,431 1,574 1,633 1,668 97.90%<br />
C. Milton Wright High 1,793 1,789 1,911 1,834 1,850 1,746 1,587 1,591 1,555 1,491 1,678 88.86%<br />
Edgewood High 1,226 1,327 1,357 1,316 1,261 1,177 1,123 1,194 1,226 1,211 1,743 69.48%<br />
Fallston High 1,656 1,672 1,635 1,643 1,606 1,453 1,365 1,209 1,113 1,090 1,529 71.29%<br />
<strong>Harford</strong> Technical High 1,054 1,070 1,069 1,052 1,056 1,056 1,040 1,026 1,024 1,019 920 110.76%<br />
Havre de Grace High 690 687 705 721 717 769 764 775 745 691 850 81.29%<br />
Joppatowne High 1,052 1,051 1,108 1,118 1,063 1,004 969 952 940 872 1,126 77.44%<br />
North <strong>Harford</strong> High 1,370 1,425 1,447 1,445 1,437 1,385 1,367 1,393 1,383 1,447 1,603 90.27%<br />
Patterson Mill High - - - - - 436 701 949 964 991 924 107.25%<br />
Total High Schools 11,664 11,920 12,225 12,311 12,262 11,998 11,800 11,984 11,983 11,856 13,720 86.41%<br />
Total Secondary Schools 21,446 21,542 21,591 21,583 21,318 21,036 20,692 20,807 20,614 20,463 24,299 84.21%<br />
Alternative Education 20 30 17 113 139 155 106 76 112 113 250 45.20%<br />
Restoration Academy (Charter) - - - - 21 78 79 - - - - -<br />
John Archer 164 154 158 152 160 159 159 147 143 128 210 60.95%<br />
Total Special Schools 184 184 175 265 320 392 344 223 255 241 460 52.39%<br />
Total All Schools 40,264 40,203 40,294 40,212 39,571 39,175 38,610 38,639 38,394 38,222 44,112 86.65%<br />
Teachers & Therapists Staff (1) 2,579 2,590 2,357 2,437 2,589 2,809 2,835 2,778 2,831 2,832<br />
Student/Teacher Ratio 15.61 15.52 17.10 16.50 15.28 13.95 13.62 13.91 13.56 13.50<br />
Source: Monthly <strong>Report</strong> on Enrollment at September 30.<br />
Source (1): Maryland State Department of Education Fact Book for relevant year, estimated for 2011<br />
Note: September 30 is the State's official enrollment date for the school year.<br />
Restoration Academy's charter was revoked after the 2008 school year.<br />
75