Breakout Session A - US Pharmacopeial Convention
Breakout Session A - US Pharmacopeial Convention
Breakout Session A - US Pharmacopeial Convention

You also want an ePaper? Increase the reach of your titles
YUMPU automatically turns print PDFs into web optimized ePapers that Google loves.
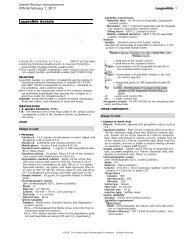
Theory, Instrumentation and<br />
Sampling Techniques for<br />
Vibrational Spectroscopy<br />
Peter R. Griffiths<br />
Department of Chemistry<br />
University of Idaho<br />
Moscow, ID 83844-2343<br />
Food Protein Workshop: Developing a Toolbox of Analytical<br />
Solutions to Address Adulteration<br />
June 16 and 17, 2009: <strong>Breakout</strong> <strong>Session</strong>: “Theory and application<br />
of rapid mid-infrared, near-infrared and Raman methods and<br />
chemometrics to measure protein and prevent adulteration.”<br />
Handbook of Vibrational Spectroscopy<br />
1
Number of Vibrational Modes<br />
Molecules have three degrees of translational freedom,<br />
corresponding to motion in the x, y and z directions, and three<br />
degrees of rotational freedom, corresponding to motion<br />
around the three principal axes.<br />
y<br />
z<br />
O<br />
x<br />
H<br />
H<br />
The other 3N - 6 degrees of freedom are manifested as<br />
vibrational modes.<br />
Vibrational Transitions<br />
Each vibrational mode is<br />
quantized and the molecule<br />
can exist in the ground<br />
vibrational state (v = 0) or an<br />
excited vibrational state. The<br />
energy to promote the<br />
transition from the ground to<br />
the first excited vibrational<br />
state (v = 0 → 1) corresponds<br />
to absorption of radiation in<br />
the infrared spectrum.<br />
2
Energy of a Harmonic<br />
Vibrational Mode<br />
The energy of a harmonic vibration is:<br />
E<br />
~<br />
iv<br />
= h cν<br />
i<br />
(vi<br />
+ 0.5)<br />
where<br />
~ ν<br />
i is the wavenumber of the i th mode<br />
and v i is the vibrational quantum number<br />
The only transitions allowed for harmonic<br />
vibrations are for Δv i = ±1.<br />
Fundamental Transitions<br />
Fundamental Transition: v = 0 → v = 1<br />
v = 0<br />
v = 1<br />
v = 2<br />
v is the vibrational quantum number<br />
3
Fundamental Transitions<br />
All fundamental transitions absorb radiation<br />
in the mid-infrared region of the spectrum<br />
(wavelengths from 2.5 – 25 μm);<br />
Wavenumber is the number of waves per<br />
unit length - usually given as cm -1 ;<br />
Therefore the wavenumber region of the<br />
mid-infrared spectrum is 4000 – 400 cm -1 .<br />
Energy of an Anharmonic<br />
Vibrational Mode<br />
The energy of an anharmonic vibration is:<br />
E<br />
iv<br />
= h c<br />
~ ν (v + 0.5) −<br />
~<br />
i i<br />
h cν<br />
i<br />
xi<br />
(vi<br />
+<br />
2<br />
0.5)<br />
where x i is the anharmonicity constant;<br />
and ~ ν is the wavenumber of the i th mode.<br />
i<br />
The transitions allowed for anharmonic vibrations are<br />
for Δv i = ±1, ±2, ±3, etc…. but as Δv i gets larger, the<br />
probability of the transition decreases and the band<br />
becomes much weaker.<br />
4
First Overtone<br />
Fundamental Transition: v = 0 → v = 1<br />
First Overtone: v = 0 → v = 2<br />
v = 0<br />
v = 1<br />
v = 2<br />
Second Overtone<br />
Fundamental Transition: v = 0 → v = 1<br />
First Overtone: v = 0 → v = 2<br />
Second Overtone: v = 0 → v = 3<br />
v = 0<br />
v = 1<br />
v = 2<br />
v = 3<br />
5
Combination Bands<br />
It is possible for one photon to excite two different<br />
vibrational modes, so that an absorption band is<br />
seen at a wavenumber equal to the sum of the<br />
wavenumbers of the two fundamentals. Such<br />
bands are known as combination bands.<br />
The two modes must have at least one atom in<br />
common.<br />
Overtone and Combination Bands<br />
Overtone and combination bands may absorb light in<br />
either the mid-infrared or the near-infrared region of<br />
the spectrum.<br />
Overtone and combination bands involving C-H, O-H<br />
or N-H stretching modes usually absorb radiation in<br />
the near-infrared spectrum.<br />
They are weaker than the fundamental modes from<br />
which they are derived, but this is not necessarily a<br />
bad thing.<br />
6
1st Overtone Bands<br />
H 2<br />
O<br />
ROH<br />
R‐NH 2<br />
Ar OH<br />
Ar C‐H<br />
CH 3<br />
CH 2<br />
CH<br />
CH‐Bend Fundamental<br />
Combined with CH‐<br />
Stretch 1 st Overtone<br />
CH 3<br />
CH 2<br />
CH<br />
1350 1400 1450 1500 1550 1600 1650 1700 1750 1800<br />
Wavelength (nm)<br />
2nd & 3rd Overtone Bands<br />
H 2<br />
O<br />
R‐NH 2<br />
R‐NH 2<br />
ROH<br />
Ar C‐H<br />
Ar C‐H<br />
CH 3<br />
CH 2<br />
CH 3<br />
CH 2<br />
CH<br />
CH<br />
750 800 850 900 950 1000 1050 1100 1150 1200 1250<br />
Wavelength (nm)<br />
7
How Do Molecules Interact With Light?<br />
For a vibration to absorb infrared radiation, there must<br />
be a change in the dipole moment during the vibration.<br />
The vibration is sometimes described by a normal<br />
coordinate, Q.<br />
The absorptivity is proportional to the square of the<br />
change in dipole moment with the normal coordinate.<br />
a<br />
=<br />
k<br />
⎛<br />
⎜<br />
⎝<br />
2<br />
μ ⎞<br />
⎟<br />
⎠<br />
d<br />
dQ<br />
where k is a constant.<br />
Raman Spectroscopy<br />
Sample is illuminated with monochromatic light from a<br />
laser.<br />
Assume that the sample is transparent, i.e., no absorption.<br />
Not quite all the light passes through the sample; a small<br />
fraction is scattered in all directions.<br />
This scattered light is collected and passed into a<br />
monochromator or an interferometer and hence to a<br />
detector.<br />
8
Rayleigh Scattering<br />
Most of the scattered radiation is of the same wavelength<br />
as the incident laser radiation.<br />
This is known as Rayleigh scattering, or to elastic<br />
collisions between the photons and the molecule.<br />
Rayleigh scattered light is about 10 -5 or 10 -6 times the<br />
intensity of the laser radiation and is actually a nuisance<br />
for Raman spectroscopy.<br />
Raman Scattering<br />
Some extremely weak additional features in the scattered<br />
light are found at slightly different frequencies.<br />
They are displaced from the “exciting line” by exactly the<br />
vibrational energy spacings.<br />
These new features are called Raman lines bands and are<br />
due to inelastically scattered radiation.<br />
They are very weak - about 10,000 times weaker than the<br />
Rayleigh scattered radiation.<br />
9
Collision Model for Scattering<br />
Rayleigh Scattering<br />
hν 0 hν 0<br />
Raman Scattering<br />
hν 0 h(ν 0 - ν vib )<br />
Raman Scattering<br />
An elastic collision gives Rayleigh scattering - a change in<br />
direction but no change in frequency.<br />
An inelastic collision leaves an amount of energy in the molecule<br />
equal to hcν ~ vib, where ~ ν vib is in cm -1 . Therefore, the scattered<br />
photon has less energy than the incident photon. Because it has an<br />
energy hc (ν ~ 0 - ~ ν vib), it will appear at the new position (ν ~ 0 - ~ ν vib).<br />
Thus there is a change in direction and frequency.<br />
Thus for a Raman band, ~ ν obs = (ν ~ 0 - ~ ν vib). This can be rearranged<br />
to ~ ν vib = (ν ~ 0 - ~ ν obs). Since the latter two can be measured, one can<br />
obtain vibrational frequencies from Raman scattering.<br />
By convention, Raman frequencies are displacements from the<br />
exciting line, ~ ν 0 - ~ ν obs. They are always given in cm -1 .<br />
10
Energy Level Diagram<br />
“Virtual State”<br />
Origin of Raman Scattering<br />
11
Nature of Raman Scattering<br />
It is not an absorption process. It is a scattering<br />
effect and closer to emission than absorption.<br />
The displacement, ν ~ 0 - ν ~ obs cm -1 , corresponds to<br />
the infrared range.<br />
Raman scattering offers a means of measuring<br />
vibrational bands using ultraviolet, visible or<br />
near-infrared light, where detection is far more<br />
sensitive.<br />
Raman intensity is proportional to (ν ~ 0 - ν ~ obs) 4 , so<br />
the shorter the wavelength the better – except<br />
when the sample fluoresces!<br />
Comparison of Infrared and<br />
Raman Spectra<br />
Both infrared and Raman are vibrational spectra<br />
Provided that both spectra are of samples in the<br />
same physical state, the wavenumber of a give<br />
vibrational mode is the same in the IR and Raman.<br />
The relative intensities of bands in the IR and<br />
Raman may be very different as the mechanisms<br />
are very different.<br />
In many respects, IR and Raman spectroscopy are<br />
complementary.<br />
12
Forbidden Bands in the Infrared<br />
If the dipole moment doesn’t change during the<br />
vibration, I = 0 and the band is “forbidden in the<br />
infrared.<br />
(The vibration still occurs but it cannot be excited by<br />
absorption of infrared radiation.)<br />
If ∂μ/∂Q is large, the band is intense. (Remember the<br />
squared dependence.)<br />
Strong Bands in the Infrared<br />
Bands that are strong in the infrared:<br />
Stretching of polar bonds: O-H, C-O, C=O, C-Cl<br />
Out-of-plane wags of unsaturated C-H, as in olefin<br />
and phenyl rings<br />
13
Weak Bands in the Infrared<br />
If the electronegativities of the two atoms forming the<br />
bond are nearly equal, stretching the bond usually gives<br />
rise to a weak band, e.g.:<br />
H-H, C-C<br />
C≡C stretch in H- C≡C-H, R- C≡C-R and R- C≡C-R′<br />
C-H stretch; the intensity per C-H group is usually low.<br />
Intensity in Raman Bands<br />
The intensity of Raman bands is determined by a<br />
change in polarizability during a vibration:<br />
I<br />
⎛ ∂α<br />
⎞<br />
α ⎜ ⎟<br />
⎝ ∂Q<br />
⎠<br />
2<br />
where α is the polarizability<br />
Q is the normal coordinate.<br />
The polarizability measures the ease with which an<br />
external electric field can induce a temporary dipole<br />
momemt, i.e., the ease with which electrical charges in<br />
a molecule can be displaced.<br />
14
Strong Raman Bands<br />
The polarizability is large when there is a high<br />
concentration of loosely held electrons in a bond that is<br />
involved in the vibration, since ∂α/∂Q is also large<br />
then. Some examples:<br />
Multiple bonds: C≡C, -C≡N, C=C, C=O;<br />
Stretching and bending of -Cl, -Br and -I bonds;<br />
Other many-electron atoms: S, Hg, other heavy metals<br />
For bonds that are strongly polar, Raman bands tend to<br />
be weak, e.g.:<br />
Stretching of O-H and C-F.<br />
Infrared Spectral Regions<br />
Now classified as follows:<br />
cm -1<br />
μm<br />
Near-Infrared 12,500 - 4000 0.8 - 2.5<br />
Si region 12,500 - 9,100 0.8 - 1.1<br />
PbS region 9,100 - 4,000 1.1 - 2.5<br />
Mid-Infrared 4,000 - 400 2.5 - 25<br />
Far-Infrared 400 - 10 25 - 1,000<br />
15
Sources<br />
Mid Infrared<br />
Incandescent SiC rod at ~1200K (Globar)<br />
Near Infrared<br />
Standard tungsten filament light bulb<br />
Quartz-tungsten-halogen lamp<br />
Raman<br />
Nd:YAG or Nd:YAlO 4 (1064 nm)<br />
Diode laser (785 nm usually)<br />
Helium-neon (633 nm)<br />
Frequency-doubled Nd:YAG (532 nm)<br />
Detectors<br />
Mid Infrared<br />
Deuterated triglycine sulfate pyroelectric (298K)<br />
Mercury cadmium telluride (77K)<br />
Near Infrared<br />
TE-cooled lead sulfide<br />
Indium gallium arsenide<br />
Silicon (for λ < 1100 nm)<br />
Raman<br />
TE-cooled charge-couple device array (CCD)<br />
LN 2 -cooled Ge or InGaAs<br />
16
Spectrometers<br />
Mid Infrared<br />
Fourier transform infrared (FT-IR)<br />
Near Infrared<br />
Filter<br />
Grating monochromator or polychromator<br />
FT-NIR<br />
Tunable laser<br />
Raman<br />
Polychromator<br />
FT-Raman<br />
Smiths Detection IdentifyIR TM<br />
Portable FT-IR Spectrometer<br />
17
Concept<br />
Reality<br />
Miniature Optical Bench<br />
14mm<br />
How do you make an optical<br />
bench that is just 14mm long?<br />
18
The Platform<br />
BENCH<br />
DEVICES<br />
Optical Module<br />
Ahura Hand-Held Raman Spectrometer<br />
19
Sampling Techniques for Mid-Infrared<br />
Transmission<br />
KBr disks and mineral oil mulls (rare today)<br />
Diffuse Reflection<br />
Needs dilution in an IR-transparent powder<br />
Attenuated Total Reflection (ATR)<br />
ZnSe or diamond (n = 2.4)<br />
Germanium (n = 4.0)<br />
Diffuse Reflection<br />
20
Beam Paths Through Powders<br />
Specularly reflected<br />
light<br />
Diffusely reflected<br />
light<br />
Diffusely transmitted light<br />
Attenuated Total Reflection<br />
21
Refraction<br />
Low refractive<br />
index, n 1<br />
θ 1<br />
θ 2<br />
High refractive<br />
index, n 2<br />
Snell’s Law: n 1 sin θ 1 = n 2 sin θ 2<br />
Behavior Above and Below the Critical Angle<br />
Low refractive<br />
index, n 1<br />
High refractive<br />
index, n 2<br />
θ C<br />
Beam below critical<br />
angle obeys Snell’s<br />
Law<br />
θ C = sin -1 (n 1 /n 2 )<br />
Beam above critical<br />
angle reflects<br />
internally<br />
22
Optical Properties of Infrared<br />
Transmitting Materials<br />
Material n 2 θ C (for n 1 = 1.50)<br />
Potassium bromide 1.51 90º<br />
Silver chloride 1.90 49º<br />
Zinc sulfide 2.20 43º<br />
KRS-5 2.37 40º<br />
Zinc selenide 2.40 40º<br />
Diamond 2.41 40º<br />
Silicon 3.41 26º<br />
Germanium 4.00 22º<br />
Depth of Penetration<br />
d p<br />
=<br />
λ<br />
2<br />
2<br />
2π<br />
n<br />
1<br />
2<br />
sin θ −<br />
⎛n<br />
⎞<br />
⎜ n ⎟<br />
2 ⎠<br />
⎝<br />
23
First-Order ATR Correction<br />
(divide by wavelength)<br />
650 to 4000 cm -1 @ better than 4 cm -1 resolution<br />
Single-bounce diamond ATR for ‘press-and-shoot’<br />
ZnSe beamsplitter, laser-referenced interferometer<br />
Temperature/shock/drop rugged (-20°C to +40°C operation)<br />
“MIL-STD 810F” certified<br />
DLTGS<br />
ATR (diamond)<br />
fixed mirror<br />
broadband source<br />
beamsplitter<br />
moving mirror<br />
24
MIL-SPEC-810F Compliance<br />
CHALLENGE<br />
Mechanical shock<br />
Vibration<br />
Transit Shock<br />
Humidity<br />
Sand/dust/dirt<br />
Thermal shock<br />
Low temp. (op)<br />
High temp. (op)<br />
Low temp. (store)<br />
High temp. (store)<br />
Immersion (op)<br />
SPECIFICATION<br />
40g in 11ms, saw-tooth 1 day<br />
1hr/axis, composite wheeled vibration<br />
4 foot drop onto plywood on concrete 26 times<br />
5X (48hrs) @ 60C & 95% RH<br />
Blowing dust<br />
-30C to +60C in 1 meter of water<br />
Sampling Techniques for Near-Infrared<br />
Transmission<br />
Usually in the short-wavelength region<br />
Diffuse Reflection<br />
Needs no dilution<br />
Transflection<br />
Mount liquid or semi-solid sample on reflective<br />
base and then use diffuse reflection optics.<br />
25
Sampling Techniques for Raman<br />
Liquids<br />
Hold sample in glass capillary or in glass bottle<br />
Solids<br />
Measure as received<br />
Surface-Enhanced Raman Scattering (SERS)<br />
Evaporate solution on roughened silver or gold.<br />
Surface-Enhanced Raman Scattering<br />
(SERS)<br />
Enhancement of the<br />
Raman spectrum of<br />
molecules on the<br />
surface of roughened<br />
silver or gold metal<br />
plates, colloids or<br />
nanoparticles.<br />
5-nm thick layer of silver<br />
26
SERS Spectrum of a Self-Assembled Monolayer<br />
of p-Nitrothiophenol on Silver Surface<br />
Produced by Physical Vapor Deposition (10 s)<br />
Counts (Normalized and Corrected)<br />
2000<br />
1000<br />
0<br />
2000<br />
1500<br />
1000<br />
Raman Shift / cm -1<br />
500<br />
27
NIR Technology to Help<br />
Food Technology<br />
Karl H. Norris<br />
Consultant<br />
11204 Montgomery Rd,<br />
Beltsville, MD 20705<br />
knnirs@gmail.com<br />
Food Protein Workshop: Developing a Toolbox of Analytical<br />
Solutions to Address Adulteration, June 16-17,2009<br />
NIR Merits<br />
1. Many food constituents have an NIR signal.<br />
2. The absorption bands are of the correct magnitude for<br />
measurement with little or no sample preparation.<br />
3. Radiation sources are readily available.<br />
4. Rapid data collection, with good signal to noise.<br />
5. Detectors and associated electronics exist, and they<br />
continuing to improve.<br />
6. Windows, lenses, fibers, and standards are available.<br />
7. Chemometrics has grown with NIR technology.<br />
8. Computer technology is readily available.<br />
9. Many technologies available for collecting NIR spectra.<br />
28
Error Sources for NIR of Scattering Samples<br />
1. Sampling Errors<br />
2. Sample Stability<br />
3. Packing Effects<br />
4. Sample Temperature Effects<br />
5. Reference Data Errors<br />
6. Instrument Noise<br />
7. Humidity Effects<br />
29
Source Fibers<br />
Collecting Fibers<br />
Blocking Metal<br />
Interactance Probe<br />
30
Photo by Kayla Dowell 9th Grade Germann Hills Christian School<br />
31
Beam Paths Through Powders<br />
Specularly reflected<br />
light<br />
Diffusely reflected<br />
light<br />
Diffusely transmitted light<br />
DIFF<strong>US</strong>E REFLECTION: 1850-2500 nm<br />
1. Small Particles, less than 0.5 mm<br />
2. Low Moisture, less than 15%<br />
36
DIFF<strong>US</strong>E REFLECTION: 1350-1850 nm<br />
1. Medium Particle Size, less than 2 mm<br />
2. Medium Moisture, 15-30 %<br />
DIFF<strong>US</strong>E REFLECTION: 700-1350 nm<br />
1. Large Particle Size, greater than 2 mm<br />
2. High Moisture, 30-90 %<br />
37
Human Hand<br />
Water<br />
Fat<br />
Deoxyhemoglobin<br />
38
B<br />
B<br />
A<br />
39
Protein Measurements in Food Products<br />
• The official method measures nitrogen to<br />
obtain protein content.<br />
• NIR does not sense nitrogen.<br />
• NIR senses overtones of NH vibrations of<br />
the amino acids to sense protein.<br />
41
Detecting Adulterants and Unwanted Synthetics in Ingredients<br />
by Cynthia Kradjel, Application Development Manager, Buchi Corporation<br />
42
References to use of NIR to detect melamine in food powders:<br />
Melamine Detection in Infant Formula Powder Using Near- and Mid-Infrared<br />
Spectroscopy<br />
Lisa J. Mauer, Alona A. Chernyshova, Ashley Hiatt, Amanda Deering and Reeta<br />
Davis<br />
J. Agric. Food Chem., 2009, 57 (10), pp 3974–3980<br />
Publication Date (Web): April 22, 2009 (Article)<br />
DOI: 10.1021/jf900587m<br />
doi: 10.1255/jnirs.829<br />
Rapid detection of melamine in milk powder by near infrared spectroscopy<br />
Chenghui Lu, Bingren Xiang, Gang Hao, Jianping Xu, Zhengwu Wang and<br />
Changyun Chen<br />
43
0.9<br />
2 Melamine Reflection Spectra<br />
0.8<br />
0.7<br />
Log(1/R)<br />
0.6<br />
0.5<br />
0.4<br />
9 nm bandpass monochromator-<br />
0.3<br />
0.2<br />
0.1<br />
-High Resolution FT<br />
0<br />
1000 1100 1200 1300 1400 1500 1600 1700 1800 1900 2000 2100 2200 2300 2400 2500<br />
Wavelength nm<br />
44
Proposed Method for Detecting Adulteration<br />
1. Develop 6 or more different calibrations for protein on the<br />
product to be tested.<br />
2. Perform an NIR scan of the sample to be tested.<br />
3. Predict the protein content of test sample with each of the<br />
different calibrations.<br />
4. Observe the range of the predicted proteins.<br />
5. If the predicted range exceeds a value (~5% of the average),<br />
the sample is declared as adulterated.<br />
Derivative-Ratio Regression<br />
• % Protein = A + B(WL1-WL2)/ WL3<br />
• WL1 is second derivative at wavelength 1<br />
• WL2 is second derivative at wavelength 2<br />
• WL3 is second derivative at wavelength 3<br />
• A, B, WL1, WL2, and WL3 are optimized<br />
to provide the minimum SEC for %Protein<br />
on a group of sample spectra.<br />
45
Results of Adulteration Tests on Flour<br />
% Protein = A + B(WL1-WL2)/ WL3<br />
Calibration No.<br />
1<br />
2<br />
3<br />
4<br />
5<br />
6<br />
7<br />
WL1 nm<br />
1977.0<br />
1687.0<br />
1223.5<br />
2209.0<br />
1068.5<br />
1845.0<br />
1139.0<br />
WL2 nm<br />
1625.0<br />
1961.5<br />
1978.0<br />
1971.5<br />
1976.5<br />
1978.5<br />
1978.0<br />
WL3 nm<br />
1333.0<br />
2293.0<br />
1965.5<br />
1966.5<br />
994.0<br />
872.5<br />
868.0<br />
SEC %PRO.<br />
0.102<br />
0.139<br />
.0114<br />
0.122<br />
0.118<br />
0.114<br />
0.124<br />
0% RMSEP<br />
0.008<br />
0.214<br />
0.135<br />
0.030<br />
0.084<br />
0.092<br />
0.072<br />
0.1%M RMSEP<br />
0.132<br />
0.246<br />
0.258<br />
0.335<br />
0.163<br />
0.097<br />
0.071<br />
1.0%M RMSEP<br />
1.300<br />
1.292<br />
0.987<br />
2.201<br />
1.425<br />
0.207<br />
0.272<br />
.<br />
Results of Adulteration Tests on Flour<br />
% Protein = A + B(WL1-WL2)/ WL3<br />
Calibration #<br />
1<br />
2<br />
3<br />
4<br />
5<br />
6<br />
WL1 nm<br />
1692<br />
1982<br />
1736<br />
2184<br />
2112<br />
1188<br />
WL2 nm<br />
816<br />
748<br />
2170<br />
774<br />
2330<br />
1184<br />
WL3 nm<br />
1606<br />
1816<br />
1516<br />
1518<br />
1896<br />
976<br />
SEC %PRO.<br />
0.116<br />
0.076<br />
0.086<br />
0.076<br />
0.132<br />
0.123<br />
0% RMSEP<br />
0.070<br />
0.101<br />
0.037<br />
0.062<br />
0.046<br />
0.162<br />
0.1%M RMSEP<br />
0.075<br />
0.172<br />
0.127<br />
0.123<br />
0.153<br />
0.251<br />
1%M RMSEP<br />
0.181<br />
1.715<br />
1.627<br />
1.452<br />
1.474<br />
2.209<br />
46
Results of Adulteration Tests on Flour<br />
% Protein = A + B(WL1-WL2)/ WL3<br />
Calibration No.<br />
1<br />
2<br />
3<br />
4<br />
5<br />
6<br />
WL1 nm<br />
1692<br />
1982<br />
1736<br />
2184<br />
2112<br />
1188<br />
WL2 nm<br />
816<br />
748<br />
2170<br />
774<br />
2330<br />
1184<br />
WL3 nm<br />
1606<br />
1816<br />
1516<br />
1518<br />
1896<br />
976<br />
SEC %PRO.<br />
0.116<br />
0.076<br />
0.086<br />
0.076<br />
0.132<br />
0.123<br />
0% RMSEP<br />
0.070<br />
0.101<br />
0.037<br />
0.062<br />
0.046<br />
0.162<br />
0.1%M RMSEP<br />
0.075<br />
0.172<br />
0.127<br />
0.123<br />
0.153<br />
0.251<br />
1%M RMSEP<br />
0.181<br />
1.715<br />
1.627<br />
1.452<br />
1.474<br />
2.209<br />
0.2%Urea RMSEP<br />
0.575<br />
0.181<br />
0.166<br />
0.116<br />
0.438<br />
0.222<br />
1.0%Urea RMSEP<br />
3.507<br />
1.078<br />
0.822<br />
0.621<br />
3.187<br />
0.992<br />
Results of Adulteration Tests on Flour<br />
NIRSystems 6500, year 1990<br />
Calibration No.<br />
1<br />
2<br />
3<br />
4<br />
5<br />
6<br />
STD<br />
Max-Min<br />
SEC % Pro.<br />
0.116<br />
0.076<br />
0.086<br />
0.076<br />
0.132<br />
0.123<br />
0.025<br />
0.056<br />
NIR % P, Clean<br />
NIR % P, 0.1%M<br />
NIR % P, 1.0%M<br />
NIR % P, Clean<br />
NIR % P, 0.1%M<br />
NIR % P, 1.0%M<br />
NIR % P, Clean<br />
NIR % P, 0.1%M<br />
NIR % P, 1.0%M<br />
13.94<br />
13.92<br />
13.76<br />
10.78<br />
10.77<br />
10.64<br />
8.51<br />
8.50<br />
8.37<br />
13.76<br />
13.93<br />
15.45<br />
10.84<br />
11.01<br />
12.59<br />
8.59<br />
8.78<br />
10.45<br />
13.88<br />
14.07<br />
15.89<br />
10.75<br />
10.90<br />
12.26<br />
8.56<br />
8.69<br />
9.91<br />
13.87<br />
13.99<br />
15.72<br />
10.83<br />
10.84<br />
11.01<br />
8.52<br />
8.46<br />
7.60<br />
13.88<br />
13.87<br />
13.78<br />
10.76<br />
10.68<br />
9.80<br />
8.54<br />
8.39<br />
6.48<br />
13.72<br />
13.93<br />
16.08<br />
10.86<br />
11.05<br />
12.91<br />
8.72<br />
8.92<br />
10.92<br />
0.084<br />
0.069<br />
1.061<br />
0.046<br />
0.041<br />
1.249<br />
0.077<br />
0.206<br />
1.750<br />
0.22<br />
0.20<br />
2.32<br />
0.11<br />
0.37<br />
3.11<br />
0.21<br />
0.53<br />
4.44<br />
47
Results of Adulteration Tests on Flour<br />
NIRSystems 6500, year 1990<br />
Calibration No.<br />
1<br />
2<br />
3<br />
4<br />
5<br />
6<br />
STD<br />
Max-Min<br />
SEC % Pro.<br />
0.116<br />
0.076<br />
0.086<br />
0.076<br />
0.132<br />
0.123<br />
0.025<br />
0.056<br />
NIR % P, Clean<br />
NIR % P, 0.1%M<br />
NIR % P, 1.0%M<br />
NIR % P, Clean<br />
NIR % P, 0.1%M<br />
NIR % P, 1.0%M<br />
NIR % P, Clean<br />
NIR % P, 0.1%M<br />
NIR % P, 1.0%M<br />
13.94<br />
13.92<br />
13.76<br />
10.78<br />
10.77<br />
10.64<br />
8.51<br />
8.50<br />
8.37<br />
13.76<br />
13.93<br />
15.45<br />
10.84<br />
11.01<br />
12.59<br />
8.59<br />
8.78<br />
10.45<br />
13.88<br />
14.07<br />
15.89<br />
10.75<br />
10.90<br />
12.26<br />
8.56<br />
8.69<br />
9.91<br />
13.87<br />
13.99<br />
15.72<br />
10.83<br />
10.84<br />
11.01<br />
8.52<br />
8.46<br />
7.60<br />
13.88<br />
13.87<br />
13.78<br />
10.76<br />
10.68<br />
9.80<br />
8.54<br />
8.39<br />
6.48<br />
13.72<br />
13.93<br />
16.08<br />
10.86<br />
11.05<br />
12.91<br />
8.72<br />
8.92<br />
10.92<br />
0.084<br />
0.069<br />
1.061<br />
0.046<br />
0.041<br />
1.249<br />
0.077<br />
0.206<br />
1.750<br />
0.22<br />
0.20<br />
2.32<br />
0.11<br />
0.37<br />
3.11<br />
0.21<br />
0.53<br />
4.44<br />
Results of Adulteration Tests on Flour<br />
NIRSystems 6500, year 1990<br />
Calibration No.<br />
SEC % Pro.<br />
1<br />
0.116<br />
2<br />
0.076<br />
3<br />
0.086<br />
4<br />
0.076<br />
5<br />
0.132<br />
6<br />
0.123<br />
STD<br />
0.025<br />
Max-Min<br />
0.056<br />
NIR % P, Clean<br />
13.94<br />
13.76<br />
13.88<br />
13.87<br />
13.88<br />
13.72<br />
0.084<br />
0.22<br />
NIR % P, 0.2%Urea<br />
14.63<br />
14.01<br />
13.94<br />
13.98<br />
14.50<br />
13.94<br />
0.276<br />
0.69<br />
NIR % P, 1.0%Urea<br />
18.08<br />
15.11<br />
14.12<br />
14.40<br />
18.08<br />
14.92<br />
1.584<br />
3.96<br />
NIR % P, Clean<br />
10.78<br />
10.84<br />
10.75<br />
10.83<br />
10.76<br />
10.86<br />
0.046<br />
0.11<br />
NIR % P, 0.2%Urea<br />
11.31<br />
11.03<br />
10.94<br />
10.96<br />
11.15<br />
11.03<br />
0.148<br />
0.37<br />
NIR % P, 1.0%Urea<br />
13.94<br />
11.87<br />
11.53<br />
11.45<br />
13.40<br />
11.78<br />
0.96<br />
2.41<br />
NIR % P, Clean<br />
8.51<br />
8.59<br />
8.56<br />
8.52<br />
8.54<br />
8.72<br />
0.077<br />
0.21<br />
NIR % P, 0.2%Urea<br />
9.02<br />
8.77<br />
8.83<br />
8.68<br />
8.86<br />
8.88<br />
0.096<br />
0.24<br />
NIR % P, 1.0%Urea<br />
11.63<br />
9.52<br />
9.72<br />
9.29<br />
10.88<br />
9.57<br />
0.94<br />
2.34<br />
48
Results of Adulteration Tests on Flour<br />
NIRSystems 6500, year 1990<br />
Calibration No.<br />
SEC % Pro.<br />
1<br />
0.116<br />
2<br />
0.076<br />
3<br />
0.086<br />
4<br />
0.076<br />
5<br />
0.132<br />
6<br />
0.123<br />
STD<br />
0.025<br />
Max-Min<br />
0.056<br />
NIR % P, Clean<br />
13.94<br />
13.76<br />
13.88<br />
13.87<br />
13.88<br />
13.72<br />
0.084<br />
0.22<br />
NIR % P, 0.2%Urea<br />
14.63<br />
14.01<br />
13.94<br />
13.98<br />
14.50<br />
13.94<br />
0.276<br />
0.69<br />
NIR % P, 1.0%Urea<br />
18.08<br />
15.11<br />
14.12<br />
14.40<br />
18.08<br />
14.92<br />
1.584<br />
3.96<br />
NIR % P, Clean<br />
10.78<br />
10.84<br />
10.75<br />
10.83<br />
10.76<br />
10.86<br />
0.046<br />
0.11<br />
NIR % P, 0.2%Urea<br />
11.31<br />
11.03<br />
10.94<br />
10.96<br />
11.15<br />
11.03<br />
0.148<br />
0.37<br />
NIR % P, 1.0%Urea<br />
13.94<br />
11.87<br />
11.53<br />
11.45<br />
13.40<br />
11.78<br />
0.96<br />
2.41<br />
NIR % P, Clean<br />
8.51<br />
8.59<br />
8.56<br />
8.52<br />
8.54<br />
8.72<br />
0.077<br />
0.21<br />
NIR % P, 0.2%Urea<br />
9.02<br />
8.77<br />
8.83<br />
8.68<br />
8.86<br />
8.88<br />
0.096<br />
0.24<br />
NIR % P, 1.0%Urea<br />
11.63<br />
9.52<br />
9.72<br />
9.29<br />
10.88<br />
9.57<br />
0.94<br />
2.34<br />
Testing for Adulteration with Different Materials<br />
Model XDS-RCA, year 2002<br />
49
Testing for Adulteration with Different Materials<br />
Model XDS-RCA, year 2002<br />
14.5<br />
14<br />
13.5<br />
Testing for Adulteration with Different Materials<br />
on a high protein flour spectrum<br />
NIR % Protein<br />
13<br />
12.5<br />
12<br />
11.5<br />
11<br />
No Contamination<br />
0.1% Melamine<br />
1.0% Melamine<br />
1.0% Talc<br />
1.0% Urea<br />
5.0% Soy Protein<br />
10.5<br />
10<br />
9.5<br />
1 2 3 4 5 6 7<br />
Calibration Number<br />
50
Acknowledgements<br />
• Dr. David Hopkins for the melamine spectrum.<br />
• DR. Ron Rubinovitz, Buchi Corp., for a high<br />
resolution melamine spectrum.<br />
• Foss-NIRSystems for access to flour spectra.<br />
Conclusions<br />
NIR Technology can help Food Technology.<br />
A simple method is proposed using multiple<br />
protein calibrations on a single NIR scan to<br />
detect adulteration in food products.<br />
Test results are provided with computer simulation<br />
of wheat flour spectra adulterated with a<br />
melamine spectrum, and shows definitive<br />
detection at the 1.0% level.<br />
Results are also presented for detection of<br />
adulteration with talc, soy protein, and urea.<br />
The procedure needs to be tested with actual<br />
samples on different types of food products.<br />
51
“Intuitive” Chemometrics for<br />
Protein Measurements and<br />
Adulterant Detection<br />
David B. Funk, Ph.D.<br />
Technical Services Division<br />
Grain Inspection, Packers and Stockyards Administration<br />
U.S. Department of Agriculture<br />
Kansas City, Missouri<br />
52
What is an NIR Calibration?<br />
• An equation (or, particularly, a set of<br />
equation coefficients) that expresses a useful<br />
relationship between electro-optic parameters<br />
and a constituent of interest.<br />
• Many different mathematical methods exist<br />
for deriving “optimum” equations.<br />
• Most NIR calibration equations have a simple<br />
common form.<br />
NIRS Prediction Equation Forms<br />
Sum of products<br />
%P K 0 + K 1 ⋅L 1 + K 2 ⋅L 2 + .... + K n ⋅L n<br />
Summation Notation<br />
Vector/Matrix Notation<br />
∑ ( )<br />
%P K 0 + K n ⋅L n %P K⋅L<br />
n<br />
L 0 1<br />
53
An NIR Calibration Defines:<br />
• The wavelengths used<br />
• Few wavelengths<br />
• Many wavelengths<br />
• All available wavelengths<br />
• The form of the equation<br />
• Usually linear sum of products<br />
• Data pretreatment required<br />
• Derivative math (smoothing, gap)<br />
• Scatter correction<br />
• Specific coefficients associated with data<br />
collected at each wavelength or linear<br />
combination of wavelengths<br />
Typical Wheat NIRT Spectrum<br />
200<br />
Coefficient Absorbance Value<br />
3.2<br />
100<br />
3.1<br />
0<br />
3<br />
100<br />
2.9<br />
0<br />
200 2.8<br />
860 880 900 920 940 960 980 1000 1020 1040<br />
Wavelength (nm)<br />
.<br />
54
Wheat Protein Calibration Coefficients<br />
200<br />
Coefficient Value<br />
100<br />
0<br />
100<br />
0<br />
200<br />
860 880 900 920 940 960 980 1000 1020 1040<br />
Wavelength (nm)<br />
.<br />
Products of Spectral Values and Coefficients<br />
+<br />
∑ ( )<br />
%P K 0<br />
n<br />
K n ⋅L n<br />
55
NIRS Calibration Visualization<br />
• “Simple” geometric interpretation<br />
• Extensible to many dimensions<br />
• Unifies calibration methods<br />
Calibration Contours:<br />
Surfaces of Constant Predicted Values<br />
% C K + K L + ⋅⋅⋅+<br />
= 0 1 1<br />
K n L n<br />
0 = ( K + K L + K L<br />
0<br />
− % C)<br />
1<br />
1<br />
2<br />
2<br />
0 =<br />
B + Mx +<br />
Ny<br />
y= -(B/N)-(M/N)x y=a+bx<br />
56
Technicon 400 Wheat Moisture<br />
Calibration Contour Lines and Data<br />
0=(3.05-%M) + 63.4*L 1940 - 58.5*L 2230<br />
12% M<br />
K 1940 = 63.4<br />
Log (1/R) @ 1940 nm<br />
0.55<br />
10% M<br />
8% M<br />
No effect<br />
on results<br />
0.5<br />
0.4 0.45<br />
Log (1/R) @ 2230 nm<br />
K 2230 = -58.5<br />
Thinking in Spectral Space<br />
Log 1/R values shown as points in spectral space<br />
1680 nm<br />
Data shown as spectra<br />
0.5<br />
Log(1/R)<br />
0.4<br />
2100 nm<br />
0.3<br />
2180 nm<br />
( L 〈〉 2 , L 〈〉 3 , L 〈〉 5 )<br />
0.2<br />
1600 1700 1800 1900 2000 2100 2200<br />
Wavelength (nm)<br />
57
3-Wavelength NIRR Data and Calibration<br />
Contour Planes:<br />
12, 14, 16 % Protein<br />
1680 nm, K= -131.5<br />
2100 nm,<br />
K= -337.8<br />
2180 nm, K= 426.6<br />
L < 2><br />
, L < 3><br />
, L < 5><br />
, ( XY , , Z12)<br />
, ( XY , , Z14)<br />
, ( XY , , Z16)<br />
3-Wavelength NIRR Data and<br />
Calibration Contour Planes:<br />
12, 14, 16 % Protein<br />
1680 nm , K= -131.5<br />
2180 nm,<br />
K= 426.6<br />
2100 nm,<br />
K= -337.8<br />
L < 2><br />
, L < 3><br />
, L < 5><br />
, ( XY , , Z12)<br />
, ( XY , , Z14)<br />
, ( XY , , Z16)<br />
58
3-Wavelength NIRR Data and Calibration<br />
Contour Planes:<br />
12, 14, 16 % Protein<br />
1680 nm , K= -131.5<br />
2180 nm,<br />
K= 426.6<br />
2100 nm,<br />
K= -337.8<br />
L < 2><br />
, L < 3><br />
, L < 5><br />
, ( XY , , Z12)<br />
, ( XY , , Z14)<br />
, ( XY , , Z16)<br />
Generalized Calibration Contours of<br />
Constant Predicted Values<br />
0 1<br />
= ( K −%<br />
C)<br />
+ K L + ... + K L 0<br />
1<br />
n n<br />
Dimensions (n) Contour Type<br />
1 Points<br />
2 Lines<br />
3 Planes<br />
>3 Hyperplanes<br />
59
Calibration Contours for<br />
Linear Equations<br />
• Contours are linear (straight/flat).<br />
• Contours are parallel.<br />
• Contours of regular prediction increments are<br />
evenly placed in spectral space.<br />
• Wavelength axes with zero coefficients are<br />
parallel to contours.<br />
Calibration Contours for Linear<br />
Equations<br />
• All linear calibration methods attempt to find<br />
the direction, spacing, and offset of the<br />
“calibration contours” that maximize<br />
sensitivity to the desired quantity while<br />
minimizing the effects of interfering factors.<br />
• Multiple linear regression, Fourier regression,<br />
principal components regression, and partial<br />
least squares regression are basically<br />
equivalent in that sense.<br />
• Each method has certain advantages for<br />
finding the optimum solution.<br />
60
Calibration Contours for<br />
Non-Linear Equations<br />
• Non-linear calibrations<br />
• Artificial Neural Networks<br />
• Support Vector Machines<br />
• Some data pre-treatments<br />
• Same as for linear calibrations except:<br />
• Contours are not linear (not straight/flat).<br />
• Contours are not parallel.<br />
• Contours of regular prediction increments are not<br />
evenly placed in spectral space.<br />
• The “curviness” of the contours depends on how<br />
non-linear the equations are.<br />
Statistics for Evaluating Calibrations<br />
61
Bias<br />
Bias or<br />
Mean Error<br />
N<br />
∑<br />
i =<br />
1<br />
y pi − y<br />
( i )<br />
N<br />
SD( y)<br />
Population<br />
Standard Deviation<br />
i<br />
N<br />
∑<br />
=<br />
1<br />
( ) 2<br />
y i − mean( y)<br />
N − 1<br />
• Average prediction<br />
residuals for a data set.<br />
• The differences<br />
between predicted and<br />
reference values are<br />
“errors” or “residuals.”<br />
• A measure of the<br />
“scatter” in data set.<br />
y p : predicted values<br />
y : reference values<br />
N: number of observations<br />
Standard Error of Estimate or<br />
Standard Error of Calibration<br />
SEE<br />
SEC<br />
i<br />
N<br />
∑<br />
= 1<br />
N<br />
(<br />
y pi − y i ) 2<br />
− K − 1<br />
• Standard deviation of the residuals within the<br />
calibration data set.<br />
• Corrected for the number of degrees of freedom by<br />
“K” in the denominator. K is number of coefficients.<br />
• Estimates calibration accuracy for unknown samples.<br />
62
Standard Error of Prediction<br />
Standard Error of Performance<br />
SEP<br />
i<br />
N<br />
∑<br />
=<br />
1<br />
⎡<br />
⎣<br />
y pi<br />
− − mean y p − y<br />
y i<br />
(<br />
N − 1<br />
( )<br />
2<br />
⎤<br />
⎦<br />
• Standard deviation of the residuals due to<br />
differences between predicted and reference<br />
values for samples NOT in calibration set.<br />
• Note exclusion of the mean difference.<br />
Coefficient of Multiple Determination<br />
“R-squared”<br />
N<br />
∑<br />
R 2 i = 1<br />
N<br />
∑<br />
i = 1<br />
(<br />
y pi − mean ( y ) ) 2<br />
( ) 2<br />
y i − mean( y)<br />
y p<br />
y<br />
predicted<br />
reference<br />
• Gives the fraction of the population variance that<br />
is “explained” by the regression.<br />
• Population variance= square of population<br />
standard deviation.<br />
63
Relative Performance Determinant (RPD)<br />
Estimate of Practical Value<br />
RPD<br />
SD pop<br />
SEC<br />
1<br />
1 − R 2<br />
(Approx.)<br />
RPD<br />
Practical Value<br />
10 Excellent<br />
5 Good<br />
2.5 Dubious (screening?<br />
1<br />
Relationship between RPD and R 2<br />
10<br />
9<br />
8<br />
7<br />
6<br />
10<br />
9<br />
8<br />
7<br />
6<br />
X<br />
RPD<br />
5<br />
RPD<br />
5<br />
4<br />
3<br />
2<br />
1<br />
4<br />
3<br />
2<br />
1<br />
X<br />
0<br />
0 0.1 0.2 0.3 0.4 0.5 0.6 0.7 0.8 0.9 1<br />
R-squared<br />
0<br />
0.8 0.82 0.84 0.86 0.88 0.9 0.92 0.94 0.96 0.98 1<br />
R-squared<br />
R 2 of 0.90 gives RPD of only 3<br />
RPD of 10 requires R 2 of 0.99<br />
64
Overview of Chemometric Methods<br />
• Spectra as Vectors<br />
• Multiple Linear Regression<br />
• Principal Component Regression<br />
• Partial Least Squares Regression<br />
• Artificial Neural Networks<br />
Dimensionality of Spectral Space<br />
• A spectrum defines a point in spectral space<br />
(but we can’t plot more than three<br />
dimensions).<br />
• The number of dimensions = number of<br />
variables (wavelengths)<br />
• Number of wavelengths is usually determined<br />
by the instrumentation.<br />
• How many wavelengths are needed?<br />
• Why not use all available wavelengths?<br />
65
Vector Characteristics<br />
Length of vector<br />
Normalized vector<br />
v<br />
vn<br />
v<br />
∑ ( n )2<br />
n<br />
v<br />
vn 1<br />
v<br />
Orthogonal vectors<br />
v1⋅v2<br />
0<br />
Orthonormal vectors<br />
vn1 1 vn2 1 vn1 ⋅vn2<br />
0<br />
Length = 1 and<br />
mutually “perpendicular”<br />
(vector product = 0)<br />
Basis vectors<br />
• A vector space is the combination of all possible<br />
vectors in the system considered.<br />
• Line: 1-D vector space<br />
• Plane: 2-D vector space<br />
• Volume: 3-D vector space<br />
• NIRS spectra: 10, 100, 700, etc.-D vector space<br />
• For n-dimensional vector space any vector (or<br />
any point in space) can be exactly expressed as a<br />
linear combination of n linearly independent basis<br />
vectors. That is, none of the basis vectors can be<br />
expressed as a linear combination of the other basis<br />
vectors.<br />
66
Multiple Linear Regression (MLR)<br />
y Xb b ( X T ⋅X)<br />
− 1<br />
⋅X T ⋅y<br />
• Mathematically extend simple linear<br />
regression to multiple independent variables<br />
• If rows or columns of X are not independent,<br />
the inverse “blows up”<br />
• High correlation between wavelengths<br />
(multicollinearity) makes regression noisy,<br />
unstable<br />
• Need to reduce correlation between<br />
independent variables<br />
Why reduce dimensionality<br />
( number of fitted coefficients)?<br />
• Using many independent variables leads to "overfitting"<br />
of the data.<br />
• Very large coefficients<br />
• Larger calibration transferability errors<br />
• Greater sensitivity to random noise<br />
• Overly optimistic performance estimates<br />
• General recommendations call for about 10<br />
independent calibration samples for each<br />
coefficient fitted.<br />
• Very large sample sets are needed to avoid overfitting<br />
and other problems with large numbers of<br />
variables.<br />
67
Why reduce dimensionality?<br />
Wheat Protein Coefficients<br />
1.5 . 10 4 PLS Coefficients<br />
1 . 10 4<br />
Coefficient Value)<br />
5000<br />
0<br />
5000<br />
1 . 10 4<br />
1.5 . 10 4<br />
860 880 900 920 940 960 980 1000 1020 1040<br />
Wavelength (nm)<br />
.<br />
MLR with 50 wavelengths<br />
MLR with 100 wavelengths<br />
MLR with 4 wavelengths<br />
Multiple Linear Regression Model<br />
X<br />
Weights (B-coefficients)<br />
X<br />
Inputs<br />
X<br />
X<br />
∑<br />
B0<br />
Output<br />
1<br />
68
Multiple Linear Regression<br />
• Find limited number of most useful<br />
independent variables<br />
• Step up<br />
• Step down<br />
• Step up, down, up, down<br />
• All possible combinations<br />
Another way: Define new “latent” variables<br />
(basis vectors) that are linear combinations of<br />
data from all wavelengths<br />
• Fourier regression<br />
• Sine and cosine functions<br />
• Principal components regression<br />
• Principal components<br />
• Directions in space that explain most variance<br />
• Partial least squares<br />
• Loading factors<br />
• Directions in space that are most highly correlated<br />
to constituent of interest<br />
• Each of these simply define orthonormal sets<br />
of basis vectors in spectral space.<br />
69
Assume that we want to<br />
“describe” a spectrum<br />
Sines and Cosines as Basis Vectors<br />
70
Calculate T-scores<br />
• Use projection (sum of products) to test “how much” of<br />
each basis vector is represented in each of the spectra.<br />
• The result is the Discrete Fourier Transform of the spectrum<br />
1<br />
SS q :=<br />
CS q :=<br />
〈〉<br />
L⋅SIFN q<br />
〈〉<br />
L⋅COFN q<br />
Fourier T Scores<br />
SS q<br />
CS q<br />
0.5<br />
0<br />
0.5<br />
1<br />
.<br />
1.5<br />
0 5 10 15 20<br />
q<br />
Factor Number<br />
Reconstruct the spectrum from basis<br />
vectors and T-Scores<br />
“Length” of residual<br />
(unexplained) spectrum<br />
71
Can’t we find something more efficient<br />
than sines and cosines to describe spectra?<br />
• Yes! Principal components<br />
• Eigenvectors of the variance-covariance matrix<br />
• Find the set of directions in spectral space that<br />
explain the most variance.<br />
• The first principal component is in the direction of the<br />
greatest variation.<br />
• Second is in the direction of the greatest variation<br />
after the first component direction is removed.<br />
• Etc.<br />
• It’s like squishing a football!<br />
First principal component<br />
72
Second principal component<br />
Third principal component<br />
73
Principal components in wavelength space<br />
Normalized Principal Components<br />
Display the final three principal component vectors.<br />
1<br />
0.5<br />
0<br />
0.5<br />
1<br />
1600 1700 1800 1900 2000 2100 2200<br />
PC1<br />
PC2<br />
PC3<br />
Wavelength (nm)<br />
Principal Components in 100 Dimensions<br />
74
Partial Least Squares Factors: Directions most<br />
highly correlated with desired constituent<br />
Log 1/R Values, Normalized Weights, and B-Vector in Centered Log Space<br />
W3<br />
B-vector<br />
W1<br />
W2<br />
( LC 〈〉 0 , LC 〈〉 1 , LC 〈〉 2 ),( Wn1x, Wn1y,<br />
Wn1z)<br />
, ( Wn2x, Wn2y,<br />
Wn2z)<br />
,( Wn3x, Wn3y,<br />
Wn3z)<br />
, ( BVx, BVy,<br />
BVz)<br />
Bilinear Models<br />
Loading coefficients<br />
Sine & Cosines, PC’s,<br />
PLS factors, etc.<br />
“How much” of each basis vector<br />
is in the input spectrum?<br />
T-scores<br />
∑<br />
Chemical<br />
Weights (from MLR)<br />
∑<br />
“Raw”<br />
Inputs<br />
∑<br />
∑<br />
Output<br />
∑<br />
1<br />
B0<br />
∑<br />
75
Creating Bilinear Prediction Equations<br />
Find “chemical weights” from T-scores and<br />
chemistry with MLR.<br />
CW TS T − 1<br />
:= ( ⋅TS)<br />
⋅TS T ⋅C<br />
Form B-vector from basis vector matrix and<br />
chemical weights<br />
BV<br />
BasisVectors ⋅ChemicalWeights<br />
Predict chemical values from B-vector and<br />
spectra<br />
CPred<br />
L⋅BV<br />
Artificial Neural Network Models<br />
“Hidden” layer<br />
weights v i,j<br />
∑<br />
∑<br />
Non-Linear<br />
Transfer function<br />
∫<br />
Output layer<br />
weights w j<br />
∑<br />
1<br />
“Raw”<br />
Inputs<br />
∑<br />
∑<br />
∑<br />
∑<br />
1<br />
∑<br />
∫<br />
∫<br />
∑<br />
1<br />
∫<br />
Output<br />
Pre-process to create orthogonal<br />
normalized input variables<br />
x p,i<br />
y p,j z p<br />
1<br />
76
Artificial Neural Networks<br />
• Massively interconnected “nodes” simulate<br />
neuron connections in the brain.<br />
• Inputs at each node are summed and applied<br />
to special non-linear “transfer function.”<br />
• May have multiple layers of nodes and<br />
weights.<br />
• May have multiple outputs.<br />
• Networks are “trained” by iterative search for<br />
minimum error.<br />
Methods for Detecting “Outliers”<br />
• Create calibrations to “look” for suspected<br />
adulterants.<br />
• Detect extreme examples of spectra (leverage).<br />
• Detect spectra that weren’t represented in the<br />
calibration (spectral residuals).<br />
• Other?<br />
77
1985!<br />
Mahalanobis Distance<br />
H= 2.5<br />
x<br />
2 σ<br />
3 σ<br />
1 σ<br />
Distances are normalized<br />
by the standard deviation of<br />
population variation in the<br />
specified “direction”.<br />
“Global” distance from center<br />
of population.<br />
“Local” distance between points<br />
representing different spectra.<br />
78
Triplets of Principal Component Scores in<br />
3D Space with Chemical Weight Vector<br />
Not Normalized<br />
Principal Component Scores Plotted<br />
Normalized<br />
TN i<br />
T i<br />
StDev( T)<br />
Global Mahalanobis Distances<br />
Normalized Distances from Population Center<br />
Global Mahalanobis Distance (normalized)<br />
X<br />
3<br />
2<br />
1<br />
0<br />
0 20 40 60 80 100 120 140 160 180 200 .<br />
Sample Index<br />
79
Maximum T-Scores<br />
Maximum T-Score for Sample<br />
15<br />
X<br />
10<br />
5<br />
0<br />
0 20 40 60 80 100 120 140 160 180 200<br />
Sample Index<br />
Local Mahalanobis Distances<br />
Comparing All Pairs of Spectra<br />
Sample Index<br />
Sample Index<br />
Greatest<br />
Distance<br />
Medium<br />
Distance<br />
Closest<br />
80
Principal Component Spectral Decomposition<br />
Spectral Residual (unexplained)<br />
(HRWW, 16 factors)<br />
1.4<br />
X<br />
1.2<br />
Sjpectral Residual (x 1000)<br />
1<br />
0.8<br />
0.6<br />
0.4<br />
0.2<br />
0<br />
0 50 100 150 200<br />
.<br />
Sample Index<br />
81
Causes of Large Spectral Residuals<br />
• Instrument noise<br />
• Sample or instrument temperature extremes<br />
• Poor instrument standardization<br />
• Unusual sample physical condition<br />
• Sample adulteration<br />
Automatic Outlier Detection to<br />
Detect Adulteration<br />
• Instruments offer automatic outlier detection<br />
• Constituent ranges<br />
• Mahalanobis distance<br />
• Spectral residuals<br />
• Difficult to set outlier criteria to avoid false<br />
positives<br />
• Need to test outlier capabilities to detect<br />
adulteration<br />
• Need processes to follow up on “hits”<br />
82
Summary and Implications<br />
• Near-infrared spectroscopy has fostered<br />
many mathematical methods for dealing with<br />
difficult data such as found in NIRS.<br />
• The bilinear methods (FR, PCR, PLS) are<br />
fundamentally very similar except for the<br />
choice of basis vectors.<br />
• ANN calibrations can deal with greater data<br />
complexity and nonlinearity—at the price of<br />
needing many more calibration and validation<br />
samples.<br />
• Chemometric methods offer outlier detection.<br />
Wisconsin Center for Dairy Research<br />
A dairy perspective on the<br />
use and applications,<br />
challenges ahead<br />
<strong>US</strong>P Food Protein Workshop<br />
Developing a Toolbox of Analytical Solutions to Address Adulteration<br />
June 16 – 17, 2009<br />
<strong>US</strong>P Headquarters, Rockville, Maryland<br />
Juan Romero<br />
Coordinator Analytical Services<br />
83
Why Milk ?<br />
Amino<br />
acid<br />
score<br />
Digestibility<br />
% PDCAAS PER<br />
Egg 121 98 118 3.8<br />
Milk 127 95 121 3.1<br />
Beef 94 98 92 2.9<br />
Wheat 47 91 42 1.5<br />
International Dairy Federation<br />
• Membership<br />
• 56 Countries<br />
• 86% World Milk Production<br />
• Advisor to Codex<br />
• CCMMP<br />
• CCMAS<br />
• CCNFSDU<br />
• Analytical methods<br />
• ISO<br />
• CEN<br />
• DHIA<br />
• ICAR<br />
84
AFTERMATH OF THE CHINA MILK ADULTERATION<br />
SCANDAL<br />
Situation:<br />
• Trust in the (regional) dairy sector is suffering<br />
• Market requests to test dairy products for presence of<br />
melamine & cyanuric acid<br />
IDF actions aiming at (re)building trust:<br />
• Provision of methods to determine the presence of<br />
melamine & cyanuric acid in dairy products (short<br />
term)<br />
• Provision of effective and recognized approaches to<br />
counteract intentional adulteration (long term)<br />
OBJECTIVE OF THE IDF TASK FORCE<br />
Provide a non-prescriptive inventory of means (tools,<br />
procedures, methods, including screening<br />
techniques, etc) that:<br />
• can be used alone or in combination to indicate systematic<br />
and/or large scale adulteration of suppliers´ milk,<br />
• are internationally recognized as effective and appropriate,<br />
• are intended to assist the dairy sector in showing due diligence<br />
by selecting the most feasible approaches that suit the specific<br />
and local needs<br />
85
KEY PRINCIPLES IN FOOD CHAIN MANAGEMENT<br />
• Adequate food safety skills<br />
All players along the food chain should have a general understanding of the nature and impact of<br />
all hazards that may occur at all stages in the food chain, and an in-depth understanding of<br />
those hazards that need be controlled at the step(s) for which they are responsible<br />
• Reliable suppliers<br />
Suppliers of products (ingredients or raw materials) and services should only be accepted by the<br />
receiving food business if it has been approved and/or recognized (certified or else) as<br />
being able to meet agreed outputs and/or to follow agreed procedures<br />
• Shared responsibility<br />
The individual food business responsible for a particular step in the food chain has the primary<br />
responsibility for meeting the requirements with regard to the safety of their products and<br />
services, when they are supplied to the subsequent step of the food chain<br />
• Effective communication<br />
Food businesses involved in the same food chain* should establish effective communication with<br />
the other key players operating in the same chain<br />
DEVIATIONS<br />
Unintentional deviations<br />
• Caused by accidents, failures and/or ignorance<br />
• Foreseen/known from experience and risk assessments<br />
• Sporadic in nature<br />
• Preventive measures can be targeted (i.e. efficient)<br />
Intentional deviations<br />
• Driven by economic gains(fraud, crime)<br />
• Difficult to foresee<br />
• Systematic in nature<br />
• Preventive measures difficult to target (i.e. not likely to be<br />
efficient)<br />
86
COUNTERACTING FRAUD<br />
Assessment of vulnerability for fraud<br />
• Payment system<br />
Criminal gain related to the value of individual components of the<br />
payment scheme (fat, protein, snf, volume, quality parameters)<br />
• Milk collection infra-structure<br />
Number of steps involved, communication patterns, and degree of<br />
commitment (feeling of “ownership” and responsibility)<br />
COUNTERACTING FRAUD<br />
Preventive measures<br />
•Procurement strategy motivating high standards<br />
Examples include continuous communication, training & education (farmers & vets),<br />
providing advisory services, farm QA programs, etc)<br />
•Monitoring procedures on individual farmers milk<br />
– Benchmarking/trend analysis<br />
– Gathering of intelligence.<br />
Awareness of these activities reduces potential for fraud in the supply chain<br />
•Bio-security measures during transports<br />
To prevent milk from being tampered<br />
87
OUTLINE OF THE IDF INVENTORY<br />
1. Introduction<br />
2. Purpose, scope and use<br />
3. Maintaining the integrity of the food chain<br />
4. Assessment of the vulnerability for adulteration of<br />
milk<br />
5. Measures suitable for the purpose of counteracting<br />
possible adulteration<br />
– Preventive measures<br />
– Benchmarking and trend analyses<br />
– Intelligence gathering<br />
FTIR technology for routine<br />
milk screening<br />
Steve Holroyd<br />
Per Waaben Hansen (Foss)<br />
88
What is FTIR?<br />
• Fourier transform infrared<br />
spectroscopy<br />
• Allows rapid quantification of<br />
composition of complex<br />
matrices<br />
• Uses absorption of infrared<br />
frequency radiation<br />
• Fourier transform –<br />
mathematical function used<br />
for collecting data<br />
177<br />
Milk and water FTIR spectra<br />
178<br />
89
Milk – water difference spectrum<br />
Lactose<br />
Protein<br />
Fat<br />
179<br />
Quantification<br />
• The amount of infrared<br />
absorption is directly<br />
proportional to the<br />
concentration of an absorbing<br />
chemical bonds<br />
• Allows precise quantification<br />
of concentration<br />
• Must have reliable<br />
instrumentation and link to<br />
calibration from chemically<br />
known samples<br />
180<br />
90
How a rapid screening method can work<br />
• FTIR is already used widely for<br />
rapid compositional analysis of<br />
liquid dairy products<br />
Two potential methods to detect<br />
economic adulteration of milk:<br />
• Quantitative - a calibration for a<br />
specific adulterant<br />
• Qualitative – a method for<br />
differentiating adulterated and<br />
non-adulterated milk<br />
181<br />
Quantitative analysis<br />
• Use the relationship between absorption and<br />
concentration to measure specific adulterants<br />
• Adulterants must have different spectral signatures<br />
and absorption strengths<br />
• Detection will be dependent upon the type of<br />
adulterant<br />
• Must create a calibration set with known reference<br />
values<br />
182<br />
91
Difference spectrum - melamine<br />
Melamine dissolved in milk - FT6000<br />
absorbance difference<br />
0.1<br />
0.05<br />
0 ppm<br />
250 ppm<br />
500 ppm<br />
1000 ppm<br />
1500 ppm<br />
2000 ppm<br />
2500 ppm<br />
3000 ppm<br />
0<br />
1600<br />
1500<br />
1400<br />
1300 1200<br />
wavenumber<br />
1100<br />
1000<br />
183<br />
Difference spectrum – ammonium sulphate<br />
Ammonium sulphate dissolved in milk<br />
absorbance difference<br />
0.1<br />
0.05<br />
0 ppm<br />
500 ppm<br />
1000 ppm<br />
2000 ppm<br />
3000 ppm<br />
4000 ppm<br />
5000 ppm<br />
6000 ppm<br />
0<br />
1600<br />
1500<br />
1400<br />
1300 1200<br />
wavenumber<br />
1100<br />
1000<br />
184<br />
92
Difference spectrum - urea<br />
Urea dissolved in milk<br />
absorbance difference<br />
0.1<br />
0.05<br />
0 ppm<br />
250 ppm<br />
500 ppm<br />
1000 ppm<br />
1500 ppm<br />
2000 ppm<br />
2500 ppm<br />
3000 ppm<br />
0<br />
1600<br />
1500<br />
1400<br />
1300 1200<br />
wavenumber<br />
1100<br />
1000<br />
185<br />
FTIR to quantify melamine in milk<br />
Added melamine, ppm<br />
1000<br />
900<br />
800<br />
700<br />
600<br />
500<br />
57 samples in 3 replicates<br />
%CV: RMSEP=8.31 SEP=8.33 SEPCorr=8.35 SDrep=3.77<br />
Slope: 1.0013<br />
Intcpt: -1.8636<br />
r: 0.9969<br />
Bias : -1.4116<br />
400<br />
300<br />
200<br />
100<br />
0<br />
0 100 200 300 400 500 600 700 800 900 1000<br />
186<br />
FT-IR detected melamine, ppm<br />
93
Quantification of specific adulterants<br />
• With the current generation of FTIR instruments, the<br />
melamine LoD (Limit of Detection) is 75-100 ppm<br />
(0.0075-0.0100 %)<br />
• Hurdles for use in routine screening<br />
– The adulterant must be known<br />
– A large number of samples must be collected to<br />
ensure robustness over time<br />
– Good reference results must be available<br />
187<br />
Qualitative analysis<br />
• Assess the “quality” of normal milk via FTIR spectra<br />
• Use statistical techniques to distinguish variation<br />
greater than “routine”<br />
• Principal component analysis – PCA<br />
– A data reduction technique<br />
188<br />
94
2000 FTIR spectra of liquid milk<br />
189<br />
Principal component analysis<br />
• An orthogonal linear transformation<br />
• Separates out the major features of variation from a<br />
large data matrix<br />
• Transforms a large number of possibly correlated<br />
variables (spectra) into a smaller number of variables<br />
called principal components<br />
• Plot principal components against each other and<br />
establish trends<br />
190<br />
95
Deliberately adulterated milk by FTIR and PCA<br />
0.15<br />
0.1<br />
• Normal milk<br />
• Adulterated milk<br />
Melamine+water<br />
Cyanuric acid<br />
Score PC5<br />
0.05<br />
0<br />
Urea<br />
Melamine<br />
-0.05<br />
Ammonium sulphate<br />
-0.1<br />
191<br />
-0.5 -0.4 -0.3 -0.2 -0.1 0 0.1 0.2 0.3 0.4<br />
Score PC2<br />
FTIR for qualitative analysis<br />
• Gather spectral information from ”normal milk”<br />
– Critical that no adulteration is present in such data sets<br />
• No reference measurements needed<br />
• Spectra from unknown samples, deviating from ”normal<br />
milk”, can be identified to a certain level<br />
• The LoD for un-specific adulteration is higher than for<br />
specific adulteration<br />
– The LoD for melamine as unknown adulterant is 250-<br />
500 ppm (0.025-0.050%)<br />
192<br />
96
Essential features<br />
• FTIR must be in widespread and effective routine use<br />
– Instruments properly maintained<br />
– Calibrations up to date<br />
• Sensitivity to potential adulteration must be<br />
demonstrated<br />
• Calibration models may be created to cover individual<br />
sample types, sites, regions, countries, breeds. Some<br />
current composition models are global in nature<br />
193<br />
Challenges<br />
• FTIR not sensitive at low concentration levels – will<br />
not detect trace adulteration or contamination<br />
• Knowledge of normal variation vs variation due to<br />
adulteration<br />
• Must ensure unadulterated milks used to define<br />
“normal” and data must cover routine variation in milk<br />
spectral data<br />
• Must keep model up to date with new “normal” data<br />
194<br />
97
FTIR Summary<br />
• FTIR is an excellent rapid tool for determining liquid<br />
milk composition<br />
• FTIR can be used to detect economic adulteration of<br />
milk using commercially available equipment<br />
• Quantitative analysis<br />
– Requires knowledge of the adulterant<br />
• Qualitative analysis<br />
– Requires an understanding of FTIR variation in<br />
“good” milk<br />
195<br />
The Future of FTIR<br />
• A robust network of FTIR instruments measuring milk<br />
• Each instrument compares the spectrum of every<br />
sample to a spectral database of normal milks<br />
• A red flag appears if any samples deviate<br />
• A mechanism is in place to identify an causes of<br />
deviation<br />
196<br />
98
IDF-ISO Guideline to the measurement of MEL and<br />
CYA<br />
• Guideline to the measurement of Melamine and<br />
Cyanuric Acid<br />
• LC-MS/MS<br />
• Performance Criteria<br />
– 2002/657/EC. Performance of analytical<br />
methods and the interpretation of results<br />
– ISO 11843. Capability of detection – Parts 1-5<br />
LC-MS/MS<br />
• Any method which combines either high performance liquid<br />
chromatography (HPLC) or ultra performance liquid<br />
chromatography (UPLC) with a triple quadrupole mass<br />
spectrometry instrument.<br />
• Ionization shall be performed by either electrospray (ESI),<br />
atmospheric pressure chemical ionization (APCI), atmsopheric<br />
pressure photospray ionization (APPI) or any other ionization<br />
mode with appropriate performance.<br />
• The acquisition mode shall be carried out in the selected<br />
reaction monitoring (SRM) mode. The quantification of both<br />
melamine and cyanuric acid is based on an isotope dilution<br />
approach using isotope stable internal standards for both<br />
analytes.<br />
99
A dairy perspective on the use and<br />
applications, challenges ahead<br />
Questions<br />
Food Protein Workshop: Developing a Toolbox of Analytical<br />
Solutions to Address Adulteration<br />
<strong>US</strong>P Headquarters, Rockville, Maryland<br />
<strong>US</strong>P Meeting Center<br />
Wednesday, June 17, 2009<br />
6a. <strong>Breakout</strong> <strong>Session</strong> A<br />
Possibilities of FTIR and NIR for the detection of adulteration<br />
in food and feed<br />
By<br />
Jürgen Möller<br />
FOSS Analytical, Sweden<br />
Dedicated Analytical Solutions<br />
100
TCD – Team Chemometric Devopment contribution<br />
”FT-IR for the detection of adulteration in milk”<br />
Per Waaben Hansen, Ph. D., R & D Scientist,<br />
FOSS Analytical A/S, Denmark<br />
”NIR possibilities for the detection of adulterants”<br />
Martin Lagerholm, Ph.D., R & D Scientist<br />
FOSS Analytical AB, Sweden<br />
Dedicated Analytical Solutions<br />
Where we come from…<br />
Höganäs<br />
• ….<br />
Hilleröd<br />
Copenhagen<br />
Dedicated Analytical Solutions<br />
101
Adulteration of milk<br />
• Milk trade is often based on weight<br />
- Fraudulently added water is a general problem<br />
• Authorities therefore check for added water by analysing for a protein decrease<br />
- Kjeldahl (total N) is used<br />
• Kjeldahl detects all types of N – i.e. not only protein<br />
- Melamine is rich in N and therefore a popular adulterant<br />
- 0.3 % added melamine corresponds to an artificial protein increase of<br />
approx. 1.2 %<br />
Dedicated Analytical Solutions<br />
Consumer protection and prevention of adulterations<br />
• Detection of adulterants at contamination levels is<br />
obviously important for consumer protection and<br />
tracking of adulterations<br />
• For the prevention of adulteration fast and simple<br />
analytical solutions are needed to detect fraud already<br />
at collection points and payment stations for the raw<br />
material<br />
• Different analytical challenges?<br />
- Contamination levels: ppb – ppm<br />
- Fraudulent addition levels: 0,1% - 1%<br />
Dedicated Analytical Solutions<br />
102
Melamine<br />
66% Nitrogen<br />
”Protein” content = >400%<br />
Solubility in water: 3,2 g/l<br />
Dedicated Analytical Solutions<br />
FTIR spectra of Melamine<br />
Melamine dissolved in milk - FT6000<br />
absorbance difference<br />
0.1<br />
0.05<br />
0 ppm<br />
250 ppm<br />
500 ppm<br />
1000 ppm<br />
1500 ppm<br />
2000 ppm<br />
2500 ppm<br />
3000 ppm<br />
0<br />
1000 1100 1200 1300 1400 1500 1600<br />
wavenumber<br />
Dedicated Analytical Solutions<br />
103
FTIR spectra of Urea<br />
Urea dissolved in milk - FT6000<br />
absorbance difference<br />
0.1<br />
0.05<br />
0 ppm<br />
250 ppm<br />
500 ppm<br />
1000 ppm<br />
1500 ppm<br />
2000 ppm<br />
2500 ppm<br />
3000 ppm<br />
0<br />
1000 1100 1200 1300 1400 1500 1600<br />
wavenumber<br />
Dedicated Analytical Solutions<br />
FTIR spectra of Ammonium sulphate<br />
Ammonium sulphate dissolved in milk - FT6000<br />
absorbance difference<br />
0.1<br />
0.05<br />
0 ppm<br />
500 ppm<br />
1000 ppm<br />
2000 ppm<br />
3000 ppm<br />
4000 ppm<br />
5000 ppm<br />
6000 ppm<br />
0<br />
1000 1100 1200 1300 1400 1500 1600<br />
wavenumber<br />
Dedicated Analytical Solutions<br />
104
FTIR: Adulterants have different mid-IR signatures<br />
Melamine dissolved in milk - FT6000<br />
Urea dissolved in milk - FT6000<br />
absorbance difference<br />
0.1<br />
0.05<br />
0 ppm<br />
250 ppm<br />
500 ppm<br />
1000 ppm<br />
1500 ppm<br />
2000 ppm<br />
2500 ppm<br />
3000 ppm<br />
absorbance difference<br />
0.1<br />
0.05<br />
0 ppm<br />
250 ppm<br />
500 ppm<br />
1000 ppm<br />
1500 ppm<br />
2000 ppm<br />
2500 ppm<br />
3000 ppm<br />
0<br />
1000 1100 1200 1300 1400 1500 1600<br />
0<br />
1000 1100 1200 1300 1400 1500 1600<br />
wavenumber<br />
wavenumber<br />
Ammonium sulphate dissolved in milk - FT6000<br />
0 ppm<br />
500 ppm<br />
1000 ppm<br />
2000 ppm<br />
3000 ppm<br />
• Adulterants have different spectral<br />
signatures, making it easy to distinguish<br />
even related compounds<br />
absorbance difference<br />
0.1<br />
0.05<br />
4000 ppm<br />
5000 ppm<br />
6000 ppm<br />
• Adulterants show different absorption at<br />
similar concentrations – detection limits<br />
are therefore dependent on the adulterant<br />
0<br />
1000 1100 1200 1300 1400 1500 1600<br />
wavenumber<br />
Dedicated Analytical Solutions<br />
Example: Limit of detection is lower if the adulterant is known<br />
1000<br />
900<br />
800<br />
57 samples in 3 replicates<br />
%CV: RMSEP=8.31 SEP=8.33 SEPCorr=8.35 SDrep=3.77<br />
Slope: 1.0013<br />
Intcpt: -1.8636<br />
r: 0.9969<br />
Bias : -1.4116<br />
Added melamine, ppm<br />
700<br />
600<br />
500<br />
400<br />
300<br />
200<br />
100<br />
0<br />
0 100 200 300 400 500 600 700 800 900 1000<br />
FT-IR detected melamine, ppm<br />
• With the current generation of FT-IR instruments, the melamine LoD (Limit of Detection) is 75-100 ppm<br />
(0.0075-0.0100 %)<br />
• However,<br />
- The adulterant must be known (in this case melamine)<br />
- A large number of samples must be collected to ensure robustness over time<br />
- Good reference results must be available<br />
Dedicated Analytical Solutions<br />
105
FTIR: Spectral integrity / Principle Component Analysis (PCA)<br />
0.15<br />
• Normal milk<br />
• Adulterated milk<br />
Cyanuric acid<br />
Score PC5<br />
0.1<br />
0.05<br />
0<br />
Melamine+water<br />
(diluted samples)<br />
Urea<br />
Melamine<br />
-0.05<br />
-0.1<br />
This particular score combination (PC 2 vs.<br />
PC 5) is good for detecting cyanuric acid or<br />
ammonium sulphate; other combinations<br />
can be used for detecting adulteration caused<br />
by melamine or urea<br />
Ammonium sulphate<br />
-0.5 -0.4 -0.3 -0.2 -0.1 0 0.1 0.2 0.3 0.4<br />
Score PC2<br />
Dedicated Analytical Solutions<br />
FTIR: Spectral integrity<br />
• By reasonable choice of ”factor” (% of unexplained variance) and ”threshold” (determines<br />
the detection limit and the number of acceptable false positives) PCA calibrations can<br />
successfully detect ”unnormal” samples<br />
Dedicated Analytical Solutions<br />
106
Spectral integrity in general (FTIR)<br />
• Only spectral information from ”normal milk” is needed<br />
- Critical that no adulteration is present in such data sets<br />
• No reference measurements needed (unless required to confirm that<br />
the milk samples are un-adulterated)<br />
• Spectra from unknown samples, deviating from ”normal milk”, can be<br />
identified<br />
• The reason for the deviation must be identified by alternative means<br />
• Models can be created to cover individual sample types, sites,<br />
regions, countries, depending on relevance<br />
Dedicated Analytical Solutions<br />
Spectral integrity, ctd.<br />
• The LoD (defined as 3xSEP) for un-specific<br />
adulteration is higher than for specific adulteration<br />
- The LoD for melamine as unknown adulterant is<br />
250-500 ppm (0.025-0.050 %)<br />
- The LoD for melamine as a known adulterant is 75-<br />
100 ppm<br />
• The LoD for other adulterants will be different from the<br />
LoD for melamine, and will depend on the absorptive<br />
intensity of the adulterant and on how much the<br />
spectrum differs from that of milk.<br />
Dedicated Analytical Solutions<br />
107
NIR spectra of pure Melamine and skim milk powder<br />
• Melamine<br />
• Skim milk powder<br />
Dedicated Analytical Solutions<br />
NIR example: PCA plot incl adulterated samples<br />
Cal set<br />
Test set 1<br />
Test set 2<br />
Dedicated Analytical Solutions<br />
108
NIR: Validation of melamine calibration<br />
Values in<br />
% melamine<br />
• Test set 1: 27 samples, SEP 0.03<br />
Dedicated Analytical Solutions<br />
NIR: Validation of NIR calibration<br />
Values in % melamine<br />
• Test set 2, 144 samples, SEP 0.05<br />
Dedicated Analytical Solutions<br />
109
NIR<br />
• Spiking experiments indicate a LoD of about 0,1 %<br />
melamine in milk powder<br />
• Using this LoD, a computer simulation of a database<br />
of 5000 spectra gave no false positive results<br />
• Using a similar spectral integrity technique as<br />
described above might be used to identify deviating<br />
patterns at higher levels, e.g. 0,3% melamine<br />
Dedicated Analytical Solutions<br />
Other sample types<br />
• Soybean meal<br />
- At levels around 45% protein Dumas and Kjeldahl methods show a standard<br />
deviation of reproducibility of about sdR = 0,4% protein, corresponding to<br />
about 0,1% melamine<br />
• Wheat flour<br />
- At levels around 13% protein the N-based methods show a standard<br />
deviation of reproducibility of about sdR = 0,2% protein, corresponding to<br />
about 0,05% melamine<br />
• Fraudulent additions of adulterants are supposingly made at levels above the<br />
measurement uncertainty of current N-based methods<br />
• Screening for adulterants at these levels seems to be feasable with NIR<br />
Dedicated Analytical Solutions<br />
110
Conclusions<br />
• FTIR and NIR are usually optimized for measuring quality<br />
parameters such as protein, fat etc<br />
• As these platforms are fast, cost-effective and widely used in the<br />
dairy and food processing industries it is of interest to further<br />
evaluate the extent to which they can be used to detect adulterations<br />
• Specific calibrations maybe developed and used for known<br />
adulterants<br />
• The analysis of spectral integrity offers a good chance of detecting<br />
higher levels of a broad range of adulterants, also of unknown nature<br />
• Spectra and reference data of unadulterated samples must be<br />
available<br />
• FTIR and NIR should only be used for screening at the raw material<br />
source or intake and should be complemented with other methods<br />
for final prove<br />
Dedicated Analytical Solutions<br />
“Advanced” Vibrational<br />
Spectroscopic Techniques for the<br />
Investigation of Adulterants<br />
Peter R. Griffiths<br />
Department of Chemistry<br />
University of Idaho<br />
Moscow, ID 83844-2343<br />
Food Protein Workshop: Developing a Toolbox of Analytical<br />
Solutions to Address Adulteration<br />
June 16 and 17, 2009: <strong>Breakout</strong> <strong>Session</strong>: “Theory and application<br />
of rapid mid-infrared, near-infrared and Raman methods and<br />
chemometrics to measure protein and prevent adulteration.”<br />
111
Mid-Infrared Spectroscopy:<br />
Attenuated Total Reflection<br />
Spectroscopy<br />
Melamine in infant formula<br />
Low-Concentration Melamine Detection with the IdentifyIR Diamond ATR Spectrometer, S.<br />
Sumair, P. E. Leary and J. A. Reffner, Spectroscopy Application Notebook, Feb 1, 2009.<br />
112
Detection limits: melamine in infant<br />
formula<br />
Low-Concentration Melamine Detection with the IdentifyIR Diamond ATR Spectrometer, S.<br />
Sumair, P. E. Leary and J. A. Reffner, Spectroscopy Application Notebook, Feb 1, 2009.<br />
Mid- and Near Infrared Diffuse<br />
Reflection Spectroscopy<br />
113
NIR/DR Spectrum of Pure Melamine,<br />
6 nm resolution<br />
Courtesy of Eli Margalith, Opotek Corporation<br />
NIR/DR Spectrum of Pure Melamine,<br />
2 nm resolution<br />
Courtesy of Eli Margalith, Opotek Corporation<br />
114
NIR/DR Spectra of Pure Gluten<br />
6 nm resolution<br />
2 nm resolution<br />
Courtesy of Eli Margalith, Opotek Corporation<br />
NIR/DR Spectra of Melamine<br />
and Infant Formula<br />
L. J. Mauer et al. J. Agric. Food Chem., 2009, 57 (10), pp 3974–3980<br />
115
Mid-Infrared Spectra of<br />
Melamine and Infant Formula<br />
Diffuse reflection<br />
spectra (no<br />
dilution in KBr)<br />
ATR spectra<br />
L. J. Mauer et al. J. Agric. Food Chem., 2009, 57 (10), pp 3974–3980<br />
Raman Spectroscopy<br />
116
RTA’s Portable Raman Analyzer<br />
Sample Compartment<br />
Advantages:<br />
• No sample preparation<br />
• Simple integration via fiber optics<br />
• Remote analysis, multi-component<br />
• Complete spectral coverage<br />
• Wavelength stability<br />
• Confident spectral subtraction<br />
• and library search/match<br />
• Real-time, On-demand analysis<br />
• Long term stability<br />
• Temperature and vibration immune<br />
• Shock resistant<br />
• 25 Pounds<br />
• 5 hour battery<br />
Providing Chemical Information When & Where You Need It<br />
Raman Spectra of Baby Milk Formula<br />
785 nm Laser<br />
1064 nm Laser<br />
Providing Chemical Information When & Where You Need It<br />
117
1% Melamine in Baby Milk Formula<br />
1% in Formula<br />
Pure Formula<br />
Difference spectrum<br />
Pure Melamine<br />
Providing Chemical Information When & Where You Need It<br />
Surface-Enhanced Raman<br />
Scattering (SERS)<br />
118
Surface-Enhanced Raman Scattering<br />
(SERS)<br />
Enhancement of the<br />
Raman spectrum of<br />
molecules on the<br />
surface of roughened<br />
silver or gold metal<br />
plates, colloids or<br />
nanoparticles.<br />
5-nm thick layer of silver<br />
SERS Spectrum of a Self-Assembled Monolayer<br />
of p-Nitrothiophenol on Silver Surface<br />
Produced by Physical Vapor Deposition (10 s)<br />
Counts (Normalized and Corrected)<br />
2000<br />
1000<br />
0<br />
2000<br />
1500<br />
1000<br />
Raman Shift / cm -1<br />
500<br />
119
SEM of Klarite<br />
Melamine on Klarite by SERS<br />
Aliquots of melamine<br />
solutions were applied to<br />
Klarite and the SERS<br />
spectrum measured in<br />
10 s (20 mW, 785-nm<br />
laser.)<br />
A. 10 -2 M;<br />
B. 10 -3 M;<br />
C. 10 -4 M;<br />
D. 10 -5 M;<br />
E. 10 -6 M;<br />
F. 10 -7 M;<br />
G. 10 -3 M on bare gold<br />
He et al., Sens. & Instrum. Food Qual. (2008), 2:66-71.<br />
120
Quantitative Result<br />
He et al., Sens. & Instrum. Food Qual. (2008), 2:66-71.<br />
SERS Spectra of Melamine and Cyanurate<br />
1 x 10 -3 M melamine<br />
1 x 10 -3 M cyanuric acid<br />
Solid cyanuric acid (not SERS)<br />
Mixture of 1 x 10⁻³ M<br />
melamine and 1 x 10⁻³ M<br />
cyanuric acid on Karite<br />
He et al., Sens. & Instrum. Food Qual. (2008), 2:66-71.<br />
121
4 Ag + Ge 4+<br />
4 e -<br />
Ag + Ge 4+<br />
e -<br />
Ag + 4 e -<br />
Ge 4+<br />
e -<br />
“Electroless Deposition”<br />
AgNPs Formed by Electroless Deposition<br />
1 mM AgNO 3<br />
20 min 10 mM AgNO 3<br />
3 min<br />
10 mM AgNO 3<br />
15 min 10 mM AgNO 3<br />
24 min<br />
122
AuNPs Formed by Electroless Deposition<br />
SERS of Melamine<br />
0.5 PPM in Solvent<br />
(X20)<br />
Glass<br />
Luminescence<br />
5 PPM in Solvent<br />
250 PPM extracted<br />
from Baby Formula<br />
Simple SERS<br />
Sample Vial<br />
Providing Chemical Information When & Where You Need It<br />
123
Mid-Infrared Hyperspectral Imaging<br />
Either the transmission (thin section) or ATR mode<br />
Wheat Kernel<br />
124
Wheat Kernel<br />
Feline Kidney Tissue<br />
125
λ<br />
40 x 40 µm<br />
FT and<br />
Background Subtraction<br />
FPA detector<br />
128x128 pixels<br />
Absorbance<br />
Wavenumber cm -1<br />
IR Spectra from Multiple Kidney Crystals<br />
Crystal<br />
Surrounding<br />
tissue<br />
Absorbance<br />
Sample<br />
3500 3000 2500 2000 1500 1000<br />
Wavenumber (cm -1 )<br />
•Most of the crystals in the kidney tissue are the same material<br />
• Kidney crystals inconsistent with pure crystalline melamine<br />
•Hypothesis = melamine is paired with something<br />
melamine cyanurate<br />
Absorbance<br />
Wheat Gluten<br />
Particle<br />
Kidney<br />
Particle<br />
Urine<br />
Crystal<br />
Melamine<br />
cyanurate<br />
3500 3000 2500 2000 1500 1000<br />
Wavenumber (cm -1 )<br />
• Crystals recovered from wheat gluten, kidney tissue,<br />
and urine samples match melamine cyanurate<br />
126
Section of the extensive two-dimensional<br />
hydrogen bond network (dashed) between<br />
melamine (blue) and cyanuric acid (red)<br />
NIR Hyperspectral Imaging<br />
(usually in the diffuse reflection mode.)<br />
127
Why Use Near-IR Imaging?<br />
• Universal –works with all organic molecules<br />
• Reflection or transmission modes<br />
• Thick samples (no sample preparation)<br />
• Large range of spatial resolutions<br />
• Low cost room temp. large format high performance arrays<br />
• Rugged, no‐moving parts<br />
• Real‐time capability<br />
• Technology driven by communications industry<br />
Spectral Imaging as a Data Cube<br />
A spectrum is collected at every pixel<br />
in a 2‐dimensional image, resulting in<br />
3‐dimensional cube of data: x, y, λ<br />
(x, y) = x, y spatial description<br />
(z) = λ spectral description<br />
Wavelength (λ, nm)<br />
Image Pixel (y)<br />
Two ways to think of this:<br />
• Each pixel in the image stack results in a full spectrum at that point.<br />
• Each image is recorded at a different wavelength of light.<br />
Image Pixel (x)<br />
128
Current Technology for NIR<br />
Hyperspectral Imaging<br />
• “Push‐Broom” or “Stare‐Down” configurations<br />
• The presentation is focused on “Stare‐Down”<br />
• Broadband light sources to illuminate the target then filter<br />
the reflected light<br />
• Tunable filters (e.g., LCTF or AOTF): ~6 nm spectral resolution<br />
Courtesy of Eli Margalith, Opotek Corporation<br />
Broadband Light Sources<br />
• Slow Data Collection<br />
• Dark noise, low Signal to Noise<br />
• Small Field of View (FOV)<br />
• Limited Spectral Resolution<br />
• Generation of Heat, may be harmful to the sample<br />
Courtesy of Eli Margalith, Opotek Corporation<br />
129
Concept of Using Tunable Laser<br />
for Hyperspectral Imaging<br />
• The tunable laser (Optical<br />
Parametric Oscillator ‐ OPO) scans<br />
the NIR wavelength range<br />
• The light is transmitted via fiber(s)<br />
to the target<br />
• The reflected light is collected by<br />
an IR camera<br />
Courtesy of Eli Margalith, Opotek Corporation<br />
Tunable Laser (OPO) Illumination<br />
Attribute Effect Advantage<br />
Wide Tuning<br />
Range<br />
Narrow Spectral<br />
Linewidth<br />
410 – 2400nm<br />
High Spectral Resolution<br />
(1 –2.5nm)<br />
Short Pulse (5ns) Short Integration Time Camera Gating<br />
Not affected by Ambient Light<br />
High Intensity Single frame data acquisition Short scan time<br />
Large FOV<br />
Low Avg. Power Sample not subjected to heat No sample damage<br />
Wavelength<br />
Measurement<br />
Real‐time calibrated wavelength<br />
High spectral accuracy<br />
Fiber Delivery Easy and efficient fiber delivery Flexible configurations<br />
Courtesy of Eli Margalith, Opotek Corporation<br />
130
Opotek HySPEC TM System<br />
Camera:<br />
FOV:<br />
Wavelength:<br />
Spectral<br />
Resolution:<br />
InSb or InGaAs<br />
640x512 or 320x256<br />
13 –50 mm, 20 cm<br />
1000 – 2400 nm (InSb)<br />
1000 – 1700 nm (InGaAs)<br />
1 ‐ 3nm<br />
Courtesy of Eli Margalith, Opotek Corporation<br />
Melamine in Gluten<br />
2 nm resolution<br />
Image of Scores on PC 4 (3.10%)<br />
Image of Scores on PC 3 (3.61%)<br />
Image of Scores on PC 2 (5.20%)<br />
50<br />
50<br />
50<br />
100<br />
100<br />
100<br />
150<br />
150<br />
150<br />
200<br />
200<br />
200<br />
250<br />
250<br />
250<br />
50 100 150 200 250 300<br />
50 100 150 200 250 300<br />
0% 0.05% 0.5% % !% 1%<br />
50 100 150 200 250 300<br />
Image of Scores on PC 2 (5.76%)<br />
Image of Scores on PC 1 (10.38%)<br />
Image of Scores on PC 1 (14.96%)<br />
Image of Scores on PC 1 (14.60%)<br />
50<br />
50<br />
50<br />
50<br />
100<br />
100<br />
100<br />
100<br />
150<br />
150<br />
150<br />
150<br />
200<br />
200<br />
200<br />
200<br />
250<br />
250<br />
250<br />
250<br />
50 100 150 200 250 300<br />
50 100 150 200 250 300<br />
50 100 150 200 250 300<br />
50 100 150 200 250 300<br />
2% 3% 4% 5%<br />
Courtesy of Eli Margalith, Opotek Corporation<br />
131
30 ppm Melamine in Wheat Gluten<br />
Image of 1454<br />
50<br />
100<br />
150<br />
200<br />
9000<br />
8500<br />
10 frames, 1 nm step<br />
2 of 64,074 pixels<br />
250<br />
300<br />
8000<br />
350<br />
400<br />
450<br />
Mean<br />
7500<br />
7000<br />
500<br />
100 200 300 400 500 600<br />
6500<br />
6000<br />
1300 1350 1400 1450 1500 1550 1600<br />
Wavelength<br />
Raman Hyperspectral Imaging<br />
132
Chemical Imaging Instrumentation<br />
Falcon II TM , Condor TM and Macro Raman Chemical Imaging<br />
Wide‐field Chemical<br />
Imaging offers:<br />
• High Spatial and spectral<br />
resolution<br />
• Little to no sample<br />
preparation<br />
• Nondestructive analysis<br />
• Fast, automated acquisition<br />
• Multiple imaging<br />
modalities<br />
• Near-IR<br />
• Fluorescence<br />
265<br />
• Colorimetric<br />
System<br />
Macro Raman Chemical<br />
Imaging System<br />
Falcon II TM<br />
Condor TM<br />
Food & Beverage Adulteration<br />
Raman Chemical Imaging for the Detection of Melamine<br />
670 cm ‐1<br />
Brightfield Reflectance Raman Chemical Image Brightfield/Raman Fusion Image<br />
670 cm ‐1<br />
Raman Intensity<br />
Average spectra from region 1<br />
Average spectra from region 2<br />
600 700 800 900 1000<br />
Raman Shift (cm ‐1 )<br />
Y. Liu, K. Chao, M. Kim, D. Tuschel, O. Olkhovyk and R. Priore “Potential of Raman spectroscopy and imaging<br />
266methods for rapid and routine screening of the presence of melamine in animal feed and foods,” Appl. Spec.,<br />
63(4), 477-480 (2009).<br />
133
Macroscopic Raman Chemical<br />
Imaging<br />
Melamine Identification in Wheat Flour<br />
Brightfield Reflectance (880 nm) Raman Chemical Image Brightfield/Raman Fusion Image<br />
267<br />
Courtesy of Ryan Priore, ChemImage Corp.<br />
Condor TM NIR Chemical Imaging<br />
Melamine Identification in Wheat Flour<br />
100 %<br />
0 %<br />
0.2 % 0.5 %<br />
1.0 %<br />
3.0 %<br />
6.0 %<br />
Calibration<br />
Validation<br />
268<br />
6.0 % 3.0 %<br />
Raw NIR image<br />
1.0 %<br />
0.5 %<br />
0.2 %<br />
100 %<br />
0.25 in<br />
• Six wheat flour samples were prepared with<br />
melamine concentrations ranging from 0.0 – 6.0 %<br />
• Samples were placed in a 96-well plate in two<br />
groups: Calibration (model development) and<br />
Validation (model challenge) sets<br />
0 %<br />
Courtesy of Ryan Priore, ChemImage Corp.<br />
134
Condor TM NIR Chemical Imaging<br />
Melamine Identification in Wheat Flour<br />
Mixture Spectra<br />
(Calibration)<br />
Calibration<br />
Spectra ROIs<br />
269<br />
1 st Derivative Absorbance (1490 nm)<br />
0.25 in<br />
Courtesy of Ryan Priore, ChemImage Corp.<br />
Falcon II TM Fusion Imaging via CIdentify TM<br />
Melamine Identification in Skim Milk Powder (w/ HDPE interferent)<br />
270<br />
• Raman and NIR imaging data sets may be fused together for<br />
improved accuracy in class discrimination<br />
– Raman possesses higher specificity than NIR but requires a<br />
longer integration time than NIR<br />
– NIR alone may not offer 100% discrimination due to<br />
spectroscopic similarities between the analyte and matrix<br />
• Can be used for either macroscopic or microscopic data<br />
analysis and provides a visual output for decision making<br />
• Useful for determining intentional vs. unintentional<br />
adulteration identification<br />
– melamine is a known intentional adulterant<br />
– HDPE may be an unintentional adulterant from a can liner<br />
Courtesy of Ryan Priore, ChemImage Corp.<br />
135
Falcon II TM Fusion Imaging via CIdentify TM<br />
Melamine Identification in Skim Milk Powder (w/ HDPE interferent)<br />
Melamine & HDPE<br />
Melamine & Skim Milk Powder<br />
Brightfield Reflectance<br />
50 µm 50 µm<br />
Brightfield Reflectance<br />
HDPE<br />
Melamine<br />
Skim Milk Powder<br />
Concatenated ROIs<br />
Ground Truth<br />
50 µm<br />
271<br />
Courtesy of Ryan Priore, ChemImage Corp.<br />
Falcon II TM Fusion Imaging via CIdentify TM<br />
Melamine Identification in Skim Milk Powder (w/ HDPE interferent)<br />
272<br />
• Pure components were measured using Raman<br />
and NIR over identical fields of view;<br />
• Raman full spectral range was measured;<br />
• NIR absorbance data was converted to 1 st<br />
© ChemImage Corporation 2009. All Rights Reserved. ChemImage Products and Services are protected by U.S. and International issued and pending patents.<br />
derivative and cropped from 1350-1600 nm.<br />
136
Acknowledgements<br />
• Curtis Marcott, Light Light Solutions<br />
• Eli Margalith, Opotek Corporation<br />
• Stu Farquharson, Real-Time Analyzers<br />
• Ryan Priore and Pat Treado, ChemImage Corporation<br />
137
Classification Technology<br />
Changing from diagnosing calibrations to<br />
diagnosing products<br />
Dr. David Honigs- Perten Instruments,<br />
Springfield, IL<br />
Two Types of Classification<br />
• Similarity -Is this sample similar to other samples?<br />
• Dissimilarity - Is this sample unlike another samples?<br />
• Samples are always both similar and<br />
dissimilar in some respects.<br />
– e.g.. an apples and oranges are placed together in the<br />
breakfast fruit basket. However, they are as different<br />
as “comparing apples to oranges”.<br />
138
Similarity<br />
• Looking at similarity of vectors<br />
Correlation (R)<br />
Melamine in Correlation<br />
Gluten (%) Coefficient<br />
0.000 0.9996<br />
0.001 0.9996<br />
0.005 0.9996<br />
0.010 0.9996<br />
0.050 0.9996<br />
0.100 0.9996<br />
0.500 0.9996<br />
1.000 0.9995<br />
5.000 0.9981<br />
10.000 0.9954<br />
100.000 0.7784<br />
139
Going From ‘How Similar?’<br />
to<br />
‘How Different?’<br />
• Similarity is measured by cross multiplication<br />
(correlation)<br />
• Differences are measured by subtraction<br />
• Generally express the difference as a root<br />
mean square sum (RMS) difference<br />
Looking At Differences<br />
140
RMS Difference as an Indicator of<br />
Contamination<br />
Melamine RMS Diff.<br />
0 0.010<br />
0.001 0.111<br />
0.005 0.119<br />
0.01 0.122<br />
0.05 0.125<br />
0.1 0.121<br />
0.5 0.113<br />
1 0.132<br />
5 0.538<br />
10 1.285<br />
100 55.166<br />
Is the difference abnormal or an<br />
adulteration<br />
• What is a normal difference?<br />
– This requires more than 1 sample and subtraction.<br />
141
How to View Atypical Differences<br />
• Need to subtract several spectra<br />
• The problem is that the different spectra are so<br />
very similar to one another.<br />
Create Ideal Sample Spectra to<br />
Subtract (Loadings)<br />
142
Sample Scores are typically<br />
calculated and measured already<br />
• H statistic, M distance, Leverage<br />
M, H, or Leverage Measure the<br />
Distance from the Mean of the Data<br />
143
Typical NIR Manufacturer<br />
• If a sample has a large distance, don’t trust the<br />
answer and send it to the lab. Use it for future<br />
calibration.<br />
• In calibration the first step is to throw out the<br />
high M distance samples and use the rest.<br />
Distance Depends on What is<br />
Called ‘Typical’<br />
144
Pet Food Melamine Contamination<br />
• Measured by NIR, showed high M distances,<br />
sent to wet lab, showed reasonable<br />
Kjeldahl/Dumas results.<br />
• The apple-cart is upset because of human<br />
intervention. The odds of an accidental<br />
contamination matching the Kjeldahl/Dumas<br />
techniques are slim.<br />
• Someone has practiced to make oranges look<br />
like apples in the eye of this beholder.<br />
First Things to Fix<br />
• The M distance is not commonly used for<br />
product qualification because the calibrations<br />
are not fully trusted.<br />
• Best practices are that one must find the<br />
reason for the high M distances.<br />
• This becomes challenging on evenings,<br />
weekends and with just-in-time product flow.<br />
• Ultimately, one must separate out high M<br />
distances caused by contamination from those<br />
caused by instrumentation, calibration and<br />
operator error.<br />
145
Qualify before Quantify - SIMCA<br />
• Create Several Categories of Materials and<br />
Measure the Distance to Them.<br />
• Each distance is measured based on that own<br />
model ellipse.<br />
SIMCA Analysis of Gluten<br />
Samples<br />
146
Gluten and Melamine Models<br />
Discrimination Power<br />
Similarity/Dissimilarity<br />
• Looking at dissimilarity of vectors<br />
147
A Commercial Set of 45 Corn<br />
Gluten Samples<br />
Harmonized Spectra of Corn<br />
Gluten Data Set<br />
148
Conclusion<br />
• Changing the standard practice response to<br />
an incorrect M Distance onexisting equipment<br />
would do a lot<br />
• One can easily add classification testing for<br />
modest cost and effort to current testing.<br />
• Both similarity and difference techniques are<br />
useful. One does not have to use only one.<br />
• These Classification techniques are applicable<br />
to NIR, FTIR, or other spectral signatures of<br />
the products.<br />
149