In Vitro Glucuronidation of Thyroxine and Triiodothyronine by Liver ...
In Vitro Glucuronidation of Thyroxine and Triiodothyronine by Liver ...
In Vitro Glucuronidation of Thyroxine and Triiodothyronine by Liver ...

Create successful ePaper yourself
Turn your PDF publications into a flip-book with our unique Google optimized e-Paper software.
0090-9556/07/3512-2203–2210$20.00<br />
DRUG METABOLISM AND DISPOSITION Vol. 35, No. 12<br />
Copyright © 2007 <strong>by</strong> The American Society for Pharmacology <strong>and</strong> Experimental Therapeutics 16972/3277631<br />
DMD 35:2203–2210, 2007<br />
Printed in U.S.A.<br />
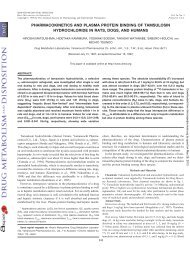
<strong>In</strong> <strong>Vitro</strong> <strong>Glucuronidation</strong> <strong>of</strong> <strong>Thyroxine</strong> <strong>and</strong> <strong>Triiodothyronine</strong><br />
<strong>by</strong> <strong>Liver</strong> Microsomes <strong>and</strong> Recombinant Human<br />
UDP-Glucuronosyltransferases<br />
Zeen Tong, Hongshan Li, Igor Goljer, Oliver McConnell, <strong>and</strong> Appavu Ch<strong>and</strong>rasekaran<br />
Biotransformation Division (Z.T., H.L., A.C.) <strong>and</strong> Discovery Analytical Chemistry (I.G., O.M.), Wyeth Research,<br />
Collegeville, Pennsylvania<br />
Received May 31, 2007; accepted September 12, 2007<br />
ABSTRACT:<br />
<strong>Glucuronidation</strong>, which may take place on the phenolic hydroxyl<br />
<strong>and</strong> carboxyl groups, is a major pathway <strong>of</strong> metabolism for thyroxine<br />
(T4) <strong>and</strong> triiodothyronine (T3). <strong>In</strong> this study, a liquid chromatography/mass<br />
spectrometry (LC/MS) method was developed to separate<br />
phenolic <strong>and</strong> acyl glucuronides <strong>of</strong> T4 <strong>and</strong> T3. The method<br />
was used to collect the phenolic glucuronide <strong>of</strong> T4 for definitive<br />
characterization <strong>by</strong> NMR <strong>and</strong> to determine effects <strong>of</strong> incubation<br />
pH, species differences, <strong>and</strong> human UDP-glucuronosyltransferases<br />
(UGTs) involved in the formation <strong>of</strong> the glucuronides. Formation <strong>of</strong> T4<br />
phenolic glucuronide was favored at pH 7.4, whereas formation <strong>of</strong> T4<br />
acyl glucuronide was favored at pH 6.8. All the UGTs examined catalyzed<br />
the formation <strong>of</strong> T4 phenolic glucuronide except UGT1A4; the<br />
highest activity was detected with UGT1A3, UGT1A8, <strong>and</strong> UGT1A10,<br />
Article, publication date, <strong>and</strong> citation information can be found at<br />
http://dmd.aspetjournals.org.<br />
doi:10.1124/dmd.107.016972.<br />
followed <strong>by</strong> UGT1A1 <strong>and</strong> UGT2B4. Formation <strong>of</strong> T3 phenolic glucuronide<br />
was observed in the order <strong>of</strong> UGT1A8 > UGT1A10 > UGT1A3 ><br />
UGT1A1; trace activity was observed with UGT1A6 <strong>and</strong> UGT1A9.<br />
UGT1A3 was the major is<strong>of</strong>orm catalyzing the formation <strong>of</strong> T4 <strong>and</strong> T3<br />
acyl glucuronides. <strong>In</strong> liver microsomes, phenolic glucuronidation was<br />
the highest in mice for T4 <strong>and</strong> in rats for T3 <strong>and</strong> lowest in monkeys for<br />
both T4 <strong>and</strong> T3. Acyl glucuronidation was highest in humans <strong>and</strong><br />
lowest in mice for T4 <strong>and</strong> T3. Phenolic glucuronidation was higher<br />
than acyl glucuronidation for T4 in humans; in contrast, the acyl<br />
glucuronidation was slightly higher than phenolic glucuronidation for<br />
T3. UGT activities were lower toward T3 than T4 in all the species. The<br />
LC/MS method was a useful tool in studying glucuronidation <strong>of</strong> T4<br />
<strong>and</strong> T3.<br />
<strong>Thyroxine</strong> (T4) is the main secretory product <strong>of</strong> the thyroid follicular<br />
cells but has little biological activity (Visser, 1996). T4 is converted<br />
to the most active form <strong>of</strong> thyroid hormone triiodothyronine<br />
(T3) <strong>by</strong> outer ring deiodination in peripheral tissue <strong>and</strong> the inactive<br />
product 3,3,5-triiodothyronine <strong>by</strong> inner ring deiodination (Visser,<br />
1996). Deiodination <strong>and</strong> conjugation were the principal pathways <strong>of</strong><br />
thyroid hormone metabolism. Deiodination regulates the thyroid hormone<br />
bioactivity, whereas conjugation, which involves sulfation <strong>and</strong><br />
glucuronidation, is to increase the water solubility <strong>of</strong> the substrates<br />
<strong>and</strong> thus to facilitate their urinary <strong>and</strong> biliary clearance (Visser, 1996).<br />
<strong>Glucuronidation</strong> <strong>by</strong> hepatic UDP-glucuronosyltransferase (UGT) is<br />
one <strong>of</strong> the major metabolic pathways <strong>of</strong> T4 <strong>and</strong> T3 (Kohrle et al.,<br />
1987; Saito et al., 1991; Visser, 1996). T4 <strong>and</strong> T3 glucuronides are<br />
cleared from the body through biliary excretion (Visser, 1996). Studies<br />
with recombinant human UGT <strong>and</strong> rat hepatocytes showed that<br />
human UGT1A1 <strong>and</strong> UGT1A9 <strong>and</strong> rat UGT1A1 <strong>and</strong> UGT1A6 were<br />
responsible for T4 conjugation, whereas rat UGT2B2 was responsible<br />
for T3 glucuronidation (Visser et al., 1993a; Findlay et al., 2000;<br />
Vansell <strong>and</strong> Klaassen, 2002).<br />
<strong>Glucuronidation</strong> <strong>of</strong> T4 <strong>and</strong> T3 may take place on the phenolic<br />
hydroxy <strong>and</strong> carboxyl groups (Fig. 1) in the molecules to give phenolic<br />
<strong>and</strong> acyl glucuronides, respectively (Jemnitz <strong>and</strong> Vereczkey,<br />
1996). However, there is little documented information about separation<br />
<strong>of</strong> phenolic <strong>and</strong> acyl glucuronides <strong>of</strong> thyroid hormone <strong>and</strong> their<br />
formation <strong>by</strong> UGT is<strong>of</strong>orms, especially the acyl glucuronides <strong>of</strong> these<br />
two hormones. <strong>In</strong> the present study, a liquid chromatography/mass<br />
spectrometry (LC/MS) method was developed to separate <strong>and</strong> characterize<br />
the phenolic <strong>and</strong> acyl glucuronides <strong>of</strong> T4 <strong>and</strong> T3. This method<br />
was used to evaluate formation <strong>of</strong> phenolic <strong>and</strong> acyl glucuronides <strong>of</strong><br />
T4 <strong>and</strong> T3 <strong>by</strong> recombinant human UGT is<strong>of</strong>orms <strong>and</strong> hepatic microsomes<br />
<strong>of</strong> animals <strong>and</strong> humans.<br />
Materials <strong>and</strong> Methods<br />
Materials. Fex<strong>of</strong>enadine, L-thyroxine, T3, 4-nitrophenol, 4-nitrophenol<br />
glucuronide, UDP-glucuronic acid, -glucuronidase (363,400 units/g, type H-1<br />
from Helix pomatia), <strong>and</strong> deuterated methanol (CD 3 OD) were purchased from<br />
Sigma-Aldrich (St. Louis, MO). [Glucuronyl- 14 C(U)]-uridine diphosphate<br />
glucuronic acid (292.8 mCi/mmol), with a purity <strong>of</strong> 97%, was purchased from<br />
PerkinElmer Life <strong>and</strong> Analytical Sciences, <strong>In</strong>c. (Boston, MA). Baculovirus<br />
insect cell-expressed human UGT1A1, UGT1A3, UGT1A4, UGT1A6,<br />
UGT1A8, UGT1A9, UGT1A10, UGT2B4, UGT2B7, UGT2B15, <strong>and</strong><br />
UGT2B17 supersomes (Table 1) were obtained from BD Biosciences (San<br />
Jose, CA). <strong>Liver</strong> microsomes from mice, rats, dogs, monkeys, <strong>and</strong> humans<br />
listed in Table 2 were purchased from Xenotech, LLC (Lenexa, KS). Monobasic<br />
potassium phosphate, reagent grade chemicals, high-performance liquid<br />
chromatography (HPLC) grade water, <strong>and</strong> solvents were purchased from EMD<br />
Chemicals (Gibbstown, NJ) or Mallinckrodt Baker (Phillipsburg, NJ).<br />
Downloaded from dmd.aspetjournals.org <strong>by</strong> guest on August 19, 2013<br />
ABBREVIATIONS: T4, thyroxine; T3, triiodothyronine; UGT, UDP-glucuronosyltransferase; LC/MS, liquid chromatography/mass spectrometry;<br />
HPLC, high-performance liquid chromatography; UDPGA, UDP-glucuronic acid.<br />
2203
2204 TONG ET AL.<br />
TABLE 1<br />
UGT is<strong>of</strong>orms used in the present study<br />
Is<strong>of</strong>orms Lot Number Activity<br />
pmol/min/mg<br />
UGT1A1 10 1000<br />
UGT1A3 11 150<br />
UGT1A4 2 1450<br />
UGT1A6 1 6970<br />
UGT1A8 15467 510<br />
UGT1A9 1 8740<br />
UGT1A10 23954 110<br />
UGT2B4 16905 700<br />
UGT2B7 11 1300<br />
UGT2B15 15468 2100<br />
UGT2B17 15397 2200<br />
UGT1A1 <strong>and</strong> UGT1A3 activity was measured as estradiol 3-glucuronidation. UGT1A4<br />
activity was determined as trifluoperazine glucuronidation. UGT2B17 activity was measured as<br />
eugenol glucuronidation. Activity <strong>of</strong> other UGT is<strong>of</strong>orms was determined as 7-hydroxy-4-<br />
trifluoromethylcoumarin glucuronidation.<br />
TABLE 2<br />
<strong>Liver</strong> microsomes used in the present study<br />
Species Sex Number <strong>of</strong> Subjects for Pool Cytochrome P450 Content<br />
nmol/mg protein<br />
Mouse Male 750 0.99<br />
Female 200 0.84<br />
Rat Male 191 0.88<br />
Female 25 0.62<br />
Dog Male 4 0.53<br />
Female 4 0.86<br />
Monkey Male 10 1.17<br />
Female 9 1.31<br />
Human Mix 50 0.43<br />
<strong>In</strong>cubations. <strong>In</strong>cubations with liver microsomes or recombinant human<br />
UGTs consisted <strong>of</strong> T4 or T3 (100 M), magnesium chloride (10 mM),<br />
microsomes (2 mg/ml) or supersomes (0.5 mg/ml), <strong>and</strong> UDP-glucuronic acid<br />
(UDPGA) (6 mM) in 0.5 ml <strong>of</strong> 0.1 M Tris-HCl buffer, pH 6.8 or 7.4.<br />
Alamethicin (50 g/mg protein) was mixed with liver microsomes for use in<br />
incubations. T4 or T3 in 5 l <strong>of</strong> methanol was added to the incubation tubes<br />
containing buffer, magnesium chloride solution, alamethicin, <strong>and</strong> microsomes<br />
or UGT is<strong>of</strong>orms. After mixing, the tubes were preincubated for 3 min in a<br />
shaking water bath at 37°C. The reactions were initiated <strong>by</strong> the addition <strong>of</strong> 30<br />
l <strong>of</strong> 100 mM UDPGA solution in water. Control incubations were conducted<br />
under the same conditions without UDPGA or microsomes. All the incubations<br />
were performed in duplicate. Reactions were stopped <strong>by</strong> the addition <strong>of</strong> 100 l<br />
<strong>of</strong> ice-cold methanol containing 5% trichloroacetic acid. Fex<strong>of</strong>enadine in 30 l<br />
<strong>of</strong> 10 M solution in methanol was added to each incubation as an internal<br />
st<strong>and</strong>ard, followed <strong>by</strong> the addition <strong>of</strong> 600 l <strong>of</strong> methanol. Samples were<br />
vortex-mixed. Denatured proteins were separated <strong>by</strong> centrifugation at 4300<br />
rpm <strong>and</strong> 4°C for 10 min in a Sorvall (Newton, CT) model T21 super centrifuge.<br />
An aliquot <strong>of</strong> the supernatant was analyzed <strong>by</strong> LC/MS.<br />
To evaluate the effect <strong>of</strong> pH on the formation <strong>of</strong> T4 glucuronides, T4 was<br />
incubated with human liver microsomes at pH 6.8 <strong>and</strong> 7.4 in the presence <strong>of</strong><br />
UDPGA at 37°C for 5, 10, 15, 20, 30, <strong>and</strong> 60 min. All the other incubations<br />
were conducted at pH 6.8 for 30 min.<br />
Hydrolysis <strong>of</strong> T4 <strong>and</strong> T3 Glucuronides. The sample prepared from incubations<br />
with human liver microsomes in the presence <strong>of</strong> UDPGA was dried<br />
under a nitrogen stream in a TurboVap LV evaporator (Zymark Corp., Hopkinton,<br />
MA). The residue was reconstituted in 1 ml <strong>of</strong> 0.1 M sodium acetate<br />
buffer, pH 5.0. Approximately 560 units <strong>of</strong> -glucuronidase in 100 l <strong>of</strong>0.1<br />
M sodium acetate buffer, pH 5.0, was added to 0.5 ml <strong>of</strong> the reconstituted<br />
solution, <strong>and</strong> the mixture was incubated at 37°C for 30 min with gentle<br />
shaking. The reaction was stopped <strong>by</strong> the addition <strong>of</strong> 1 ml <strong>of</strong> acetonitrile, <strong>and</strong><br />
the precipitated enzyme was removed <strong>by</strong> centrifugation. The supernatant was<br />
evaporated under nitrogen to remove acetonitrile. An aliquot <strong>of</strong> the aqueous<br />
residue was analyzed <strong>by</strong> HPLC. A control incubation was prepared under the<br />
same conditions but without -glucuronidase.<br />
For alkaline hydrolysis, the sample was adjusted with 2N sodium hydroxide<br />
to about pH 11 <strong>and</strong> incubated at 37°C for 60 min. After adjustment with acetic<br />
acid to about pH 5, an aliquot was analyzed <strong>by</strong> HPLC. A control incubation<br />
was conducted at pH 6.8. All the samples were analyzed <strong>by</strong> LC/MS to monitor<br />
the glucuronides <strong>and</strong> the internal st<strong>and</strong>ard.<br />
LC/MS. A Waters model 2690 HPLC system (Waters Corp., Milford, MA)<br />
with a built-in autosampler <strong>and</strong> a diode array UV detector was used for<br />
analysis. The UV detector was set to monitor 200 to 400 nm. Separations were<br />
accomplished on a Luna C18(2) column (150 2.0 mm, 5 m) (Phenomenex,<br />
Torrance, CA). The sample chamber in the autosampler was maintained at 4°C,<br />
whereas the column was at ambient temperature <strong>of</strong> about 20°C. The mobile<br />
phase consisted <strong>of</strong> 0.1% trifluoroacetic acid in water (A) <strong>and</strong> 0.1% trifluoroacetic<br />
acid in acetonitrile (B) <strong>and</strong> was delivered at 0.2 ml/min. The mobile<br />
phase B linearly increased from 25% to 65% over the first 5 min, to 85% over<br />
10 min, <strong>and</strong> then to 95% over 5 min. The first 7 min <strong>of</strong> flow was diverted away<br />
from the mass spectrometer.<br />
The HPLC system was coupled to a Micromass Quattro Ultima triple<br />
quadrupole mass spectrometer (Micromass, <strong>In</strong>c., Beverly, MA), which was<br />
equipped with an electrospray ionization interface <strong>and</strong> operated in the positive<br />
ionization mode. The capillary <strong>and</strong> cone voltages were set at 4000 <strong>and</strong> 20 V,<br />
respectively. The cone <strong>and</strong> the desolvation gas flows were 100 <strong>and</strong> 1100 l/h,<br />
respectively. The source block <strong>and</strong> the desolvation gas temperatures were set<br />
at 105 <strong>and</strong> 200°C, respectively. Mass resolution for multiple reaction monitoring<br />
was 15 for MS1 <strong>and</strong> MS2. The scan mode used selected reaction<br />
monitoring with ion transitions <strong>of</strong> m/z 953.5 to 777.5 for T4 glucuronides, m/z<br />
827.7 to 651.7 for T3 glucuronides, <strong>and</strong> m/z 502 to 466 for fex<strong>of</strong>enadine at<br />
collision energy <strong>of</strong> 25 eV. Micromass MassLynx s<strong>of</strong>tware (version 4.0) was<br />
used for collection <strong>and</strong> analysis <strong>of</strong> LC/MS data. The peak area ratio <strong>of</strong><br />
glucuronides to the internal st<strong>and</strong>ard was used for comparison <strong>of</strong> enzyme<br />
activities.<br />
To evaluate the limit <strong>of</strong> detection <strong>and</strong> linearity <strong>of</strong> MS response, T4 was<br />
incubated with human liver microsomes in the presence <strong>of</strong> a mixture <strong>of</strong><br />
[ 14 C]UDPGA <strong>and</strong> nonlabeled UDPGA (1:5) as described under <strong>In</strong>cubations.<br />
The phenolic glucuronide was isolated <strong>by</strong> HPLC using the same conditions<br />
described above, except that a 250 4.6-mm column was used, <strong>and</strong> the mobile<br />
phase was delivered at 0.6 ml/min. The isolated fractions were concentrated<br />
under nitrogen <strong>and</strong> reconstituted with the control incubation mixture. An<br />
aliquot <strong>of</strong> the supernatant was analyzed <strong>by</strong> LC/MS after protein precipitation.<br />
The amount <strong>of</strong> T4 glucuronide was calculated <strong>by</strong> the specific radioactivity <strong>of</strong><br />
[ 14 C]UDPGA in the incubation <strong>and</strong> the radioactivity in the isolated fractions<br />
after concentration.<br />
NMR Analysis <strong>of</strong> T4 Phenolic Glucuronide. T4 phenolic glucuronide was<br />
isolated as described in the above section from incubations <strong>of</strong> T4 with human<br />
liver microsomes in the presence <strong>of</strong> nonradiolabeled UDPGA. The isolated<br />
fractions were dried under a nitrogen stream <strong>and</strong> reconstituted in approximately<br />
160 l <strong>of</strong> deuterated methanol (CD 3 OD) <strong>and</strong> transferred to a 3-mm o.d.<br />
NMR tube. For the purpose <strong>of</strong> comparison, a saturated T4 solution was also<br />
prepared in CD 3 OD. Data were collected on Varian <strong>In</strong>ova 500 MHz <strong>and</strong><br />
Bruker Avance 600 MHz spectrometers, each equipped with a 3-mm<br />
z-gradient indirect detection probe. One-dimensional proton 1 H NMR data <strong>and</strong><br />
two-dimensional gradient selected correlation spectroscopy, total correlation<br />
spectroscopy, heteronuclear 1 H- 13 C gradient heteronuclear single quanta cor-<br />
FIG. 1. Formation <strong>of</strong> the phenolic glucuronide <strong>and</strong> acyl glucuronide <strong>of</strong> T4 (r I) <strong>and</strong> T3 (r H).
GLUCURONIDATION OF THYROXINE AND TRIIODOTHYRONINE<br />
2205<br />
FIG. 2. T4 glucuronides after incubation without (A) <strong>and</strong> with (B)<br />
-glucuronidase.<br />
relation, <strong>and</strong> 1 H- 13 C gradient selected heteronuclear multiple bond correlation<br />
(Croasmun <strong>and</strong> Carlson, 1994) NMR data were acquired. All the spectra were<br />
referenced to the signal <strong>of</strong> CHD 2 OD at 3.32 ppm in 1 H <strong>and</strong> 48.1 ppm in 13 C<br />
spectra. Because <strong>of</strong> limited quantity <strong>of</strong> metabolite, the 13 C chemical shifts were<br />
extracted from heteronuclear gradient heteronuclear single quanta correlation<br />
<strong>and</strong> gradient selected heteronuclear multiple bond correlation.<br />
Results<br />
Separation <strong>and</strong> Detection <strong>of</strong> T4 <strong>and</strong> T3 Glucuronides. The<br />
LC/MS method used in the present study separated T4 <strong>and</strong> T3 glucuronides,<br />
with the T4 phenolic <strong>and</strong> acyl glucuronides eluting at 13.2<br />
<strong>and</strong> 14.8 min, respectively (Fig. 2) <strong>and</strong> T3 phenolic <strong>and</strong> acyl glucuronides<br />
eluting at 11.0 <strong>and</strong> 12.2 min, respectively (data not shown).<br />
The internal st<strong>and</strong>ard fex<strong>of</strong>enadine had a retention time <strong>of</strong> 15.7 min.<br />
T4 <strong>and</strong> T3 were separated from their respective glucuronides <strong>and</strong><br />
eluted at 13.9 <strong>and</strong> 13.2 min, respectively (data not shown). Limit <strong>of</strong><br />
detection for T4 phenolic glucuronide was 0.1 ng on column. The<br />
linear range <strong>of</strong> mass spectrometric response was 0.1 to 46 ng (data not<br />
shown). Samples analyzed <strong>by</strong> LC/MS had lower response than that for<br />
46 ng <strong>of</strong> T4 phenolic glucuronide, suggesting that the samples analyzed<br />
were within the linear range <strong>of</strong> mass spectrometric response.<br />
Identification <strong>of</strong> T4 <strong>and</strong> T3 Glucuronides. The identities <strong>of</strong> the<br />
T4 glucuronides were elucidated <strong>by</strong> hydrolysis, LC/MS, <strong>and</strong> NMR.<br />
After hydrolysis with -glucuronidase for 30 min, both glucuronide<br />
peaks completely disappeared (Fig. 2). After hydrolysis under alkaline<br />
conditions for 1 h, the second glucuronide peak completely disappeared,<br />
whereas the first glucuronide peak was intact (Fig. 3), suggesting<br />
that the first glucuronide was stable <strong>and</strong> the second glucuronide<br />
was labile under alkaline conditions. These findings suggested<br />
that the first peak was a phenolic glucuronide <strong>and</strong> the second peak was<br />
an acyl glucuronide <strong>of</strong> T4.<br />
LC/MS analysis showed that both T4 metabolites formed in human<br />
liver microsomes in the presence <strong>of</strong> UDPGA had a molecular ion at<br />
m/z 953.5. Figure 4 shows the product ions <strong>of</strong> m/z 953.5 obtained from<br />
collision-induced dissociation. Loss <strong>of</strong> 176 Da generated the molecular<br />
ion <strong>of</strong> T4, indicating that both products were T4 glucuronides.<br />
The ion at m/z 731 was a fragmentation product <strong>of</strong> T4.<br />
NMR results for T4 phenolic glucuronide are summarized in Table<br />
3 <strong>and</strong> Figs. 5 <strong>and</strong> 6. From changes in chemical shifts <strong>of</strong> iodinated<br />
carbons, C-9 <strong>and</strong> C-13 (Fig. 5) going from T4 to T4 glucuronide, more<br />
than 6-ppm downfield shifts, it is evident that glucuronidation took<br />
place on the phenolic part <strong>of</strong> T4. The downfield chemical shift 0.08<br />
ppm is also observed on protons H-10 <strong>and</strong> H-12 (Fig. 6). The signal<br />
<strong>of</strong> anomeric proton H-2 at 5.27 ppm also supports the presence <strong>of</strong><br />
aromatic ether.<br />
T3 glucuronides were identified <strong>by</strong> LC/MS <strong>and</strong> hydrolysis. The<br />
molecular ions for T3 glucuronides were observed at m/z 827.7, which
2206 TONG ET AL.<br />
FIG. 3. T4 glucuronides after incubation at pH 6.8 (A) <strong>and</strong> at<br />
pH 11.0 (B).<br />
was 176 Da larger than the molecular ion for T3. Neutral loss <strong>of</strong> 176<br />
Da from the molecular ions <strong>of</strong> T3 glucuronides produced m/z 651.7,<br />
identical to T3 molecular ion, indicating that the metabolites were T3<br />
glucuronides (data not shown). Similar to T4 glucuronides described<br />
above, both T3 glucuronides were hydrolyzed <strong>by</strong> -glucuronidase,<br />
whereas only acyl glucuronide was hydrolyzed under alkaline conditions<br />
(data not shown).<br />
Effect <strong>of</strong> pH on the Formation <strong>of</strong> T4 Glucuronides. Formation <strong>of</strong><br />
the phenolic <strong>and</strong> acyl glucuronides <strong>of</strong> T4 was evaluated at pH 6.8 <strong>and</strong><br />
7.4 (Fig. 7). At both pH conditions, formation <strong>of</strong> the phenolic glucuronide<br />
<strong>of</strong> T4 increased over incubation time up to 60 min. Formation<br />
<strong>of</strong> the acyl glucuronide <strong>of</strong> T4 reached the highest level at 20 min <strong>of</strong><br />
incubation at pH 7.4 <strong>and</strong> 30 min at pH 6.8. Formation <strong>of</strong> phenolic<br />
glucuronide was favored <strong>by</strong> pH 7.4, whereas formation <strong>of</strong> the acyl<br />
glucuronide was favored <strong>by</strong> pH 6.8. Therefore, incubations were<br />
carried out at pH 6.8 for 30 min in the present study to ensure<br />
detection <strong>of</strong> the acyl glucuronide. Under these conditions, formation<br />
<strong>of</strong> the acyl glucuronide was about 60% higher, whereas formation <strong>of</strong><br />
the phenolic glucuronide was about 40% lower compared with incubations<br />
at pH 7.4.<br />
<strong>Glucuronidation</strong> <strong>of</strong> T4 <strong>and</strong> T3 <strong>by</strong> Recombinant Human UGT.<br />
Recombinant human UGT1A1, UGT1A3, UGT1A4, UGT1A6,<br />
UGT1A8, UGT1A9, UGT1A10, UGT2B4, UGT2B7, UGT2B15, <strong>and</strong><br />
UGT2B17 were incubated with T4 <strong>and</strong> T3 in the presence <strong>of</strong> UDPGA<br />
(Figs. 8 <strong>and</strong> 9). The results were normalized with the enzyme activities<br />
toward probe substrates described under Materials <strong>and</strong> Methods<br />
<strong>by</strong> arbitrarily setting the UGT1A1 activity as 100%. All the UGT<br />
is<strong>of</strong>orms catalyzed the formation <strong>of</strong> the phenolic glucuronide <strong>of</strong> T4<br />
except for UGT1A4. The activity catalyzing the formation <strong>of</strong> T4<br />
phenolic glucuronide was in the order <strong>of</strong> UGT1A3 UGT1A8 <br />
UGT1A10 UGT2B4 UGT1A1. Trace activity was observed with<br />
UGT1A6, UGT1A9, UGT2B7, UGT2B15, <strong>and</strong> UGT2B17. Formation<br />
<strong>of</strong> the acyl glucuronide <strong>of</strong> T4 catalyzed <strong>by</strong> UGTs was in the order <strong>of</strong><br />
UGT1A3 UGT1A4, UGT2B7 UGT1A1; T4 acyl glucuronide<br />
was not detected with other UGT is<strong>of</strong>orms. Lower activity was<br />
observed with T3 as the substrate. Formation <strong>of</strong> T3 phenolic glucuronide<br />
followed the order <strong>of</strong> UGT1A8 UGT1A10 UGT1A3 <br />
UGT1A1. Trace activity was observed with UGT1A6 <strong>and</strong> UGT1A9;<br />
T3 phenolic glucuronide was not formed <strong>by</strong> UGT1A4 or UGT2B<br />
is<strong>of</strong>orms. Formation <strong>of</strong> T3 acyl glucuronide was observed with only<br />
four UGT is<strong>of</strong>orms in the order <strong>of</strong> UGT1A3 UGT1A4 UGT1A1,<br />
UGT2B7. UGT2B7 catalyzed the formation <strong>of</strong> both phenolic <strong>and</strong> acyl<br />
glucuronides <strong>of</strong> T4, whereas only the acyl glucuronide <strong>of</strong> T3 was<br />
detected with UGT2B7.
GLUCURONIDATION OF THYROXINE AND TRIIODOTHYRONINE<br />
2207<br />
FIG. 4. Product ions <strong>of</strong> m/z 953.5 for peaks eluted at 13.2 <strong>and</strong><br />
14.8 min.<br />
Number<br />
TABLE 3<br />
Table <strong>of</strong> chemical shifts for thyroxine <strong>and</strong> thyroxine glucuronide<br />
1 H<br />
<strong>Thyroxine</strong><br />
13 C<br />
<strong>Thyroxine</strong> Glucuronide<br />
2 5.27 103.14<br />
3 3.75<br />
4 3.5 76.14<br />
5 3.69 71.9<br />
6 3.69 76.06<br />
8 151.1 150.1<br />
9 84.4 90.65<br />
10 7.15 125.9 7.23 126.7<br />
11 150.4 152.7<br />
12 7.15 125.9 7.23 126.7<br />
13 84.4 90.65<br />
22 153.14 153.01<br />
23 90.4 90.4<br />
24 7.93 141.5 7.93 141.2<br />
25 141.5 141.1<br />
26 7.93 141.5 7.93 141.2<br />
27 90.51 90.4<br />
31 3.04/3.27 35.32 3.11/3.31 35.0<br />
32 3.81 55.71 4.16 55.0<br />
1 H<br />
13 C<br />
Species Differences in <strong>Glucuronidation</strong> <strong>of</strong> T4 <strong>and</strong> T3. Species<br />
differences were observed in glucuronidation <strong>of</strong> T4 <strong>and</strong> T3 (Figs. 10<br />
<strong>and</strong> 11) <strong>by</strong> liver microsomes. The microsomal UGT activities across<br />
species were normalized with P450 contents described under Materials<br />
<strong>and</strong> Methods. Formation <strong>of</strong> T4 phenolic glucuronide was in the<br />
order <strong>of</strong> mouse rat, human dog monkey, whereas formation <strong>of</strong><br />
T4 acyl glucuronide was in the order <strong>of</strong> human dog mouse, rat,<br />
monkey. Female rats had slightly higher activity than male rats in T4<br />
phenolic glucuronidation. Formation <strong>of</strong> T3 phenolic glucuronide was<br />
observed in the order <strong>of</strong> rat mouse dog monkey <strong>and</strong> human,<br />
whereas formation <strong>of</strong> T3 acyl glucuronide was observed in the order<br />
<strong>of</strong> human dog rat, monkey mouse. Female rats had higher<br />
activity than male rats in formation <strong>of</strong> T3 phenolic glucuronide.<br />
Humans generated the highest amounts <strong>of</strong> acyl glucuronides <strong>of</strong> T4 <strong>and</strong><br />
T3. <strong>In</strong> human liver microsomes, phenolic glucuronide was formed in<br />
higher amounts than acyl glucuronide for T4; in contrast, the acyl<br />
glucuronide was formed in slightly higher amounts than phenolic<br />
glucuronide for T3. Humans had the highest ratios <strong>of</strong> the acyl glucuronide<br />
<strong>of</strong> T4 or T3 to the phenolic glucuronide <strong>of</strong> T4 or T3. UGT<br />
activities toward T3 were lower than those toward T4 in all the<br />
species.
2208 TONG ET AL.<br />
FIG. 5. Comparison <strong>of</strong> the proton NMR<br />
spectra <strong>of</strong> T4 with that <strong>of</strong> phenolic glucuronide<br />
<strong>of</strong> T4.<br />
FIG. 6. Gradient selected heteronuclear multiple bond correlation<br />
NMR spectrum <strong>of</strong> phenolic glucuronide <strong>of</strong> T4.
GLUCURONIDATION OF THYROXINE AND TRIIODOTHYRONINE<br />
2209<br />
FIG. 9. <strong>Glucuronidation</strong> <strong>of</strong> T3 <strong>by</strong> recombinant human UGT. Data represent the<br />
average <strong>of</strong> duplicate experiments.<br />
FIG. 7. Effect <strong>of</strong> pH on the formation <strong>of</strong> the phenolic <strong>and</strong> acyl glucuronides <strong>of</strong> T4.<br />
Data represent the average <strong>of</strong> duplicate experiments.<br />
FIG. 8. <strong>Glucuronidation</strong> <strong>of</strong> T4 <strong>by</strong> recombinant human UGT. Data represent the<br />
average <strong>of</strong> duplicate experiments.<br />
Discussion<br />
Formation <strong>of</strong> the phenolic glucuronides <strong>of</strong> thyroid hormones has<br />
been well studied (Visser et al., 1993a,b; Visser, 1996). Study <strong>of</strong> the<br />
acyl glucuronides <strong>of</strong> T4 <strong>and</strong> T3 could be hindered <strong>by</strong> their low<br />
formation <strong>and</strong> instability. For example, Jemnitz <strong>and</strong> Vereczkey (1996)<br />
reported that T4 acyl glucuronide was completely hydrolyzed at 37°C<br />
in an overnight incubation even at pH 4.5. It is well documented that<br />
acyl glucuronides are labile <strong>and</strong> may undergo a number <strong>of</strong> reactions,<br />
including hydrolysis, rearrangement, <strong>and</strong> covalent binding to proteins,<br />
although the reactivity varies largely depending on their structures<br />
(Spahn-Langguth <strong>and</strong> Benet, 1992; Sallustio et al., 2000). Degradation<br />
<strong>of</strong> acyl glucuronides is pH-dependent (Dickinson <strong>and</strong> King, 1989;<br />
Smith <strong>and</strong> Liu, 1993; Sekikawa et al., 1995; McGurk et al., 1996), <strong>and</strong><br />
lower than physiological pH conditions have been used to favor the<br />
stability <strong>of</strong> acyl glucuronides (Shipkova et al., 2001). <strong>In</strong> the present<br />
study, a sensitive LC/MS method was developed for the first time to<br />
separate <strong>and</strong> detect the phenolic <strong>and</strong> acyl glucuronides <strong>of</strong> T4 <strong>and</strong> T3,<br />
<strong>and</strong> the structure <strong>of</strong> the phenolic glucuronide <strong>of</strong> T4 was unequivocally<br />
elucidated <strong>by</strong> LC/MS <strong>and</strong> NMR.<br />
Formation <strong>of</strong> the phenolic <strong>and</strong> acyl glucuronides <strong>of</strong> T4 <strong>and</strong> T3 is<br />
FIG. 10. Species comparison <strong>of</strong> T4 glucuronidation. Data represent the average <strong>of</strong><br />
duplicate experiments.<br />
catalyzed <strong>by</strong> multiple human UGT is<strong>of</strong>orms. UGT1A1, UGT1A3,<br />
UGT1A8, UGT1A10, <strong>and</strong> UGT2B4 are the major is<strong>of</strong>orms responsible<br />
for the formation <strong>of</strong> the phenolic glucuronide <strong>of</strong> T4. UGT1A1,<br />
UGT1A3, UGT1A8, <strong>and</strong> UGT1A10 are also the major is<strong>of</strong>orms<br />
catalyzing the formation <strong>of</strong> the phenolic glucuronide <strong>of</strong> T3, with lower<br />
activity than T4. UGT1A3 was the major is<strong>of</strong>orm catalyzing the<br />
formation <strong>of</strong> the acyl glucuronide <strong>of</strong> T4 <strong>and</strong> T3; minor activity was<br />
observed with UGT1A1, UGT1A4, <strong>and</strong> UGT2B7. Our results are<br />
consistent with literature reports <strong>and</strong> <strong>of</strong>fer some new insights into the<br />
UGTs involved in glucuronidation <strong>of</strong> these two compounds. Previous<br />
studies have showed that multiple UGT is<strong>of</strong>orms are involved in the<br />
formation <strong>of</strong> the phenolic glucuronides <strong>of</strong> T4 <strong>and</strong> T3 (Visser, 1996).<br />
T4 is predominantly glucuronidated in rat liver <strong>by</strong> both bilirubin <strong>and</strong><br />
phenol UGTs, whereas T3 is primarily conjugated <strong>by</strong> <strong>and</strong>rosterone<br />
UGT. <strong>In</strong> the V79 cell lines transfected with cDNA <strong>of</strong> different human<br />
UGTs, Visser et al. (1993a) reported significant conjugation <strong>of</strong> T4 <strong>by</strong><br />
bilirubin UGT HP3 (UGT1A1) <strong>and</strong> the phenol UGT HP4 (UGT1A9).<br />
However, the planar phenol UGT is<strong>of</strong>orm HP1 (UGT1A6) had little<br />
or no glucuronidation <strong>of</strong> iodothyronines. Similar findings were also<br />
reported <strong>by</strong> Findlay et al. (2000) with human liver microsomes.<br />
Vansell <strong>and</strong> Klaassen (2002) reported in rat hepatocytes that T4<br />
glucuronidation was catalyzed <strong>by</strong> UGT1A1 <strong>and</strong> UGT1A6, whereas
2210 TONG ET AL.<br />
conjugation <strong>of</strong> T3 was catalyzed <strong>by</strong> UGT2B2. That activity was<br />
detected with multiple human UGT is<strong>of</strong>orms in the present study<br />
might be attributed to overlapping substrate specificity for UGTs<br />
(Radominska-P<strong>and</strong>ya et al., 1999). Formation <strong>of</strong> the acyl glucuronides<br />
<strong>of</strong> thyroid hormones <strong>by</strong> UGT is<strong>of</strong>orms has not previously been<br />
reported. However, at least six human UGTs—UGT1A1, UGT1A3,<br />
UGT1A8, UGT1A9, UGT1A10, <strong>and</strong> UGT2B7—have been identified<br />
catalyzing the glucuronidation <strong>of</strong> carboxylic drugs (Gall et al., 1999;<br />
Mackenzie, 2000; Sallustio et al., 2000). These UGTs also catalyze<br />
the glucuronidation <strong>of</strong> a number <strong>of</strong> noncarboxylic acid compounds,<br />
including both endogenous <strong>and</strong> xenobiotic chemicals, <strong>and</strong> have overlapping<br />
but different substrate specificities (Sallustio et al., 2000).<br />
Significant differences in relative specificities toward the same carboxylic<br />
acid substrates have been shown (Sallustio et al., 2000).<br />
Formation <strong>of</strong> acyl glucuronides <strong>of</strong> T4 <strong>and</strong> T3 <strong>by</strong> UGT1A8, UGT1A9,<br />
or UGT1A10 was not observed in the present study. UGT1A4, which<br />
conjugates a structurally diverse group <strong>of</strong> compounds including drugs,<br />
xenobiotics, hydroxysteroids, <strong>and</strong> particularly primary, secondary,<br />
<strong>and</strong> tertiary amine-containing compounds (Green et al., 1995; Green<br />
<strong>and</strong> Tephly, 1996), yielded the acyl but not the phenolic glucuronide<br />
<strong>of</strong> T4 <strong>and</strong> T3. Because UGT1A7, UGT1A8, <strong>and</strong> UGT1A10 are<br />
extrahepatic enzymes (Strassburg et al., 1997, 1999), UGT1A1 <strong>and</strong><br />
UGT1A3, which are expressed in human liver, may play major roles<br />
in T4 glucuronidation in humans.<br />
Species differences in glucuronidation <strong>of</strong> T4 <strong>and</strong> T3 were also<br />
observed under the experimental conditions. Mice have much higher<br />
activity toward T4 than any other species, whereas rats have the<br />
highest activity toward T3 among all the species examined. Female<br />
rats show higher T3 UGT activity than male rats. The yields <strong>of</strong> T3<br />
phenolic glucuronide were lower, whereas the acyl glucuronides <strong>of</strong><br />
both T4 <strong>and</strong> T3 were formed in higher amounts in humans among the<br />
species examined. Species <strong>and</strong> sex differences in UGT activities<br />
toward thyroid hormones have not been well documented, although<br />
species differences in response to chemical inducers have been reported<br />
(Craft et al., 2002; Kato et al., 2003).<br />
<strong>In</strong> summary, a novel LC/MS method was developed to separate <strong>and</strong><br />
detect the phenolic <strong>and</strong> acyl glucuronides <strong>of</strong> T4 <strong>and</strong> T3. This method<br />
was used to evaluate a number <strong>of</strong> UGT is<strong>of</strong>orms for formation <strong>of</strong> the<br />
phenolic <strong>and</strong> acyl glucuronides <strong>of</strong> T4 <strong>and</strong> T3 to study species differences<br />
in T4 <strong>and</strong> T3 glucuronidation in liver microsomes <strong>of</strong> animals<br />
<strong>and</strong> humans. Among the 11 UGT is<strong>of</strong>orms examined, UGT1A1,<br />
UGT1A3, UGT1A8, UGT1A10, <strong>and</strong> UGT2B4 were the major is<strong>of</strong>orms<br />
responsible for the formation <strong>of</strong> T4 phenolic glucuronide,<br />
whereas UGT1A1, UGT1A3, UGT1A8, <strong>and</strong> UGT1A10 catalyzed the<br />
formation <strong>of</strong> T3 phenolic glucuronide. UGT1A3 was the major is<strong>of</strong>orm<br />
responsible for the formation <strong>of</strong> the acyl glucuronides <strong>of</strong> T4 <strong>and</strong><br />
T3. The activity in formation <strong>of</strong> T4 <strong>and</strong> T3 phenolic glucuronide was<br />
lower, whereas the activity in formation <strong>of</strong> T4 <strong>and</strong> T3 acyl glucuronides<br />
was higher in human liver microsomes than in other species.<br />
Acknowledgments. We thank Li Shen for her suggestions <strong>and</strong> help<br />
in the literature search, Lisa Nogle for her help in the NMR analysis,<br />
<strong>and</strong> Theresa Hultin <strong>and</strong> JoAnn Scatina for supporting this research<br />
<strong>and</strong> reviewing the manuscript.<br />
References<br />
FIG. 11. Species comparison <strong>of</strong> T3 glucuronidation. Data represent the average <strong>of</strong><br />
duplicate experiments.<br />
Craft ES, DeVito MJ, <strong>and</strong> Cr<strong>of</strong>ton KM (2002) Comparative responsiveness <strong>of</strong> hypothyroxinemia<br />
<strong>and</strong> hepatic enzyme induction in Long-Evans rats versus C57BL/6J mice exposed to TCDDlike<br />
<strong>and</strong> phenobarbital-like polychlorinated biphenyl congeners. Toxicol Sci 68:372–380.<br />
Croasmun W <strong>and</strong> Carlson R (1994) Two-Dimensional NMR Spectroscopy, VCH Publishers,<br />
Weinheim, Germany.<br />
Dickinson RG <strong>and</strong> King AR (1989) Reactivity considerations in the analysis <strong>of</strong> glucuronide <strong>and</strong><br />
sulfate conjugates <strong>of</strong> diflunisal. Ther Drug Monit 11:712–720.<br />
Findlay KA, Kaptein E, Visser TJ, <strong>and</strong> Burchell B (2000) Characterization <strong>of</strong> the uridine<br />
diphosphate-glucuronosyltransferase-catalyzing thyroid hormone glucuronidation in man.<br />
J Clin Endocrinol Metab 85:2879–2883.<br />
Gall WE, Zawada G, Mojarrabi B, Tephly TR, Green MD, C<strong>of</strong>fman BL, Mackenzie PI, <strong>and</strong><br />
Radominska-P<strong>and</strong>ya A (1999) Differential glucuronidation <strong>of</strong> bile acids, <strong>and</strong>rogens <strong>and</strong><br />
estrogens <strong>by</strong> human UGT1A3 <strong>and</strong> 2B7. J Steroid Biochem Mol Biol 70:101–108.<br />
Green MD, Bishop WP, <strong>and</strong> Tephly TR (1995) Expressed human Ugt1.4 protein catalyzes the<br />
formation <strong>of</strong> quaternary ammonium-linked glucuronides. Drug Metab Dispos 23:299–302.<br />
Green MD <strong>and</strong> Tephly TR (1996) <strong>Glucuronidation</strong> <strong>of</strong> amines <strong>and</strong> hydroxylated xenobiotics <strong>and</strong><br />
endobiotics catalyzed <strong>by</strong> expressed human Ugt1.4 protein. Drug Metab Dispos 24:356–363.<br />
Jemnitz K <strong>and</strong> Vereczkey L (1996) Ion-pair high-performance liquid chromatographic separation<br />
<strong>of</strong> two thyroxine glucuronides formed <strong>by</strong> rat liver microsomes. J Chromatogr B 681:385–389.<br />
Kato Y, Haraguchi K, Yamazaki T, Ito Y, Miyajima S, Nemoto K, Koga N, Kimura R, <strong>and</strong><br />
Degawa M (2003) Effects <strong>of</strong> polychlorinated biphenyls, Kanechlor-500, on serum thyroid<br />
hormone levels in rats <strong>and</strong> mice. Toxicol Sci 72:235–241.<br />
Köhrle J, Brabant G, <strong>and</strong> Hesch RD (1987) Metabolism <strong>of</strong> thyroid hormones. Horm Res<br />
26:58–78.<br />
Mackenzie PI (2000) Identification <strong>of</strong> uridine diphosphate glucuronosyltransferases involved in<br />
the metabolism <strong>and</strong> clearance <strong>of</strong> mycophenolic acid. Ther Drug Monit 22:10–13.<br />
McGurk KA, Remmel RP, Hosagrahara VP, Tosh D, <strong>and</strong> Burchell B (1996) Reactivity <strong>of</strong><br />
mefenamic acid 1-O-acyl glucuronide with proteins in vitro <strong>and</strong> ex vivo. Drug Metab Dispos<br />
24:842–849.<br />
Radominska-P<strong>and</strong>ya A, Czernik PJ, Little JM, Battaglia E, <strong>and</strong> Mackenzie PI (1999) Structural<br />
<strong>and</strong> functional studies <strong>of</strong> UDP-glucuronosyltransferases. Drug Metab Rev 31:817–899.<br />
Saito K, Kaneko H, Sato K, Yoshitake A, <strong>and</strong> Yamada H (1991) Hepatic UDPglucuronosyltransferase(s)<br />
activity toward thyroid hormones in rats: induction <strong>and</strong> effects on<br />
serum thyroid hormone levels following treatment with various enzyme inducers. Toxicol Appl<br />
Pharmacol 111:99–106.<br />
Sallustio BC, Sabordo L, Evans AM, <strong>and</strong> Nation RL (2000) Hepatic disposition <strong>of</strong> electrophilic<br />
acyl glucuronide conjugates. Curr Drug Metab 1:163–180.<br />
Sekikawa H, Yagi N, Lin ET, <strong>and</strong> Benet LZ (1995) Apparent intramolecular acyl migration <strong>and</strong><br />
hydrolysis <strong>of</strong> furosemide glucuronide in aqueous solution. Biol Pharm Bull 18:134–139.<br />
Shipkova M, Strassburg C, Braun F, Streit F, Grone H-J, Armstrong V, Tukey R, Oellerich M,<br />
<strong>and</strong> Wiel<strong>and</strong> E (2001) Glucuronide <strong>and</strong> glucoside conjugation <strong>of</strong> mycophenolic acid <strong>by</strong> human<br />
liver, kidney <strong>and</strong> intestinal microsomes. Br J Pharmacol 132:1027–1034.<br />
Smith PC <strong>and</strong> Liu JH (1993) Covalent binding <strong>of</strong> supr<strong>of</strong>en acyl glucuronide to albumin in vitro.<br />
Xenobiotica 23:337–348.<br />
Spahn-Langguth H <strong>and</strong> Benet LZ (1992) Active <strong>and</strong> reactive phase-II metabolites: the glucuronides<br />
pathway, in Top Pharm Sci 1991 (Crommelin DJA <strong>and</strong> Midha KK eds) pp 505–516,<br />
Medpharm Scientific Publishers, Stuttgart, Germany.<br />
Strassburg CP, Nguyen N, Manns MP, <strong>and</strong> Tukey RH (1999) UDP-glucuronosyltransferase<br />
activity in human liver <strong>and</strong> colon. Gastroenterology 116:149–160.<br />
Strassburg CP, Oldhafer K, Manns MP, <strong>and</strong> Tukey RH (1997) Differential expression <strong>of</strong> the<br />
UGT1A locus in human liver, biliary, <strong>and</strong> gastric tissue: identification <strong>of</strong> UGT1A7 <strong>and</strong><br />
UGT1A10 transcripts in extrahepatic tissue. Mol Pharmacol 52:212–220.<br />
Vansell NR <strong>and</strong> Klaassen CD (2002) <strong>In</strong>crease in rat liver UDP-glucuronosyltransferase mRNA<br />
<strong>by</strong> microsomal enzyme inducers that enhance thyroid hormone glucuronidation. Drug Metab<br />
Dispos 30:240–246.<br />
Visser TJ (1996) Pathways <strong>of</strong> thyroid hormone metabolism. Acta Med Austriaca 23:10–16.<br />
Visser TJ, Kaptein E, Gijzel AL, de Herder WW, Ebner T, <strong>and</strong> Burchell B (1993a) <strong>Glucuronidation</strong><br />
<strong>of</strong> thyroid hormone <strong>by</strong> human bilirubin <strong>and</strong> phenol UDP-glucuronyltransferase isozymes.<br />
FEBS Lett 324:358–360.<br />
Visser TJ, Kaptein E, Van Toor H, Van Raaij JAGM, Van den Berg KJ, Tjong Tjin Joe C, Van<br />
Engelen JGM, <strong>and</strong> Brouwer A (1993b) <strong>Glucuronidation</strong> <strong>of</strong> thyroid hormone in rat liver: effects<br />
<strong>of</strong> in vivo treatment with microsomal enzyme inducers <strong>and</strong> in vitro assay conditions. Endocrinology<br />
133:2177–2186.<br />
Address correspondence to: Zeen Tong, Drug Safety <strong>and</strong> Metabolism,<br />
Wyeth Research, 500 Arcola Road, Collegeville, PA 19426. E-mail: tongz@<br />
wyeth.com