Coastal Erosion Responses for Alaska - the National Sea Grant ...
Coastal Erosion Responses for Alaska - the National Sea Grant ...
Coastal Erosion Responses for Alaska - the National Sea Grant ...

Create successful ePaper yourself
Turn your PDF publications into a flip-book with our unique Google optimized e-Paper software.
46 Richmond—Understanding Shoreline Change<br />
5<br />
Cowell Beach<br />
4<br />
3<br />
2<br />
Elevation (m)<br />
1<br />
0<br />
-1<br />
50 100 150 200 250 300<br />
-2<br />
-3<br />
-4<br />
-5<br />
Distance (m)<br />
10/15/97<br />
11/21/97<br />
12/17/97<br />
1/28/98<br />
2/4/98<br />
2/9/98<br />
2/26/98<br />
4/4/98<br />
4/26/98<br />
6/4/98<br />
7/9/98<br />
8/5/98<br />
10/26/98<br />
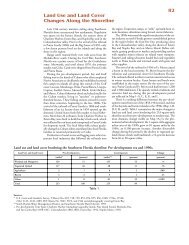
Figure 2. Cross-shore profiles from Cowell Beach, Santa Cruz, Cali<strong>for</strong>nia, showing <strong>the</strong> seasonal<br />
erosion and accretion trends during 1997-98 El Niño event. Minimum beach<br />
width occurred in February and is coincident with <strong>the</strong> maximum storm waves.<br />
The net result was little change over <strong>the</strong> course of a year.<br />
Monitoring shoreline changes<br />
The most common and widespread method of monitoring shoreline change<br />
is repeated profiling of <strong>the</strong> <strong>for</strong>eshore in an ef<strong>for</strong>t to capture seasonal and longterm<br />
changes in shoreline position. Methodology varies from traditional<br />
shore-normal survey lines to 3-dimensional survey arrays that incorporate<br />
land-based and offshore survey techniques. Generally, a yearlong record of<br />
repeated surveys is needed to identify gross seasonal changes. Multiyear monitoring<br />
is needed to track longer-term changes. The time between successive<br />
surveys can range from days to months and is determined by desired outcomes<br />
of <strong>the</strong> study. High rates of coastal change typically require more frequent surveys,<br />
whereas slow-changing coasts need fewer surveys to capture <strong>the</strong> rate<br />
of change. Figure 2 is an example of shore-normal beach profiles taken to<br />
document beach erosion and recovery during <strong>the</strong> 1997-98 El Niño in central<br />
Cali<strong>for</strong>nia.