Coastal Erosion Responses for Alaska - the National Sea Grant ...
Coastal Erosion Responses for Alaska - the National Sea Grant ...
Coastal Erosion Responses for Alaska - the National Sea Grant ...

Create successful ePaper yourself
Turn your PDF publications into a flip-book with our unique Google optimized e-Paper software.
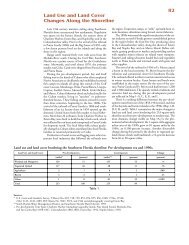
44 Richmond—Understanding Shoreline Change<br />
tific preference, different proxies <strong>for</strong> shoreline position are used to document<br />
coastal change, including <strong>the</strong> high water line, wet-dry line, vegetation line,<br />
dune toe or crest, toe of <strong>the</strong> beach, cliff base or top, and <strong>the</strong> line of mean high<br />
water (MHW).<br />
Aerial photography has several types of inherent distortions and displacements<br />
associated with <strong>the</strong> geometry of <strong>the</strong> camera system, <strong>the</strong> change in <strong>the</strong><br />
position of <strong>the</strong> aircraft from one photo to ano<strong>the</strong>r, and <strong>the</strong> relief of <strong>the</strong> terrain<br />
being mapped. Digital photogrammetry is <strong>the</strong> current preferred method used<br />
to remove <strong>the</strong>se displacements using digital imagery (usually scanned diapositives<br />
of vertial stereopair photographs). GPS ground control points are used<br />
to relate <strong>the</strong> imagery to true ground space so that <strong>the</strong> images can be georeferenced.<br />
The processing provides a fully orthorectified, or corrected, image<br />
that can be used as a base map. The orthorectification process requires <strong>the</strong><br />
generation of a digital terrain model (DTM), which involves taking user-input<br />
measurements (ground control points and tie-points) and deriving <strong>the</strong> DTM<br />
from a stereo model through interpolation (Ackermann 1996). The DTM itself<br />
is a network of grid points containing XYZ in<strong>for</strong>mation. Additionally, breaklines<br />
can be added to areas between grid points where <strong>the</strong> topography changes<br />
abruptly, such as <strong>the</strong> top edge or base of a sea cliff. Breaklines, which allow<br />
<strong>for</strong> more accurate definition of topographic changes, can only be added to <strong>the</strong><br />
DTM while viewing in stereo, in order to see <strong>the</strong> elevation changes in 3 dimensions.<br />
Once <strong>the</strong> imagery is orthorectified, orthophotographs and mosaics can<br />
be created that provide distortion-free, georeferenced base maps. The rectified<br />
stereo model can also be displayed on a stereo-viewing monitor, and accurate,<br />
georeferenced measurements can be acquired directly from <strong>the</strong> model.<br />
Airborne lidar<br />
Airborne lidar surveys ground elevation using an elliptically rotating bluegreen<br />
laser. GPS (global positioning system) positions and inertial navigation<br />
systems are used to correct <strong>for</strong> aircraft pitch, roll, and heading, providing<br />
ground elevations with accuracies of about ±15 cm (Sallenger et al. 2003). To<br />
compare lidar-derived datum-based shorelines with historical shorelines, a<br />
comparable shoreline reference feature must be used. In a study by Morton<br />
et al. (2004) comparing historical NOAA T-sheet shorelines with a modern<br />
lidar-derived shoreline <strong>the</strong> MHW shoreline was <strong>the</strong> reference feature. The lidar<br />
shoreline was determined from densely spaced airborne lidar data, using a<br />
method developed in 2002 by Stockdon et al., where shorelines were extracted<br />
from cross-shore profiles which consist of bands of lidar data 10 m wide in <strong>the</strong><br />
alongshore direction and spaced every 20 m along <strong>the</strong> coast. Repeating this<br />
procedure at successive profiles 20 m apart generates points that can be connected<br />
to create a continuous shoreline. An example of a historical analysis<br />
utilizing historical T-sheet derived shorelines compared with a modern lidarderived<br />
shoreline is shown in Fig. 1.