Monthly Economic Indicators - May 2011 - City of Greater Geelong
Monthly Economic Indicators - May 2011 - City of Greater Geelong
Monthly Economic Indicators - May 2011 - City of Greater Geelong

Create successful ePaper yourself
Turn your PDF publications into a flip-book with our unique Google optimized e-Paper software.
<strong>May</strong> <strong>2011</strong><br />
<strong>Economic</strong> Indicator Movement Status (Favorable/Unfavorable)<br />
<strong>Monthly</strong> Unemployment Rate<br />
<br />
Weekly Job Advertisements -<br />
<strong>Monthly</strong> Online Job Advertisements<br />
<strong>Monthly</strong> Domestic Building Activity<br />
<strong>Monthly</strong> Non-Domestic Building Activity<br />
Quarterly Median House Prices<br />
Quarterly ABN Registrations<br />
<br />
<br />
<br />
<br />
<br />
Key Points:<br />
The unemployment rate for the Barwon Western District in April <strong>2011</strong> was 4.1%<br />
(a decrease <strong>of</strong> 2.3 percentage points compared to the previous month).<br />
During <strong>May</strong> <strong>2011</strong> an average <strong>of</strong> 158 regional job advertisements were in the <strong>Geelong</strong> Advertiser each week<br />
(no change on the previous month).<br />
During April <strong>2011</strong> there were 636 new regional job advertisements added to the Seek website (a decrease <strong>of</strong><br />
16.0% compared to the previous month)<br />
A total <strong>of</strong> 249 domestic new building permits were issued in the <strong>City</strong> <strong>of</strong> <strong>Greater</strong> <strong>Geelong</strong> in March <strong>2011</strong> (an<br />
increase <strong>of</strong> 28.4% on the previous month).<br />
A total <strong>of</strong> 55 non-domestic building permits were issued in the <strong>City</strong> <strong>of</strong> <strong>Greater</strong> <strong>Geelong</strong> in March <strong>2011</strong> (an increase<br />
<strong>of</strong> 52.3% on the previous month).<br />
The median house price in the <strong>City</strong> <strong>of</strong> <strong>Greater</strong> <strong>Geelong</strong> decreased to $385,000 in the March <strong>2011</strong> quarter<br />
(a decrease <strong>of</strong> 1.3% on the previous quarter).<br />
A total <strong>of</strong> 461 new ABNs were registered in the <strong>City</strong> <strong>of</strong> <strong>Greater</strong> <strong>Geelong</strong> during the December 2010 quarter<br />
(a decrease <strong>of</strong> 56.2% on the previous quarter).<br />
Consumer Confidence:<br />
The Westpac–Melbourne Institute Consumer Sentiment fell 1.3% in <strong>May</strong> from 105.3 in April to 103.9 in <strong>May</strong> . (More<br />
detail available on the last page).<br />
(An Index over 100 indicates that optimists outweigh pessimists)<br />
Business Confidence:<br />
Business confidence eased a little in April to +7. (More detail available on the last page).<br />
(An Index above zero indicates that optimists outweigh pessimists)<br />
KEY ECONOMIC INDICATORS MAY <strong>2011</strong> – ECONOMIC DEVELOPMENT – CITY OF GREATER GEELONG
<strong>Monthly</strong> Unemployment Rate - Australian Bureau <strong>of</strong> Statistics<br />
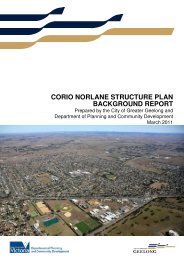
The unemployment rate for the Barwon Western District in April <strong>2011</strong> was 4.1%, a decrease <strong>of</strong> 2.3 percentage<br />
points on the previous month, and an increase <strong>of</strong> 0.6pts compared to April 2010.<br />
The April unemployment rate for the Barwon Western District was 0.7 percentage points lower than the<br />
Victorian unemployment rate (4.8%) and 0.8pts lower than the Australian unemployment rate (4.9%).<br />
A twelve month average <strong>of</strong> the unemployment rate to April <strong>2011</strong> for the Barwon Western District was 5.9%,<br />
0.7pts higher than Victoria (5.2%) and 0.8pts higher than Australia (5.1%).<br />
Barwon Western District Victoria Australia**<br />
Unemployment<br />
Rate<br />
Change*<br />
Percentage<br />
Points<br />
Unemployment<br />
Rate<br />
Change*<br />
Percentage<br />
Points<br />
Unemployment<br />
Rate<br />
Change*<br />
Percentage<br />
Points<br />
Latest Month<br />
(April <strong>2011</strong>) 4.1%<br />
4.8%<br />
4.9%<br />
-2.3pts<br />
+0.1pts<br />
Previous Month<br />
(March <strong>2011</strong>) 6.4% 4.7% 5.0%<br />
-0.1pts<br />
Same Month<br />
Last Year<br />
(April 2010)<br />
12 Month<br />
Average<br />
(to April <strong>2011</strong>)<br />
4.7% +0.6pts 5.6% +0.8pts 5.4% +0.5pts<br />
5.9% 5.2% 5.1%<br />
5 Year Trend<br />
Line Analysis<br />
(Apr 06 – Apr 11)<br />
-0.6pts<br />
-0.9pts<br />
Source: Australian Bureau <strong>of</strong> Statistics<br />
* Change in percentage points is based on differences between the latest month and earlier figures as specified.<br />
** Data for Australia is sometimes revised from previously published data.<br />
<strong>Monthly</strong> Unemployment Rate April 2006 – April <strong>2011</strong><br />
Percentage (%)<br />
10.0<br />
9.0<br />
Barw on Western District<br />
Victoria<br />
8.0<br />
7.0<br />
6.0<br />
5.0<br />
4.0<br />
3.0<br />
2.0<br />
1.0<br />
0.0<br />
A M J J A S O N D J F M A M J J A S O N D J F M A M J J A S O N D J F M A M J J A S O N D J F M A M J J A S O N D J F M A<br />
2006 2007<br />
2008 2009<br />
2010<br />
Source: Australian Bureau <strong>of</strong> Statistics<br />
KEY ECONOMIC INDICATORS MAY <strong>2011</strong> – ECONOMIC DEVELOPMENT – CITY OF GREATER GEELONG
<strong>May</strong>-06<br />
Jul-06<br />
Sep-06<br />
Nov-06<br />
Jan-07<br />
Mar-07<br />
<strong>May</strong>-07<br />
Jul-07<br />
Sep-07<br />
Nov-07<br />
Jan-08<br />
Mar-08<br />
<strong>May</strong>-08<br />
Jul-08<br />
Sep-08<br />
Nov-08<br />
Jan-09<br />
Mar-09<br />
<strong>May</strong>-09<br />
Jul-09<br />
Sep-09<br />
Nov-09<br />
Jan-10<br />
Mar-10<br />
<strong>May</strong>-10<br />
Jul-10<br />
Sep-10<br />
Nov-10<br />
Jan-11<br />
Mar-11<br />
<strong>May</strong>-11<br />
Job Advertisements – Barwon Region<br />
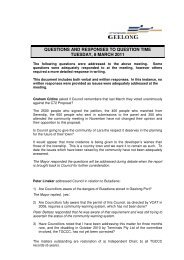
On average, 158 regional job vacancies were advertised each week in the <strong>Geelong</strong> Advertiser during <strong>May</strong><br />
<strong>2011</strong>. This represents no change on the average for April <strong>2011</strong> and an increase <strong>of</strong> 3.9% on the figure for <strong>May</strong><br />
2010.<br />
Quarterly updates are available for the online job advertisements, graph has been updated with last quarter.<br />
<strong>Geelong</strong> Advertiser<br />
Seek Limited<br />
Average Weekly<br />
Job Ads<br />
Percentage<br />
Change*<br />
New <strong>Monthly</strong> Job<br />
Ads**<br />
Latest Month (<strong>May</strong> <strong>2011</strong>) 158<br />
No update<br />
-<br />
Previous Month (April <strong>2011</strong>) 158 636<br />
Percentage<br />
Change*<br />
-<br />
Same Month Last Year (<strong>May</strong> 2010) 152 +3.9% 486 -<br />
YEARLY AVERAGES<br />
12 Month Average (2010) 176<br />
577<br />
+15.0%<br />
12 Month Average (2009) 153 432<br />
+33.6%<br />
12 Month Average (2008) 217 -18.9% 589 -2.0%<br />
Source: <strong>Geelong</strong> Advertiser ‘Career One’ Saturday employment section & Seek Limited www.seek.com.au.<br />
* Percentage change is based on differences between the latest month and earlier figures as specified.<br />
** Relates to monthly job ad volume for the area ‘<strong>Geelong</strong> and Great Ocean Road’ as specified by the employer.<br />
Job Advertisements, Barwon Region, <strong>May</strong> 2006 – <strong>May</strong> <strong>2011</strong><br />
Number Ave. Weekly Job Ads (<strong>Geelong</strong> Advertiser) New <strong>Monthly</strong> Job Ads (seek.com.au)<br />
900<br />
800<br />
700<br />
600<br />
500<br />
400<br />
300<br />
200<br />
100<br />
0<br />
Source: <strong>Geelong</strong> Advertiser ‘Career One’ Saturday employment section & Seek Limited www.seek.com.au.<br />
<strong>Geelong</strong> Advertiser data includes ads for all paid full-time, part-time and casual positions in the Barwon Region. The spike in job ads in<br />
June 2006 was due to recruitment for a new call centre. The spike in online job ads between June 2010 and July 2010 is due to Seek’s<br />
expansion <strong>of</strong> the geographic classification <strong>of</strong> job ads from ‘<strong>Geelong</strong>’ to ‘<strong>Geelong</strong> and Great Ocean Road’.<br />
KEY ECONOMIC INDICATORS MAY <strong>2011</strong> – ECONOMIC DEVELOPMENT – CITY OF GREATER GEELONG
Number <strong>of</strong> Permits<br />
Mar-08<br />
<strong>May</strong>-08<br />
Jul-08<br />
Sep-08<br />
Nov-08<br />
Jan-09<br />
Mar-09<br />
<strong>May</strong>-09<br />
Jul-09<br />
Sep-09<br />
Nov-09<br />
Jan-10<br />
Mar-10<br />
<strong>May</strong>-10<br />
Jul-10<br />
Sep-10<br />
Nov-10<br />
Jan-11<br />
Mar-11<br />
Value <strong>of</strong> Permits ($m)<br />
Domestic Building Activity – <strong>City</strong> <strong>of</strong> <strong>Greater</strong> <strong>Geelong</strong><br />
Number and Value <strong>of</strong> Domestic New Building Permits<br />
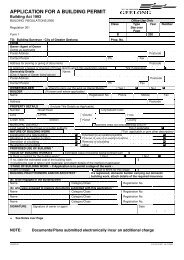
A total <strong>of</strong> 249 domestic new building permits were issued in the <strong>City</strong> <strong>of</strong> <strong>Greater</strong> <strong>Geelong</strong> in March <strong>2011</strong>, an<br />
increase <strong>of</strong> 28.4% on the previous month and a decrease <strong>of</strong> 7.4% compared to March 2010.<br />
The value <strong>of</strong> domestic new building permits in March <strong>2011</strong> was $41.0m, an increase <strong>of</strong> 6.2% on the previous<br />
month and a decrease <strong>of</strong> 17.5% on the value <strong>of</strong> permits in March 2010.<br />
Number <strong>of</strong><br />
Permits<br />
Percentage<br />
Change*<br />
Value <strong>of</strong><br />
Permits<br />
Percentage<br />
Change*<br />
MONTHLY TOTALS<br />
Latest Month (March <strong>2011</strong>) 249<br />
$41.0m<br />
+28.4%<br />
Previous Month (February <strong>2011</strong>) 194 $38.6m<br />
+6.2%<br />
Same Month Last Year (Mar 2010) 269 -7.4% $49.7m -17.5%<br />
ANNUAL TOTALS<br />
2010 2,682<br />
$486.5m<br />
+16.4%<br />
2009 2,305 $364.2m<br />
+33.6%<br />
2008 2,317 +15.8% $329.3m +47.7%<br />
Source: Building Commission<br />
* Percentage change is based on differences between the latest month and earlier figures as specified.<br />
Number and Value <strong>of</strong> Domestic Permits - New Buildings<br />
300<br />
No. <strong>of</strong> Permits<br />
Value <strong>of</strong> Permits ($m)<br />
60<br />
250<br />
50<br />
200<br />
40<br />
150<br />
30<br />
100<br />
20<br />
50<br />
10<br />
0<br />
0<br />
Source: Building Commission<br />
KEY ECONOMIC INDICATORS MAY <strong>2011</strong> – ECONOMIC DEVELOPMENT – CITY OF GREATER GEELONG
Non-Domestic Building Activity – <strong>City</strong> <strong>of</strong> <strong>Greater</strong> <strong>Geelong</strong><br />
Number and Value <strong>of</strong> Non-Domestic Building Permits<br />
A total <strong>of</strong> 55 non-domestic building permits were issued in the <strong>City</strong> <strong>of</strong> <strong>Greater</strong> <strong>Geelong</strong> in March <strong>2011</strong>, an<br />
increase <strong>of</strong> 52.3% on the previous month and an increase <strong>of</strong> 19.6% compared to March 2010.<br />
The value <strong>of</strong> non-domestic building permits was $25.5m in March <strong>2011</strong>, a decrease <strong>of</strong> 57.6% on the previous<br />
month and a decrease <strong>of</strong> 9.9% on the figure for March 2010.<br />
Number <strong>of</strong><br />
Permits<br />
Percentage<br />
Change*<br />
Value <strong>of</strong><br />
Permits<br />
Percentage<br />
Change*<br />
MONTHLY TOTALS<br />
Latest Month (March <strong>2011</strong>) 55<br />
$25.5m<br />
+52.3%<br />
Previous Month (February <strong>2011</strong>) 36 $60.2m<br />
-57.6%<br />
Same Month Last Year (Mar 2010) 46 +19.6% $28.3m -9.9%<br />
ANNUAL TOTALS<br />
2010 588<br />
$288.8m<br />
-15.4%<br />
2009 695 $300.7m<br />
-4.0%<br />
2008 735 -20.0% $350.5m -17.6%<br />
Source: Building Commission<br />
* Percentage change is based on differences between the latest month and earlier figures as specified.<br />
Source: Building Commission<br />
KEY ECONOMIC INDICATORS MAY <strong>2011</strong> – ECONOMIC DEVELOPMENT – CITY OF GREATER GEELONG
Mar-06<br />
Jun-06<br />
Sep-06<br />
Dec-06<br />
Mar-07<br />
Jun-07<br />
Sep-07<br />
Dec-07<br />
Mar-08<br />
Jun-08<br />
Sep-08<br />
Dec-08<br />
Mar-09<br />
Jun-09<br />
Sep-09<br />
Dec-09<br />
Mar-10<br />
Jun-10<br />
Sep-10<br />
Dec-10<br />
Mar-10<br />
Median House Prices – <strong>City</strong> <strong>of</strong> <strong>Greater</strong> <strong>Geelong</strong><br />
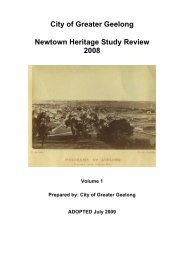
The median house price in the <strong>City</strong> <strong>of</strong> <strong>Greater</strong> <strong>Geelong</strong> decreased to $385,000 in the March <strong>2011</strong> quarter, a<br />
decrease <strong>of</strong> 1.3% on the previous quarter and an increase <strong>of</strong> 8.8% on the March 2010 quarter.<br />
Median House Price<br />
Percentage Change*<br />
QUARTERLY FIGURES<br />
Latest Quarter (March <strong>2011</strong>)<br />
Previous Quarter (Dec 2010)<br />
$385,000p<br />
$390,000r<br />
-1.3%<br />
Same Quarter Last Year (March 2010) $354,000r +8.8%<br />
ANNUAL FIGURES<br />
2010p $372,250<br />
2009 $328,563<br />
+13.3%<br />
2008 $319,000 +16.7%<br />
Source: Real Estate Institute <strong>of</strong> Victoria<br />
* Percentage change is based on differences between the latest month and earlier figures as specified.<br />
p - preliminary<br />
r – revised<br />
Quarterly Median House Prices<br />
$450,000<br />
$400,000<br />
$350,000<br />
$300,000<br />
$250,000<br />
$200,000<br />
$150,000<br />
$100,000<br />
$50,000<br />
$-<br />
Quarter<br />
Source: Real Estate Institute <strong>of</strong> Victoria<br />
KEY ECONOMIC INDICATORS MAY <strong>2011</strong> – ECONOMIC DEVELOPMENT – CITY OF GREATER GEELONG
New ABN Registrations – <strong>City</strong> <strong>of</strong> <strong>Greater</strong> <strong>Geelong</strong><br />
A total <strong>of</strong> 461 new ABNs were registered in the <strong>City</strong> <strong>of</strong> <strong>Greater</strong> <strong>Geelong</strong> during the December 2010 quarter, a<br />
decrease <strong>of</strong> 56.2% on the previous quarter. The only increases were experienced in the following industries:<br />
Mining: Public Administration and Safety.<br />
A total <strong>of</strong> 3,001 new ABNs were registered in the year to the December 2010 quarter, a decrease <strong>of</strong> 3.9%<br />
compared to the year to the September 2010 quarter.<br />
Quarterly<br />
Year to…<br />
Industry<br />
Latest<br />
(Dec 2010)<br />
Previous<br />
(Sep 2010)<br />
Trend<br />
Dec<br />
2010<br />
Sep<br />
2010 Trend<br />
Accommodation & Food Services 10 32 ↓ 78 70 ↑<br />
Administrative & Support Services 27 54 ↓ 177 192 ↓<br />
Agriculture, Forestry & Fishing 6 10 ↓ 30 32 ↓<br />
Arts & Recreation Services 10 23 ↓ 65 66 ↓<br />
Construction 91 168 ↓ 521 536 ↓<br />
Education & Training 6 17 ↓ 49 57 ↓<br />
Electricity, Gas, Water & Waste Services 0 2 ↓ 3 6 ↓<br />
Financial & Insurance Services 2 8 ↓ 16 19 ↓<br />
Health Care & Social Assistance 16 45 ↓ 118 111 ↑<br />
Information Media & Telecommunications 2 4 ↓ 10 18 ↓<br />
Manufacturing 7 14 ↓ 42 56 ↓<br />
Mining 1 0 ↑ 1 2 ↓<br />
Personal & Other Services 190 445 ↓ 1270 1306 ↓<br />
Pr<strong>of</strong>essional, Scientific & Technical Services 36 101 ↓ 272 267 ↑<br />
Public Administration & Safety 4 2 ↑ 10 6 ↑<br />
Rental, Hiring & Real Estate Services 10 22 ↓ 69 77 ↓<br />
Retail Trade 19 59 ↓ 140 136 ↓<br />
Transport, Postal & Warehousing 16 37 ↓ 99 128 ↓<br />
Wholesale Trade 8 9 ↓ 31 36 ↓<br />
Totals 461 1052 -56.2 3001 3121 -3.9<br />
Source: Department <strong>of</strong> Innovation, Industry & Regional Development, Small Business Victoria.<br />
* ABN registrations are defined as an active and registered ABN (not cancelled or refused) and excludes trusts and super funds.<br />
This data is not intended to be an exact count <strong>of</strong> the number <strong>of</strong> businesses in the municipality but an indication <strong>of</strong> the type <strong>of</strong> industries in<br />
the area and the rates <strong>of</strong> growth for each.<br />
KEY ECONOMIC INDICATORS MAY <strong>2011</strong> – ECONOMIC DEVELOPMENT – CITY OF GREATER GEELONG
Consumer Sentiment Index – <strong>May</strong> <strong>2011</strong><br />
The Westpac-Melbourne Institute Index <strong>of</strong> Consumer Sentiment fell 1.3% in <strong>May</strong> from 105.3<br />
in April to 103.9 in <strong>May</strong>.<br />
(An Index over 100 indicates that optimists outweigh pessimists)<br />
Westpac chief economist Bill Evans said “the survey was conducted after the release <strong>of</strong> the<br />
government's 2010-11 budget and the Reserve Bank <strong>of</strong> Australia's 25 basis point rate hike at<br />
the start <strong>of</strong> the month.<br />
The survey found 27 per cent <strong>of</strong> consumers thought the budget would adversely affect their<br />
finances, with just 11 per cent saying there would be some improvement,” Mr Evans said.<br />
Source: Westpac Banking Corporation – Westpac Melbourne Institute Consumer Sentiment<br />
Index.<br />
Business Confidence – April <strong>2011</strong><br />
Business confidence eased in April to +7 points, a drop <strong>of</strong> 2 points compared to March <strong>2011</strong><br />
(+9).<br />
(An Index above zero indicates that optimists outweigh pessimists)<br />
Confidence fell significantly in manufacturing and mining (consistent with declines in<br />
conditions), but strengthened in transport & utilities and construction. Confidence was<br />
strongest in finance/business/property (+19) and transport & utilities (+16), while<br />
manufacturing was the only sector to report negative confidence levels (-5).<br />
Source: National Australia Bank <strong>Monthly</strong> Survey and <strong>Economic</strong> Outlook.<br />
KEY ECONOMIC INDICATORS MAY <strong>2011</strong> – ECONOMIC DEVELOPMENT – CITY OF GREATER GEELONG
The information presented in this publication is given in good faith<br />
and has been derived from sources believed to be reliable and<br />
accurate. However, neither the <strong>City</strong> <strong>of</strong> <strong>Greater</strong> <strong>Geelong</strong> nor any<br />
persons involved in the preparation <strong>of</strong> this publication accept any<br />
form <strong>of</strong> liability whatsoever for its contents, including opinions,<br />
advice, information or any consequences arising from its use.<br />
WWW.GEELONGAUSTRALIA.COM.AU<br />
Prepared By:<br />
ECONOMIC DEVELOPMENT - CITY OF GREATER GEELONG<br />
2ND FLOOR, 131 MYERS STREET PO BOX 104 GEELONG 3220<br />
AUSTRALIA<br />
TELEPHONE +61 3 5272 4888 FACSIMILE +61 3 5272 4855<br />
EMAIL: ecoinfo@geelongcity.vic.gov.au