The Nalunaq gold prospect, South Greenland: test mining ... - GEUS
The Nalunaq gold prospect, South Greenland: test mining ... - GEUS
The Nalunaq gold prospect, South Greenland: test mining ... - GEUS

You also want an ePaper? Increase the reach of your titles
YUMPU automatically turns print PDFs into web optimized ePapers that Google loves.
<strong>The</strong> <strong>Nalunaq</strong> <strong>gold</strong> <strong>prospect</strong>, <strong>South</strong> <strong>Greenland</strong>:<br />
<strong>test</strong> <strong>mining</strong> for feasibility studies<br />
Mogens Lind, Lotte Kludt and Brian Ballou<br />
<strong>The</strong> <strong>Nalunaq</strong> narrow-vein <strong>gold</strong> <strong>prospect</strong> is situated 40<br />
km north-east of Nanortalik, the southernmost town in<br />
<strong>Greenland</strong>, 6 km inland from the fjord Saqqaa (Fig. 1).<br />
<strong>The</strong> exploration licence is held by <strong>Nalunaq</strong> I/S, a company<br />
jointly owned by Crew Development Corporation,<br />
Canada (67%) and NunaMinerals A/S, <strong>Greenland</strong> (33%).<br />
A pre-feasibility study of March 1999 by an independent<br />
<strong>mining</strong> consulting company commented positively<br />
on the <strong>Nalunaq</strong> <strong>prospect</strong> (<strong>Nalunaq</strong> I/S, personal<br />
communication 1999). However, assessment of the sample<br />
database demonstrated considerable variation in<br />
grade estimates depending on the use of drillcores,<br />
chip or saw-cut samples as well as the capping levels<br />
(reducing the highest assay values to a fixed value). To<br />
advance this project to the feasibility level, the pre-feasibility<br />
study stressed the need for improved grade verification<br />
and demonstration of grade continuity.<br />
In preparation for a feasibility study, a Can$ 9 million<br />
underground <strong>test</strong> <strong>mining</strong> and bulk sampling programme<br />
was executed during the summer 2000 field<br />
season. Strathcona Mineral Services Limited (Canada)<br />
designed the programme in conjunction with <strong>Nalunaq</strong><br />
personnel. This report focuses on the field aspects of<br />
the programme; processing of field and laboratory data<br />
is still in progress (January 2001).<br />
Nanortalik<br />
10 km<br />
Sermersooq<br />
45°<br />
S<br />
<strong>Nalunaq</strong><br />
Canada<br />
Inland<br />
Ice<br />
60°30'<br />
<strong>Greenland</strong><br />
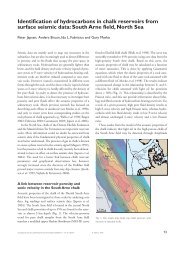
Fig. 1. Map of the Nanortalik region showing the location of the<br />
<strong>Nalunaq</strong> <strong>prospect</strong>. <strong>The</strong> framed area is the exploration licence outline.<br />
S: Saqqaa; T: Tasermiut.<br />
T<br />
Geological setting and previous<br />
investigations<br />
<strong>The</strong> <strong>Nalunaq</strong> <strong>gold</strong> <strong>prospect</strong> (see Kaltoft et al. 2000 and<br />
references therein) is hosted by a Palaeoproterozoic<br />
sequence of mafic metavolcanics and dolerite sills metamorphosed<br />
under amphibolite facies conditions. <strong>The</strong><br />
mineralisation is located in a shear zone, and consists<br />
of a system of quartz veins associated with calc-silicate<br />
alteration referred to as the ‘Main Vein’ (MV; Fig. 2). Gold<br />
occurs mainly in native form with grain size ranging from<br />
1 micron to 4 mm (Fig. 3). <strong>The</strong> mineralised zone has a<br />
strike of c. 50° and dips at 25°–55° to the south-east.<br />
Two major dextral faults divide the MV into the ‘<strong>South</strong>ern<br />
Block’, ‘Target Block’ and ‘Upper Block’ (Fig. 2). Since<br />
1992 the MV has been mapped and sampled for a distance<br />
of c. 2000 m on surface outcrops. Diamond drilling,<br />
totalling 11 452 m of core from 78 holes, has focused<br />
on the ‘Target Block’ and adjacent parts of the ‘Upper<br />
Block’ and ‘<strong>South</strong>ern Block’. In 1998 a 288 m exploration<br />
adit at level 400 m above sea level was excavated<br />
in the MV for 205 m along strike within the ‘Target<br />
Block’. In addition, two upwards-directed shafts (raises)<br />
totalling 39 m were excavated in the MV up-dip direction.<br />
Significant grade variations on a metre scale were<br />
70<br />
Geology of <strong>Greenland</strong> Survey Bulletin 189, 70–75 (2001) © <strong>GEUS</strong>, 2001
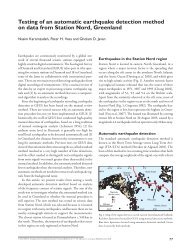
Fig. 2. <strong>The</strong> east face of <strong>Nalunaq</strong> mountain.<br />
<strong>The</strong> <strong>gold</strong>-bearing ‘Main Vein’ (MV)<br />
is traced in yellow (not to scale). Full<br />
yellow line indicates outcropping MV<br />
while the dashed yellow line indicates<br />
continuation of the MV trace below the<br />
talus as interpreted from core drilling.<br />
Two dextral faults (dashed white lines)<br />
divide the MV into the ‘<strong>South</strong>ern Block’,<br />
‘Target Block’ and ‘Upper Block’. <strong>The</strong><br />
winding road provides access to the adit<br />
portals at levels 350 m, 400 m and 450<br />
m. Mountain summit is c. 1100 m above<br />
the <strong>mining</strong> camp on the valley floor.<br />
Photo: Hans Christian Langager.<br />
Level 350<br />
Level 450<br />
Target<br />
Block<br />
Upper<br />
Block<br />
Level 400<br />
<strong>South</strong>ern<br />
Block<br />
Fig. 3. Visible <strong>gold</strong> in a sample from the<br />
‘Main Vein’ surface exposure between<br />
the portal at level 450 m and the<br />
snowdrift seen on Fig. 2. Grains, such as<br />
that on the left side of the photograph,<br />
are important contributors to the value of<br />
the deposit. Sample GGU 445683. Photo:<br />
Jakob Lautrup.<br />
3 mm<br />
71
documented by chip and saw-cut channel sampling.<br />
Grades as high as 5240 g/t over 0.8 m were recorded<br />
from a saw-cut sample. At the current stage of exploration,<br />
indicated plus inferred <strong>gold</strong> resources of 425 000<br />
troy ounces (~ 13.2 tonnes) with an average grade of<br />
32 g/t are estimated. Taking into account a proposed<br />
<strong>mining</strong> method comparable to that used at a similar<br />
deposit, and including the losses due to extraction and<br />
dilution, the pre-feasibility study estimated a mill-feed<br />
grade of 27 g/t.<br />
A geological exploration target of about 1.8 million<br />
ounces of <strong>gold</strong> (~ 56 t) is currently envisaged from the<br />
mineralised structure. This figure includes the indicated<br />
and inferred <strong>gold</strong> resources, plus an order-of-magnitude<br />
estimate based on geological modelling.<br />
Programme objective<br />
<strong>The</strong> prime focus of the summer 2000 programme was<br />
to investigate a section of the existing mineralised area<br />
in order to establish resources that would meet bankfinancing<br />
requirements. <strong>The</strong> target amount of resources<br />
was based on the capital and operating costs detailed<br />
in the pre-feasibility study that would support a 500<br />
tonnes-per-day (tpd) operation. Furthermore, the project<br />
needed to establish a strike length of at least 400 m<br />
in order to obtain the 500-tpd scenario of the pre-feasibility<br />
study.<br />
To <strong>test</strong> the continuity of mineable <strong>gold</strong> grade (approximately<br />
25 g/t over the <strong>mining</strong> width including waste<br />
dilution) the MV was exposed through the excavation<br />
of adits at three levels and construction of raises in the<br />
MV up-dip direction. This was combined with a rigorous<br />
scheme for geological mapping and sampling. <strong>The</strong><br />
adit/raise design was set up to outline 80 × 80 m blocks<br />
within the MV plane (Fig. 4). <strong>The</strong> blocks were exposed<br />
and sampled on three or four sides, depending on their<br />
position in relation to the underground workings and<br />
the surface outcrops. Most blocks also included drillhole<br />
intersections. <strong>The</strong> adits were advanced to expose<br />
the vein for a strike length of 400 m.<br />
Grade verification was approached by extensive bulk<br />
sampling. This is a recommended industry practice for<br />
<strong>gold</strong> deposits with a significant nugget effect (John &<br />
Thalenhorst 1991). Each bulk sample was processed separately<br />
through a crushing/screening/sampling plant<br />
situated on the valley floor (see Fig. 6). To address the<br />
well-known problem of obtaining representative samples<br />
from broken ore, this part of the programme was<br />
based on sampling theory as formulated by Gy (1982)<br />
and extended by François-Bongarçon (1998). <strong>The</strong> purpose<br />
was to minimise the ‘Fundamental Sampling Error’<br />
(FSE) occurring at each sample reduction step. To obtain<br />
calibration data for designing the sampling programme,<br />
Lakefield Research Limited (Canada) conducted benchscale<br />
metallurgical <strong>test</strong>s on a number of existing MV samples.<br />
<strong>The</strong> overall FSE for an expected 20 000 t of <strong>Nalunaq</strong><br />
bulk sample material at an average <strong>gold</strong> grade of 25<br />
g/t was calculated to ± 2.5% (equivalent to ± 0.6 g/t).<br />
It should be noted that the 23 000 t actually mined to<br />
achieve the programme objective constitutes about 5%<br />
of the indicated plus inferred resources.<br />
Underground work<br />
Underground development totalled c. 1900 m of adits<br />
and raises (Fig. 4). <strong>The</strong> 1998 adit at the 400 m level was<br />
extended to a length of 400 m and two new adits were<br />
excavated at the 350 m and 450 m levels to lengths of<br />
c. 400 m each. In addition 13 raises were driven in the<br />
MV plane up-dip to lengths of up to 80 m. For practical<br />
reasons each advance of an adit heading (a ‘round’)<br />
was carried out by full-face blasting. <strong>The</strong> vein was deliberately<br />
kept in the middle of the advancing face for systematic<br />
geological sampling of both the hanging wall and<br />
foot wall structure (Fig. 5). In an actual <strong>mining</strong> operation<br />
the mineralised vein would be carried high up in<br />
the working face to allow the use of a <strong>mining</strong> technique<br />
(resuing) whereby the foot wall waste-rock of each<br />
‘round’ is blasted and removed before blasting of the MV<br />
material.<br />
A number of minor faults with dextral displacement<br />
were encountered during excavation of the adits. This<br />
necessitated offsetting the adits to the right to regain<br />
contact with the MV (the kinks on the adit outlines in<br />
Fig. 4). Some of the faults could be traced between the<br />
levels, and on occasions a raise was stopped prematurely<br />
in waste after intersecting the fault plane.<br />
A 10 × 10 m <strong>test</strong> stope was mined to obtain information<br />
which will facilitate the choice of an optimal <strong>mining</strong><br />
method of the MV between the sublevels. <strong>The</strong> aim<br />
was to <strong>test</strong> the minimum practical <strong>mining</strong> width to be<br />
achieved at conditions reflecting production <strong>mining</strong>. It<br />
would also allow observations on the rock mechanical<br />
properties of the hanging wall in particular, as this will<br />
influence the selection of stope dimensions during mine<br />
planning.<br />
<strong>The</strong> excavated material (c. 70 t) from each adit ‘round’<br />
was treated as a separate bulk sample. In contrast, four<br />
raise ‘rounds’ were combined to one bulk sample (a<br />
72
Fig. 4. Longitudinal section drawn in the<br />
plane of the ‘Main Vein’ (MV), which has<br />
a strike of 050° and is inclined at 40° to<br />
the south-east (average MV dip),<br />
showing adits and raises (r, 1998; R,<br />
2000). Black lines indicate development<br />
in waste to access the MV; red lines<br />
indicate development in ore. <strong>The</strong> red<br />
ribbed pattern in the <strong>test</strong> stope<br />
illustrates <strong>mining</strong> of the ore by segments<br />
between the two short raises. <strong>The</strong><br />
dashed lines mark the trace of minor<br />
dextral faults with metre-scale offsets.<br />
Open red circles indicate positions of<br />
drill-hole intersections with the MV.<br />
Yellow stars are MV outcrops. E is the<br />
end of the 1998 adit, and P the adit<br />
portal (visible on Fig. 2).<br />
SW<br />
Level 450 adit<br />
Level 400 adit<br />
Level 350 adit<br />
R<br />
R<br />
R<br />
E<br />
R<br />
R<br />
R<br />
R<br />
R<br />
R<br />
P<br />
r<br />
R<br />
r<br />
R<br />
‘Main Vein’<br />
outcrops<br />
P<br />
Test<br />
stope<br />
R<br />
R<br />
NE<br />
100 m<br />
P<br />
Fig. 5. Face for round 44 at level 450<br />
(face limits shown by white frame with<br />
white label at the bottom of the face).<br />
<strong>The</strong> mapping and sampling routine is<br />
described in the text. Green lines<br />
indicate limits of calc-silicate alteration<br />
(cs). Other abbreviations – fg: finegrained;<br />
FW: foot wall; HW: hanging<br />
wall; MV: ‘Main Vein’. <strong>The</strong> red lines<br />
show the positions of the channel<br />
samples – 114131: HW sample; 114132:<br />
alteration zone; 114133: MV sample<br />
(material from the three channels across<br />
the MV is combined to one sample);<br />
114134: FW sample; Q110983: ‘quick’<br />
sample (chip) for immediate analysis<br />
(obtained parallel to the centre MV<br />
sample). Bars on the ranging rod are 20<br />
cm long.<br />
weakly altered<br />
fg lava<br />
weakly altered<br />
fg lava<br />
MV<br />
cs<br />
cs<br />
114131<br />
fg lava<br />
fg lava<br />
114133<br />
cs<br />
cs<br />
FW alteration<br />
450-44<br />
114132<br />
HW alteration<br />
Q110983<br />
cs<br />
moderately altered fg lava<br />
114134<br />
MV<br />
‘raise segment’) of about the same weight as one adit<br />
‘round’. Much attention was paid to recovery of all broken<br />
rock at the adit headings and below the raises.<br />
Temporary stockpiling during haulage was on a ‘roundby-round’<br />
basis on numbered concrete pads. Each time<br />
a bulk sample was moved, the pad was thoroughly<br />
cleaned, and the recovered fines added to the sample<br />
in order not to lose <strong>gold</strong> grains liberated during blasting<br />
and haulage of the broken rock.<br />
Each face was geologically mapped and sampled. <strong>The</strong><br />
face map for ‘round’ 44 at the 450 m level is illustrated<br />
in Fig. 5. <strong>The</strong> position and outline of each face was surveyed<br />
in relation to the mine grid. ‘Main Vein’, alteration<br />
halo, shearing and other features were traced in<br />
73
High grade<br />
tower rejects<br />
Sample<br />
tower<br />
Crushing<br />
circuit<br />
Coarse rock<br />
pads<br />
Reference<br />
samples<br />
Low grade<br />
tower rejects<br />
‘Fine ore’<br />
pads<br />
Fig. 6. Crushing and sampling plant at the valley floor below the ‘<strong>Nalunaq</strong>’ mountain (c. 500 m south of the camp in Fig. 2). See text<br />
for description of sample flow. Note the front-end-loader beside the sample tower and the person near centre of photograph for scale.<br />
Photo: Hans Christian Langager.<br />
detail and the presence of visible <strong>gold</strong> noted. <strong>The</strong> layout<br />
for the saw-cut channel samples (2–4 kg) is shown<br />
on Fig. 5. Three samples were taken across the MV<br />
extending a few cm into the wall-rock to include <strong>gold</strong><br />
located at the MV/wall-rock contact. <strong>The</strong> material from<br />
the three MV samples was combined to one sample.<br />
Depending on the width of the alteration zone, this<br />
phase was sometimes sampled independently in continuation<br />
of one of the MV samples. Samples were also<br />
obtained from the hanging wall (HW) and the foot wall<br />
(FW). A supplementary chip sample was taken parallel<br />
to the centre MV sample for immediate analysis.<br />
Raises were chip-sampled only, due to practical considerations.<br />
All map and sample information was digitised<br />
and saved together with a digital photograph of<br />
the face as individual layers in MapInfo (Geographical<br />
Information System). <strong>The</strong> area of the map units (MV,<br />
alteration zone, HW and FW) was determined for each<br />
face as part of the digital processing.<br />
All the face samples were analysed by XRAL Laboratories<br />
(Canada) by the Screen Fire Assay method.<br />
When assay data become available, the corresponding<br />
sample grade will be assigned to each of the geological<br />
map units together with a specific gravity from the<br />
calibration <strong>test</strong>s on <strong>Nalunaq</strong> reference samples by Lakefield<br />
Research Limited. <strong>The</strong> grade of each face will then<br />
be estimated by weighting grades by area and specific<br />
gravity. <strong>The</strong> estimated grade of a ‘round’ is the average<br />
of the two enclosing faces and will be compared to the<br />
grade of the corresponding bulk sample.<br />
Bulk sample processing<br />
<strong>The</strong> crushing and sampling plant is shown in Fig. 6. A<br />
total of 388 bulk samples were processed. A front-end<br />
loader feeds coarse blasted rock from one of the pads<br />
to a two-stage crushing circuit for reduction to less than<br />
20 mm (‘fine ore’). This material is hauled to one of the<br />
‘fine ore’ bins.<br />
‘Fine ore’ is fed to the top of the sample tower (Fig.<br />
6) by a conveyor belt. On its way down the tower the<br />
‘fine ore’ is passed through three consecutive sample<br />
splitters. A roll crusher is positioned between the second<br />
and third splitter for further reduction of the sampled<br />
‘fine ore’ to less than 6 mm. <strong>The</strong> sample material<br />
from the third splitter is manually fed through a riffle<br />
splitter, until the field sample of c. 35 kg is obtained.<br />
This is equivalent to 0.05% of the 70 t tower feed from<br />
a typical adit ‘round’ or ‘raise segment’.<br />
<strong>The</strong> rejects from the two first splitters are discharged<br />
to a pile beside the tower. Rejects from the two last splitters<br />
are collected in a numbered tote bag. After weighing<br />
(0.8–1 t) the tote bag is stored as reference material.<br />
74
<strong>The</strong> tower rejects were hauled to either the ‘high grade’<br />
or ‘low grade’ rejects pile (Fig. 6). This distinction is based<br />
on the geological face mapping, where observations of<br />
visible <strong>gold</strong> in the corresponding face automatically<br />
classify a bulk sample as ‘high grade’.<br />
<strong>The</strong> field samples were shipped to Lakefield Research<br />
Limited for laboratory treatment. At the laboratory, <strong>gold</strong><br />
was determined by the Screen Fire Assay method following<br />
several stages of screening/crushing/splitting.<br />
Implications for <strong>mining</strong><br />
With respect to adding tonnage to the resource, the<br />
400 m and 450 m levels are encouraging, as they were<br />
both advanced beyond the innermost drill section, and<br />
thus <strong>test</strong>ed new ground (Fig. 4). Grade data are not yet<br />
available, but repeated observations of visible <strong>gold</strong> are<br />
a positive indicator.<br />
<strong>The</strong> bulk sampling results from the adits and raises<br />
cannot be taken as a direct prediction of a production<br />
mill-feed grade, because the full-face advance would<br />
include a substantial amount of waste, compared to<br />
the resuing method to be applied during production <strong>mining</strong>.<br />
However, the grade of the bulk sample can be calculated<br />
over the width of the MV due to the detailed<br />
measurements of face size and MV size during the<br />
development. <strong>The</strong> bulk sampling results will provide a<br />
reliable estimate of the amount of <strong>gold</strong> contained in the<br />
excavated material. As this information is available on<br />
a ‘round-by-round’ basis, these numbers can be used<br />
both to <strong>test</strong> the continuity of <strong>gold</strong> mineralisation and<br />
to outline patterns in <strong>gold</strong> distribution in strike and dip<br />
directions. <strong>The</strong>se figures can be compared to the calculated<br />
grades from the face samples, to ascertain how<br />
channel/chip sampling can be used to predict grades.<br />
This will also allow selection of capping levels based<br />
on the specific conditions of the deposit, rather than<br />
using standard statistical techniques.<br />
<strong>The</strong> geological mapping programme provides information<br />
for detailed mine planning. <strong>The</strong> pre-feasibility<br />
study suggested <strong>mining</strong> by development of sublevels<br />
using the resuing technique. Extraction of the blocks<br />
between the sublevels would then be undertaken by<br />
long-hole stoping. A detailed control on fault geometry<br />
will be essential for stope layout. <strong>The</strong> acute angle<br />
of intersection observed between some of the faults<br />
and the MV (Fig. 4) indicates that a fault may influence<br />
a substantial part of a stope block, and this will have<br />
to be taken into account during stope design. <strong>The</strong> work<br />
in 2000 also demonstrated that much of the waste development<br />
required to access the vein for <strong>mining</strong> in the<br />
‘Target Block’, as proposed in the pre-feasibility study,<br />
will not be required as the mineralised material can be<br />
brought to the surface and taken down to the process<br />
plant. Furthermore, observations from the raises showed<br />
the vein to be much straighter than anticipated between<br />
the levels, which should allow for longer dimensions<br />
between the sublevels thereby reducing the required<br />
access development.<br />
If a mine is established, then the existing adits can<br />
be incorporated as sublevels in the mine. Furthermore,<br />
the 23 000 t of tower rejects will constitute a measured<br />
resource.<br />
Acknowledgements<br />
We thank <strong>Nalunaq</strong> I/S for generous permission to use unpublished<br />
exploration information. M.L. wishes to thank <strong>Nalunaq</strong> I/S<br />
and the Bureau of Minerals and Petroleum, Government of<br />
<strong>Greenland</strong>, for the invitation to visit the project site, and Henrik<br />
Thalenhorst, Strathcona Mineral Services Limited, Canada, for his<br />
thorough introduction to bulk sampling practice.<br />
References<br />
François-Bongarçon, D. 1998: Extensions to the demonstration<br />
of Gy’s formula. Exploration and Mining Geology 7(1–2),<br />
149–154.<br />
Gy, P.M. 1982: Sampling of particulate materials, theory and practice,<br />
431 pp. Amsterdam: Elsevier.<br />
John, M. & Thalenhorst, H. 1991: Don’t lose your shirt, take a<br />
bulk sample. In: Lawton, S.E. (ed.): Sampling and ore reserves,<br />
11–22. Toronto: Prospectors and Developers Association of<br />
Canada.<br />
Kaltoft, K., Schlatter, D.M. & Kludt, L. 2000: Geology and genesis<br />
of <strong>Nalunaq</strong> Palaeoproterozoic shear zone-hosted <strong>gold</strong><br />
deposit, <strong>South</strong> <strong>Greenland</strong>. In: Stendal, H. (compiler):<br />
Exploration in <strong>Greenland</strong>: discoveries of the 1990s. Transactions<br />
of the Institution of Mining and Metallurgy, section B, Applied<br />
earth science 109(January–April), B23–33.<br />
Authors’ addresses<br />
M.L., Geological Survey of Denmark and <strong>Greenland</strong>, Thoravej 8, DK-2400 Copenhagen NV, Denmark. E-mail: mli@geus.dk<br />
L.K.* & B.B., Crew Development Corporation, O.H. Bangsvei 54–58, N-1363 Høvik, Norway. * Present address: Mærsk Olie & Gas A/S,<br />
Esplanaden 50, DK-1263 Copenhagen K, Denmark.<br />
75