Technical Paper by SR Boyle, M. Gallagher and - IGS - International ...
Technical Paper by SR Boyle, M. Gallagher and - IGS - International ...
Technical Paper by SR Boyle, M. Gallagher and - IGS - International ...

You also want an ePaper? Increase the reach of your titles
YUMPU automatically turns print PDFs into web optimized ePapers that Google loves.
<strong>Technical</strong> <strong>Paper</strong> <strong>by</strong> S.R. <strong>Boyle</strong>, M. <strong>Gallagher</strong> <strong>and</strong><br />
R.D. Holtz<br />
INFLUENCE OF STRAIN RATE, SPECIMEN<br />
LENGTH AND CONFINEMENT ON MEASURED<br />
GEOTEXTILE PROPERTIES<br />
ABSTRACT: In-isolation <strong>and</strong> in-soil tests were performed on four woven <strong>and</strong> two<br />
nonwoven geotextiles to investigate the effect of strain rate, specimen length, <strong>and</strong> confinement<br />
in soil on the measured strength characteristics. It was determined that woven<br />
geotextiles are affected <strong>by</strong> strain rate but not <strong>by</strong> confinement. Nonwoven geotextiles<br />
were found to be influenced <strong>by</strong> both confinement <strong>and</strong> specimen gauge length. It was<br />
concluded that different manufacturing techniques influence measured strength properties,<br />
<strong>and</strong> a st<strong>and</strong>ardized wide-width strip tensile test, such as ASTM D 4595, may not<br />
be an appropriate method for all types of geosynthetic reinforcement products.<br />
KEYWORDS: Geotextile, Testing, Wide-Width strip tensile test.<br />
AUTHORS: S.R. <strong>Boyle</strong>, Norwegian Geotechnical Institute, P.O. Box 3930 Ullevaal,<br />
Hage<strong>by</strong>, N-0806 Oslo, Norway, Telephone: 47/22-02-30-17, Telefax: 47/22-23-04-48,<br />
M. <strong>Gallagher</strong>, 2413 Morse Ave., Sacramento, California 95825 USA, Telephone:<br />
1/916-972-1457, <strong>and</strong> R.D. Holtz, Professor of Civil Engineering, University of<br />
Washington, Box 352700, Seattle, Washington 98195-2700, USA, Telephone:<br />
1/206-543-7614, Telefax: 1/206-685-3836.<br />
PUBLICATION: Geosynthetics <strong>International</strong> is published <strong>by</strong> the Industrial Fabrics<br />
Association <strong>International</strong>, 345 Cedar St., Suite 800, St. Paul, Minnesota 55101, USA,<br />
Telephone: 1/612-222-2508, Telefax: 1/612-222-8215. Geosynthetics <strong>International</strong> is<br />
registered under ISSN 1072-6349.<br />
DATES: Original manuscript received 26 October 1995, revised version received 4<br />
April 1996 <strong>and</strong> accepted 5 April 1996. Discussion open until 1 November 1996.<br />
REFERENCE: <strong>Boyle</strong>, S.R., <strong>Gallagher</strong>, M. <strong>and</strong> Holtz, R.D., 1996, “Influence of<br />
Strain Rate, Specimen Length <strong>and</strong> Confinement on Measured Geotextile Properties”,<br />
Geosynthetics <strong>International</strong>, Vol. 3, No. 2, pp. 205-225.<br />
GEOSYNTHETICS INTERNATIONAL S 1996, VOL. 3, NO. 2<br />
205
BOYLE et al. D Influence of Strain Rate, Length <strong>and</strong> Confinement on Geotextiles<br />
1 INTRODUCTION<br />
As part of an ongoing research project on the deformation prediction of geosynthetic<br />
reinforced soil (GRS) retaining walls, the in-isolation <strong>and</strong> in-soil strength properties of<br />
geotextiles were investigated. The study included an investigation of the effects of<br />
strain rate on woven geotextiles <strong>and</strong> specimen length on nonwoven geotextiles using<br />
in-isolation tests. In-soil tests were also performed to determine the effect of confinement<br />
on these same geotextiles. The appropriateness of the st<strong>and</strong>ard wide-width strip<br />
tensile test, ASTM D 4595, for characterization of the engineering properties of these<br />
geotextiles is also discussed.<br />
Preliminary results of this research have been reported <strong>by</strong> <strong>Boyle</strong> <strong>and</strong> Holtz (1994) <strong>and</strong><br />
<strong>Boyle</strong> (1995b). Details of the in-isolation <strong>and</strong> in-soil testing programs are presented <strong>by</strong><br />
<strong>Gallagher</strong> (1995) <strong>and</strong> <strong>Boyle</strong> (1995a), respectively.<br />
2 IN-ISOLATION TESTS<br />
2.1 Introduction<br />
The ASTM D 4595 st<strong>and</strong>ard test, is widely used to obtain the ultimate strength <strong>and</strong><br />
stiffness of geosynthetic reinforcement products. In this test, a 100 mm long <strong>by</strong> 200 mm<br />
wide specimen is loaded to failure in tension at a strain rate of 10%/minute. Initially,<br />
a limited number of ASTM D 4595 st<strong>and</strong>ard tests were to be performed on the geotextiles<br />
in the program for comparison with in-soil test results. However, early in the in-soil<br />
testing program it was discovered that the response of the woven geotextiles was very<br />
sensitive to strain rate, more so than anticipated after performing a literature review<br />
(Rowe <strong>and</strong> Ho 1986; Wang et al. 1990). Additionally, the operational mode of the in-soil<br />
testing device (described in Section 3) caused the normal stress acting on the nonwoven<br />
geotextiles to increase during tests, thus making correlation with in-isolation tests difficult.<br />
Consequently, to characterize the geotextiles in more detail the in-isolation testing<br />
program was exp<strong>and</strong>ed to include:<br />
S a series of ASTM D 4595 tests on woven geotextile specimens, conducted at strain<br />
rates from 0.01 to 10%/minute, to study the strain rate effect; <strong>and</strong><br />
S a series of ASTM D 4595 tests on nonwoven geotextile specimens, with gauge lengths<br />
ranging from 25 to 115 mm, to determine if an in-isolation zero gauge length test<br />
would be appropriate for predicting confined, in-soil stiffness values.<br />
2.2 Geotextiles<br />
The geotextiles used for the in-isolation ASTM D 4595 tests included: three polypropylene<br />
woven slit-film geotextiles, PP1, PP2 <strong>and</strong> PP3; one polyester woven multifilament<br />
geotextile, PET2; <strong>and</strong>, two polypropylene nonwoven needle-punched geotextiles,<br />
NW1 <strong>and</strong> NW2 (Table 1). Geotextiles PP2 <strong>and</strong> PP3 were manufactured <strong>by</strong><br />
stitch-bonding together two <strong>and</strong> three layers of geotextile PP1, respectively. Geotextiles<br />
PP1, PP2, PP3 <strong>and</strong> PET1 are the same materials that were used in the construction<br />
of the Rainier Avenue wall in Seattle, Washington, USA (Allen et al. 1992).<br />
206 GEOSYNTHETICS INTERNATIONAL S 1996, VOL. 3, NO. 2
BOYLE et al. D Influence of Strain Rate, Length <strong>and</strong> Confinement on Geotextiles<br />
Table 1.<br />
Geotextiles tested.<br />
Geotextile<br />
Description<br />
Mass/unit<br />
area (g/m 2 )<br />
Thickness<br />
(mm)<br />
Wide Width<br />
Strength (kN/m)<br />
(ASTM D 4595)<br />
Elongation (%) *<br />
(ASTM D 4595)<br />
PP1 Woven, slit-film - 0.4 26 15 **<br />
PP2<br />
Woven, slit-film,<br />
2 layer stitch-bonded<br />
- 0.7 49 15 **<br />
PP3<br />
Woven, slit-film,<br />
3 layer stitch-bonded<br />
- 1.4 77 15 **<br />
PET1<br />
Woven,<br />
multi-filament<br />
- - 215 10 ††<br />
PET2<br />
Woven,<br />
multi-filament<br />
- 1.8 175 10 **<br />
NW1<br />
Nonwoven, needlepunched<br />
268 2.6 16 95 †<br />
NW2<br />
Nonwoven, needlepunched<br />
532 4.3 26 95 †<br />
Notes: * Manufacturer’s published data from Industrial Fabrics Association <strong>International</strong> (1989, 1992).<br />
** Minimum average roll values. † Typical roll values. †† Average value from Allen et al. (1992). PP =<br />
polypropylene; PET = polyester; NW = nonwoven.<br />
Geotextile PP1 specimens were cut from geotextile samples exhumed from the Rainier<br />
Avenue wall site during its demolition. Tests for PP2 <strong>and</strong> PP3 geotextiles were performed<br />
using new material. Geotextile PET2 is manufactured using the same materials<br />
<strong>and</strong> procedures as geotextile PET1 which was also used in the Rainier Avenue wall project.<br />
However, PET2 specimens were used in the in-isolation tests because geotextile<br />
PET1 is no longer being manufactured <strong>and</strong> insufficient quantities had been exhumed<br />
from the Rainier Avenue wall site to permit its use for both the in-soil <strong>and</strong> in-isolation<br />
tests.<br />
Nonwoven geotextiles were included in the laboratory program because they have<br />
been effectively used in several early full scale GRS walls. If the behavior <strong>and</strong> reinforcement<br />
characteristics of nonwoven geotextiles were better quantified they would<br />
likely be used more often in GRS walls because they are less expensive than many other<br />
geosynthetics. Nonwoven geotextiles, NW1 <strong>and</strong> NW2, were selected as being representative<br />
of the lightest weight <strong>and</strong> typical weight nonwoven geotextiles, respectively, for<br />
GRS wall applications.<br />
2.3 In-Isolation Test Apparatus, Instrumentation <strong>and</strong> Specimen Preparation<br />
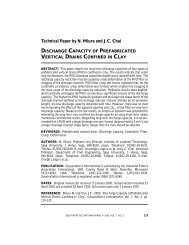
In-isolation tests were performed using an MTS testing machine which was fitted<br />
with hydraulically operated clamps. In an attempt to eliminate end effects, elongation<br />
of the geotextiles was measured using a “scissors” type of displacement device (Figure<br />
1). The scissors were attached to the geotextile specimen <strong>by</strong> puncturing the specimen<br />
with needles, which are mounted at the end of each scissor arm. The distance between<br />
the needles at the beginning of each test (approximately 60 - 75 mm for 100 mm gauge<br />
length specimens) was used as the initial gauge length for calculating strains in the woven<br />
geotextile specimens. No measurable reduction in strength resulted from insertion<br />
of the needles. The scissors gave erratic <strong>and</strong> unreliable readings <strong>and</strong> were difficult to<br />
GEOSYNTHETICS INTERNATIONAL S 1996, VOL. 3, NO. 2<br />
207
BOYLE et al. D Influence of Strain Rate, Length <strong>and</strong> Confinement on Geotextiles<br />
MTS MTSloading frame<br />
“Scissors” system is<br />
free to slide down <strong>and</strong><br />
toward clamps as the<br />
geotextile is stretched<br />
downward<br />
Strain<br />
measuring<br />
device<br />
Pully<br />
LVDT<br />
Counterweight<br />
Load cell<br />
Swivel<br />
Clamp<br />
Needles at the end of scissor<br />
arms which attach to geotextile<br />
Geotextile specimen<br />
Clamp<br />
Piston<br />
Direction of piston motion<br />
Instrument st<strong>and</strong><br />
MTS loading frame<br />
Figure 1.<br />
In-isolation test setup <strong>and</strong> the “scissors” system used to measure displacement.<br />
use on specimen gauge lengths less than 75 mm. Hence, strains in NW1 <strong>and</strong> NW2 specimens<br />
were computed using cross-head displacement data.<br />
Polypropylene woven geotextile specimens were 200 mm wide <strong>by</strong> 200 mm long. The<br />
50 mm lengths on each end of the specimen used to clamp the specimen was reinforced<br />
with an epoxy resin to prevent damage <strong>by</strong> the clamps. This resulted in a test specimen<br />
200 mm wide with a 100 mm gauge length between the clamps as required <strong>by</strong> ASTM<br />
D 4595.<br />
Testing of the PET2 specimens presented some difficulties. Full 200 mm wide specimens<br />
could support loads exceeding the structural capacity of the clamps (Table 1). Furthermore,<br />
slip between the clamps <strong>and</strong> the specimen occurred at these large loads. Thus,<br />
to reduce the maximum applied load, PET2 specimen widths were reduced. This approach<br />
was supported <strong>by</strong> the work of Leshchinsky <strong>and</strong> Fowler (1990) <strong>and</strong> Paulson<br />
(1993) who reported that specimen widths could be reduced with no effect on the measured<br />
wide-width strip tensile properties for geotextiles of the type tested in the current<br />
study; i.e. geotextiles with little interaction between the structural filaments oriented<br />
in the direction of loading <strong>and</strong> the cross-weave fibers. With the exception of two 50 mm<br />
wide specimens, PET2 specimens were 100 mm wide. No differences in strength or<br />
stiffness, per unit width of the geotextile specimens, was observed for the different<br />
width PET2 specimens. Since the polyester filaments were easily damaged, both ends<br />
of the PET2 specimens were impregnated with an epoxy resin, <strong>and</strong> a 0.3 mm thick sheet<br />
of stainless steel was glued on the outside of the epoxy for additional protection from<br />
the clamp teeth. The PET2 specimen gauge length between the clamps was 100 mm.<br />
208 GEOSYNTHETICS INTERNATIONAL S 1996, VOL. 3, NO. 2
BOYLE et al. D Influence of Strain Rate, Length <strong>and</strong> Confinement on Geotextiles<br />
Table 2.<br />
Number of tests <strong>and</strong> loading condition for woven geotextiles.<br />
Constant strain rate (%/minute)<br />
Geotextile 10.0 1.0 0.1 0.01<br />
Number of tests<br />
Constant load<br />
(creep test)<br />
PP1 7 3 6 6 0<br />
PP2 10 5 4 7 2<br />
PP3 11 5 4 8 2<br />
PET2 10 2 2 5 3<br />
All NW1 <strong>and</strong> NW2 specimens had widths of 200 mm, <strong>and</strong> since these are lower<br />
strength materials, it was not necessary to apply epoxy to the ends. However, to prevent<br />
filament damage from clamp slippage the clamp faces were roughened.<br />
2.4 Constant Strain Rate Tests<br />
The effect of strain rate on the strength properties of the four woven geotextile specimens,<br />
PP1, PP2, PP3 <strong>and</strong> PET2, was investigated using a series of wide-width tests conducted<br />
at strain rates of 10, 1, 0.1 <strong>and</strong> 0.01%/minute (Table 2). The stiffness <strong>and</strong> strength<br />
values of PP1, PP2 <strong>and</strong> PP3 specimens were found to be very sensitive to strain rate <strong>and</strong><br />
followed the same general pattern that was reported <strong>by</strong> Yeo (1985): i.e. a decrease in<br />
strength <strong>and</strong> stiffness values was observed with decreasing strain rate (Figure 2). The<br />
PET2 specimens were not as sensitive to strain rate as were PP1, PP2 <strong>and</strong> PP3 specimens,<br />
<strong>and</strong> occasionally it was difficult to distinguish between tests conducted at different<br />
strain rates. The 5% secant stiffness values (secant stiffness value determined at 5%<br />
strain) decreased <strong>by</strong> approximately 50% for PP1, PP2 <strong>and</strong> PP3 specimens when the<br />
Tensile load (kN/m)<br />
100<br />
80<br />
60<br />
40<br />
Strain rate (%/minute)<br />
10<br />
1<br />
0.01<br />
0.1<br />
20<br />
Figure 2.<br />
0<br />
0 5 10 15 20 25<br />
Strain (%)<br />
Tensile load versus strain for PP3 geotextile specimens.<br />
GEOSYNTHETICS INTERNATIONAL S 1996, VOL. 3, NO. 2<br />
209
BOYLE et al. D Influence of Strain Rate, Length <strong>and</strong> Confinement on Geotextiles<br />
strain rate was decreased from 10 to 0.01%/minute, whereas the 5% secant stiffness values<br />
for PET2 specimens decreased <strong>by</strong> only 15 to 20% for the same decrease in strain<br />
rate (Figure 3).<br />
In this study the average strength values <strong>and</strong> the average corresponding strain values<br />
for the woven geotextile specimens were less than those reported <strong>by</strong> Allen et al. (1992)<br />
(Table 3). In fact, the strength values were closer to the minimum average roll values<br />
(Koerner 1994 pp. 91-93) reported <strong>by</strong> the manufacturers (Industrial Fabrics Association<br />
<strong>International</strong> 1989, 1992; Table 1), while the corresponding strain values were less<br />
(with the exception of PET2 specimens). Strengths below those previously reported<br />
may be partially attributed to difficulties in clamping the geotextile specimens in a manner<br />
which did not damage them. However, the epoxy specimen end protection may not<br />
have been sufficient as the specimens typically failed near the clamps. Even though different<br />
types of specimen protection <strong>and</strong> clamps with smaller teeth were tried, the method<br />
used appeared to be the best. The application of the epoxy may itself have influenced<br />
the failure mode of the specimens <strong>by</strong> causing a stress concentration at the transition<br />
point from the epoxy coated geotextile specimen to the uncoated geotextile specimen.<br />
A better means of clamping, especially for high strength geotextiles, is required <strong>and</strong><br />
comparison with tests performed using roller clamps is suggested.<br />
1.2<br />
Figure 3.<br />
5% secant stiffness / D 4595 5% secant stiffness<br />
1.0<br />
0.8<br />
0.6<br />
0.4<br />
PP2<br />
Polyester<br />
PET2<br />
PP3<br />
PP1<br />
Polypropylene<br />
Reinforcement<br />
0.2<br />
PP1<br />
PP2<br />
PP3<br />
PET2<br />
0.0<br />
0.001 0.010 0.10 1.0 10.0 100.0<br />
Strain rate (%/minute)<br />
Normalized 5% secant stiffness versus strain rate for woven geotextiles.<br />
210 GEOSYNTHETICS INTERNATIONAL S 1996, VOL. 3, NO. 2
BOYLE et al. D Influence of Strain Rate, Length <strong>and</strong> Confinement on Geotextiles<br />
Table 3. Comparison of wide-width strip tensile test results (ASTM D 4595) performed <strong>by</strong><br />
<strong>Gallagher</strong> (1995) with those reported <strong>by</strong> Allen et al. (1992) for the woven geotextiles.<br />
Geotextile<br />
Strength<br />
(kN/m)<br />
<strong>Gallagher</strong> (1995) Allen et al. (1992)<br />
Strain at<br />
failure<br />
(%)<br />
5% secant<br />
stiffness<br />
(kN/m)<br />
Strength<br />
(kN/m)<br />
Strain at<br />
failure<br />
(%)<br />
5% secant<br />
stiffness<br />
(kN/m)<br />
PP1 24.3 10.5 260 31 (21) 21 (15) 198 (181)<br />
PP2 53.3 12.7 470 62 16 453<br />
PP3 77.6 13.6 780 92 17 662<br />
PET1 NA NA NA 186 18 1068<br />
PET2 162 12.4 1000 NA NA NA<br />
Notes: Values in parentheses are test values for specimens exhumed from Rainier Avenue wall site (Allen<br />
et al. 1992). NA = not available.<br />
The differences in strain values at failure may also be attributed to failure of the geotextile<br />
specimens near the clamps. This failure zone, which corresponds to the zone of<br />
highest localized strain, was outside of the region measured <strong>by</strong> the “scissors” (Figure<br />
1). Therefore, the “scissors” did not measure overall specimen strain values at failure,<br />
but only measured the strain between the two needles. To exclude this failure zone<br />
would underestimate the overall geotextile specimen strain values at failure. Again, a<br />
better geotextile clamping method is required to ensure that the failure zone will fall<br />
within the region bounded <strong>by</strong> the strain measuring device (i.e. the scissors).<br />
Even though the strength values measured using ASTM D 4595 were less than those<br />
reported <strong>by</strong> Allen et al. (1992), the stiffness values measured for PP1, PP2 <strong>and</strong> PP3 specimens<br />
were greater (Table 3). (The stiffness values for PET2 specimens could not be<br />
used in this comparison because PET2 geotextiles were not used in the Rainier Avenue<br />
wall project <strong>and</strong> no manufacturer’s data was available.) Since the stiffness values were<br />
calculated at strain values much less than the strain values at failure, geotextile specimen<br />
clamp damage should not be the cause of greater stiffness values. The overall geotextile<br />
specimen strain should also be more accurately measured <strong>by</strong> the scissors since<br />
stress concentration effects should have less effect at the lower stress conditions<br />
associated with these strains. Therefore, the stiffness values measured in this program<br />
should be close to the stiffness values that would be obtained if clamp damage is not<br />
a factor.<br />
2.5 Variable Gauge Length Tests<br />
Wide-width strip tensile tests were conducted on 200 mm wide NW1 <strong>and</strong> NW2 specimens<br />
using gauge lengths of 25, 50, 56, 75, 100 <strong>and</strong> 115 mm (Table 4). All tests were<br />
conducted at strain rates of 10 %/minute <strong>by</strong> adjusting the loading piston displacement<br />
rate for the specimen length. These tests were performed to determine if a correlation<br />
could be established between in-isolation, <strong>and</strong> confined, in-soil stress-strain behavior.<br />
If such a relationship could be established it would simplify testing of nonwoven geotextiles<br />
<strong>by</strong> eliminating the need to perform confined tension tests (McGown et al. 1982;<br />
Wilson-Fahmy et al. 1993). These tests assumed that shorter gauge lengths would more<br />
closely approximate the plane strain conditions of confinement in soil <strong>and</strong> would<br />
GEOSYNTHETICS INTERNATIONAL S 1996, VOL. 3, NO. 2<br />
211
BOYLE et al. D Influence of Strain Rate, Length <strong>and</strong> Confinement on Geotextiles<br />
Table 4.<br />
Number of tests conducted at each gauge length on nonwoven geotextiles.<br />
Gauge length (mm)<br />
Geotextile 25 50 56 75 100 115<br />
Number of tests<br />
NW1 5 5 2 4 6 5<br />
NW2 5 4 4 4 4 3<br />
approach the near “zero” gauge length between soil particles in GRS systems (Christopher<br />
et al. 1986; Resl 1990). The assumption that zero gauge length strength <strong>and</strong><br />
stiffness values obtained from in-isolation tests might approximate those values obtained<br />
from in-soil tests was based upon:<br />
(1) the conclusion <strong>by</strong> Ling et al. (1992) that the stress-strain response of nonwoven geotextiles<br />
confined between two membranes was similar to the response when confinedinsoil;<br />
(2) the conclusion <strong>by</strong> Resl (1990) that geotextile reinforcement is effectively<br />
“clamped” <strong>by</strong> soil particles on either side of the failure (“tear”) in model GRS wall<br />
tests;<br />
(3) the observation <strong>by</strong> Christopher et al. (1986) that “zero span” tests produced results<br />
similar to the confined tests reported <strong>by</strong> McGown et al. (1992); <strong>and</strong><br />
(4) reports <strong>by</strong> Wang et al. (1990) <strong>and</strong> Resl (1990) that strength values measured from<br />
in-isolation tests on nonwoven geotextiles increased with decreasing gauge lengths.<br />
In this study, contrary to the results reported <strong>by</strong> Wang et al. (1990) <strong>and</strong> Resl (1990),<br />
the strength values of NW1 <strong>and</strong> NW2 specimens were approximately the same for all<br />
gauge lengths tested (Figure 4). Wang et al. reported an increase in strength values of<br />
25 to 33% for decreases in gauge length from 200 to 50 mm. Resl reported an increase<br />
in strength values from 65% to greater than 130% for decreases in gauge length from<br />
200 to 3 mm. One possible explanation for the difference between the writers’ results<br />
<strong>and</strong> those reported <strong>by</strong> Resl <strong>and</strong> Wang et al. is the strain rate. The strain rate for tests<br />
conducted in the current study remained constant at 10%/minute regardless of specimen<br />
gauge length. In the study <strong>by</strong> Wang et al., a constant loading piston displacement<br />
rate was maintained, not a constant strain rate. Thus, for a decrease in gauge length from<br />
200 to 50 mm the strain rate would increase <strong>by</strong> a factor of four. Although Resl does not<br />
indicate if the strain rate or loading piston displacement rate were held constant, the<br />
similarity between Resl <strong>and</strong> Wang et al. data, <strong>and</strong> the 30% increase in the strength values<br />
of woven geotextiles tested <strong>by</strong> Resl using the same procedure, suggests that Resl<br />
also held the displacement rate constant. If the polypropylene filaments in the nonwoven<br />
NW1 <strong>and</strong> NW2 specimens behave similarly to those in the woven PP1, PP2 <strong>and</strong><br />
PP3 specimens tested in this study, an increase in strength values with increasing strain<br />
rate would be expected. Thus, Wang et al. <strong>and</strong> Resl were combining variable strain rate<br />
tests with variable gauge length tests, <strong>and</strong> their results should not be used for projecting<br />
a “zero” gauge length strength. The test method chosen for this program, where<strong>by</strong> the<br />
strain rate was held constant regardless of geotextile specimen gauge length, more<br />
closely models an in-soil load-elongation test conducted at that same strain rate <strong>and</strong> is<br />
212 GEOSYNTHETICS INTERNATIONAL S 1996, VOL. 3, NO. 2
BOYLE et al. D Influence of Strain Rate, Length <strong>and</strong> Confinement on Geotextiles<br />
30<br />
25<br />
Strength (kN/m)<br />
20<br />
15<br />
10<br />
5<br />
0<br />
Gauge length (mm)<br />
Reinforcement<br />
NW1<br />
NW1, average<br />
NW2<br />
NW2, average<br />
0 25 50 75 100 125<br />
Figure 4.<br />
Strength versus gauge length for nonwoven geotextiles.<br />
the more appropriate test method for comparison of “zero” gauge length in-isolation<br />
specimen tests with in-soil specimen tests.<br />
Although no increase in NW1 <strong>and</strong> NW2 specimen strength values was recorded, the<br />
stiffness values appear to have increased with decreasing gauge length (Figure 5). The<br />
5% secant stiffness values for NW1 <strong>and</strong> NW2 specimens increased <strong>by</strong> approximately<br />
130 <strong>and</strong> 65%, respectively, when the gauge length was reduced from 115 to 25 mm.<br />
Since neither Wang et al. nor Resl reported stiffness data, no comparison with their results<br />
could be made. If the relationship between stiffness <strong>and</strong> gauge length is assumed<br />
to be linear, the extrapolated “zero” gauge length 5% secant stiffness values for NW1<br />
<strong>and</strong> NW2 specimens were approximately 200 <strong>and</strong> 160% of the stiffness values determined<br />
using the ASTM D 4595 specified gauge length of 100 mm for NW1 <strong>and</strong> NW2<br />
specimens, respectively. These increases are less than the 200 to 300% increase in stiffness<br />
values of nonwoven geotextiles with confinement in soil reported <strong>by</strong> McGown et<br />
al. (1982). Some of the difference between our extrapolated “zero” gauge length increase<br />
in stiffness values <strong>and</strong> those reported <strong>by</strong> McGown et al. (1982) may result from<br />
the assumption of a linear relationship between geotextile specimen stiffness <strong>and</strong> gauge<br />
length. The actual relationship may not be linear; however, given the scatter <strong>and</strong> limited<br />
number of data points, anything other than a linear extrapolation would be inappropriate.<br />
Further discussion on the relationship between the “zero” gauge length stiffness<br />
values <strong>and</strong> the in-soil stiffness values for NW1 <strong>and</strong> NW2 specimens is presented in Section<br />
3.<br />
There was significant scatter in NW1 <strong>and</strong> NW2 specimen test results (Figure 5). This<br />
was more pronounced for the lighter weight NW1 specimens than for the NW2 specimens,<br />
which have approximately twice the mass per unit area (Table 1). Some of the<br />
scatter of the data points can be attributed to test method variability, inaccuracies in test-<br />
GEOSYNTHETICS INTERNATIONAL S 1996, VOL. 3, NO. 2<br />
213
BOYLE et al. D Influence of Strain Rate, Length <strong>and</strong> Confinement on Geotextiles<br />
5% secant stiffness (kN/m)<br />
120<br />
100<br />
80<br />
60<br />
40<br />
NW2<br />
NW1, in-isolation<br />
20 NW1, in-soil<br />
NW2, in-isolation<br />
NW1<br />
NW2, in-soil<br />
0<br />
0 25 50 75 100 125<br />
Gauge length (mm)<br />
Figure 5. Secant stiffness versus gauge length from in-isolation tests for nonwoven<br />
geotextile specimens compared with secant stiffness values obtained from 100 mm gauge<br />
length confined tests on the same type of geotextile specimens.<br />
Note: Lines in the figure are linear regressions of in-isolation test results.<br />
ing, <strong>and</strong> the method used to measure the strain in the NW1 <strong>and</strong> NW2 specimens. However,<br />
much of the scatter seems to be due to material variability, despite the fact that<br />
both nonwoven geotextiles were produced <strong>by</strong> the same manufacturer using the same<br />
manufacturing process. Visual inspection <strong>and</strong> weighing of individual NW1 <strong>and</strong> NW2<br />
specimens revealed substantial variability in the density <strong>and</strong> distribution of fibers (Figure<br />
6), <strong>and</strong> the variation in mass per unit area had a noticeable influence on the measured<br />
geotextile specimen strength. There was significantly more variability in mass per unit<br />
area values for NW1 specimens, which also showed more variability in strength than<br />
was observed for NW2 specimens. The importance of the minimum average roll value<br />
in design is highlighted <strong>by</strong> the significant variability of mass per unit area values observed<br />
for the nonwoven geotextiles tested. This variation in geotextile properties could<br />
create difficulties if not appropriately considered when these products are specified for<br />
use in GRS walls or other applications.<br />
3 CONFINED TESTS USING THE UNIT CELL DEVICE (UCD)<br />
3.1 Introduction<br />
An investigation of fundamental GRS behavior was performed using a plane strain<br />
unit cell device (UCD) in which a geotextile reinforced soil specimen (UCD specimen),<br />
representative of an element within a GRS wall or slope, is tested (Figures 7 <strong>and</strong> 8). The<br />
214 GEOSYNTHETICS INTERNATIONAL S 1996, VOL. 3, NO. 2
BOYLE et al. D Influence of Strain Rate, Length <strong>and</strong> Confinement on Geotextiles<br />
35<br />
30<br />
Manufacturer’s<br />
reported minimum<br />
average roll value<br />
Strength (kN/m)<br />
25<br />
20<br />
15<br />
10<br />
5<br />
NW1<br />
NW2<br />
0<br />
0 100 200 300 400 500 600 700<br />
Figure 6.<br />
Mass per unit area (g/m 2 )<br />
Strength versus mass per unit area for the nonwoven geotextiles.<br />
Top bladder<br />
End bladder<br />
Left instrument box<br />
Vertical displacement LVDT<br />
Right instrument box<br />
Load cell<br />
Soil<br />
Clamp<br />
LVDT<br />
280 mm<br />
LVDT’s<br />
Soil<br />
Pivot<br />
Bearing<br />
Reinforcement<br />
Spacer<br />
Bottom bladder<br />
780 mm<br />
Vertical displacement LVDT<br />
Figure 7. Profile cross-section schematic of the unit cell device (UCD).<br />
Note: Reaction frame not shown.<br />
UCD is a load control test apparatus; as the vertical pressure, σ 1 , on the top <strong>and</strong> bottom<br />
surfaces of the UCD specimen is increased, the left instrument box is free to displace<br />
horizontally. Horizontal deformation of the soil is resisted <strong>by</strong> an applied lateral confin-<br />
GEOSYNTHETICS INTERNATIONAL S 1996, VOL. 3, NO. 2<br />
215
BOYLE et al. D Influence of Strain Rate, Length <strong>and</strong> Confinement on Geotextiles<br />
σ 1<br />
Fixed face<br />
Soil<br />
Reinforcement<br />
σ 3C<br />
Extension<br />
Soil<br />
200 mm<br />
1<br />
100 mm<br />
3<br />
2<br />
σ 1<br />
Figure 8. UCD principle of operation <strong>and</strong> specimen dimensions.<br />
Notes: σ 1 = vertical pressure; σ 3C = lateral confining pressure.<br />
ing pressure, σ 3C , <strong>and</strong> <strong>by</strong> tensile loads induced in the geotextile specimen (Figure 8).<br />
The loads in the geotextile specimen are measured directly <strong>by</strong> load cells connected to<br />
clamps which grip the geotextile specimen on both ends. Stiff end plates, to which the<br />
clamps are mechanically linked, ensure that the geotextile specimen <strong>and</strong> the soil displace<br />
equally in the lateral direction during loading <strong>and</strong> that the surfaces of the geotextile<br />
specimen remain orthogonal. Since the UCD is a load control device, which vertically<br />
loads the UCD specimen, neither the vertical nor horizontal (geotextile specimen)<br />
strain rate could be controlled. The lateral confining pressure applied to the UCD specimen<br />
was maintained constant for each test, <strong>and</strong> for any given test it was between 10 <strong>and</strong><br />
100 kPa. A graded Ottawa s<strong>and</strong> (Soil O) <strong>and</strong> a local glacial outwash s<strong>and</strong> (Soil R) were<br />
used in the test program (Table 5).<br />
Table 5.<br />
Soil properties.<br />
Soil<br />
D 60<br />
(mm)<br />
C u C c<br />
Specific<br />
gravity<br />
Minimum<br />
void ratio<br />
Maximum<br />
void Ratio<br />
Ô ps<br />
*<br />
Soil O 0.28 1.6 1.0 2.65 0.51 0.75 42<br />
Soil R 0.61 4.1 1.0 2.73 0.46 0.76 55<br />
Notes: * Ô ps = plane strain angle of internal friction; C u = coefficient of uniformity = D 60 /D 10 ;C c = coefficient<br />
of curvature = D 2 /(D 10×D 60 ); <strong>and</strong> D 10 , D 30 <strong>and</strong> D 60 = theparticle sizesuch that10, 30<strong>and</strong> 60%,respectively,<br />
30<br />
of the particles are smaller than that size; Soil O = Ottawa s<strong>and</strong>; <strong>and</strong> Soil R = local glacial outwash s<strong>and</strong>.<br />
Prior to placing specimens in the UCD, the interior was lubricated with a silicon<br />
grease <strong>and</strong> lined with a 0.3 mm latex membrane. Unit cell device specimens were<br />
216 GEOSYNTHETICS INTERNATIONAL S 1996, VOL. 3, NO. 2
BOYLE et al. D Influence of Strain Rate, Length <strong>and</strong> Confinement on Geotextiles<br />
constructed <strong>by</strong> placing two approximately equal weight layers of soil below the geotextile<br />
specimen, installing the geotextile specimen, <strong>and</strong> placing two more equal weight<br />
soil layers above the geotextile specimen. Since the soil used in GRS walls are generally<br />
compacted, Soils O <strong>and</strong> R were compacted in the UCD to relative densities of 96 <strong>and</strong><br />
101%, respectively (relative density was determined in accordance with ASTM D<br />
4253). Each soil layer was compacted <strong>by</strong> 25 blows of a 2.27 kg mass dropped from a<br />
height of 300 mm. All UCD specimens were constructed with dry soils.<br />
Before loading, each UCD specimen was nonhydrostatically consolidated <strong>by</strong> applying<br />
a vertical pressure, σ 1 , which was equal to the lateral confining pressure, σ 3C , that<br />
was applied to the UCD specimen during the test. The lateral confining pressures, σ 2<br />
<strong>and</strong> σ 3C , could not be controlled during consolidation <strong>and</strong> were dependent upon the applied<br />
vertical pressure, σ 1 , <strong>and</strong> the soil properties. After a minimum consolidation period<br />
of 150 seconds, the vertical pressure on the specimen was manually increased in 10<br />
kPa increments every 30 seconds until: the geotextile reinforcement failed; the lateral<br />
displacement limit of the UCD was reached; or, the upper limits of the measuring devices<br />
were approached. In some tests, loading was discontinued prior to reaching one<br />
of the above conditions <strong>and</strong> the vertical pressure held constant so that the response of<br />
the UCD specimen under sustained loading could be monitored. The UCD design, operation,<br />
<strong>and</strong> test procedure are presented in more detail in the paper <strong>by</strong> <strong>Boyle</strong> (1995a).<br />
Since the tension in each end in the geotextile specimen was measured throughout<br />
each test, the “apparent” in-soil geotextile specimen stiffness values could be computed<br />
<strong>by</strong> dividing the tension <strong>by</strong> the corresponding strain values. Due to frictional interaction<br />
between the soil <strong>and</strong> geotextile specimen, the loads measured at each end of the geotextile<br />
specimen were not necessarily equal throughout each test. The difference between<br />
the two loads increased with decreasing geotextile specimen stiffness, increasing soil<br />
friction, <strong>and</strong> increasing strain. The distribution of tensile strain was measured in a few<br />
tests <strong>by</strong> attaching strain gauges to the geotextile specimen. The strain was observed to<br />
decrease approximately linearly from the left clamp to the right clamp (<strong>Boyle</strong> 1995a).<br />
The confined stiffness values were computed <strong>by</strong> averaging the tensile forces measured<br />
in each end of the geotextile specimen. Unfortunately, due to the UCD mode of operation,<br />
direct comparison of the stiffness values obtained from UCD tests with stiffness<br />
values obtained from tests performed with other in-isolation or in-soil devices may be<br />
difficult for the following reasons:<br />
S The confined stiffness of geosynthetics has often been measured using devices which<br />
apply a constant pressure normal to the geosynthetic during load application<br />
(McGown et al. 1982; Ling et al. 1992). For the UCD tests in this study, the normal<br />
pressure on the geotextile specimen was not constant but increased continually during<br />
each test. This process models the conditions that occur during the construction of<br />
GRS walls. However, the apparent stiffness, of geosynthetics sensitive to confinement,<br />
changes as the normal pressure increases during testing. Arriving at a single<br />
stiffness value for the geotextile specimens from the UCD test results is difficult because<br />
for each test the geotextile specimen strain <strong>and</strong> normal pressure differ depending<br />
on the soil properties <strong>and</strong> the effective lateral confining pressure.<br />
S Other in-soil geosynthetic testing devices maintain a constant strain rate throughout<br />
each test (McGown et al. 1982; Wu 1991; Ling et al. 1992). For the UCD device however,<br />
the load is applied to the soil <strong>and</strong> the rate of lateral expansion is dependent on<br />
GEOSYNTHETICS INTERNATIONAL S 1996, VOL. 3, NO. 2<br />
217
BOYLE et al. D Influence of Strain Rate, Length <strong>and</strong> Confinement on Geotextiles<br />
the soil response <strong>and</strong> may vary during testing. Any variation in the geosynthetic strain<br />
rate may cause the apparent stiffness values of strain-rate-sensitive geosynthetics to<br />
vary during a test.<br />
3.2 Nonwoven Needle-Punched Geotextiles<br />
Although more than 17 UCD tests were carried out on NW1 <strong>and</strong> NW2 specimens, a<br />
meaningful stiffness value could not be determined in all of the tests. No stiffness values<br />
were computed if the difference in tension measured at the two ends of the geotextile<br />
specimen was deemed excessive, or if the UCD specimen exhibited odd (i.e. very different<br />
than that observed in other tests) behavior during the test. It was virtually impossible<br />
to determine a single stiffness value for either of the NW1 <strong>and</strong> NW2 specimens<br />
due to: low specimen tensile loads; variability of specimen strength due to the manufacturing<br />
process; variability in specimen preparation; <strong>and</strong> the nonuniform tension in the<br />
specimens.<br />
However, even with limited data, it can be implied that the apparent stiffness values<br />
increased above the stiffness values obtained from ASTM D 4595 st<strong>and</strong>ard tests on 100<br />
mm gauge length specimens when confined in soil (Figure 5). The NW1 <strong>and</strong> NW2 specimens<br />
had confined stiffness values one to four times larger than the st<strong>and</strong>ard, 100 mm<br />
gauge length, in-isolation tests. This increase in stiffness values for the NW1 <strong>and</strong> NW2<br />
specimens due to confinement in soil <strong>and</strong> the application of a normal pressure was anticipated<br />
since this effect had been reported <strong>by</strong> others (McGown et al. 1982). The extrapolated<br />
“zero” gauge length in-isolation 5% secant stiffness values were within the range<br />
of in-soil stiffness values determined from the UCD tests (Figure 5).<br />
Developing a correlation between in-isolation <strong>and</strong> in-soil stiffness was not possible<br />
because the normal pressure on the geotextile specimens changed throughout each<br />
UCD test <strong>and</strong> was dependent on both the soil strength <strong>and</strong> the confining pressure applied<br />
to the soil. The relationship between NW1 <strong>and</strong> NW2 specimen stiffness values <strong>and</strong> normal<br />
pressure prevents the development of an exact correlation between UCD determined<br />
stiffness values <strong>and</strong> the projected zero gauge length stiffness values of nonwoven<br />
geotextile specimens determined through in-isolation tests, as was suggested <strong>by</strong> Christopher<br />
et al. (1986) <strong>and</strong> Resl (1990). A different confined testing program, perhaps utilizing<br />
one of the devices reviewed <strong>by</strong> Wu (1991), is recommended for determining the<br />
confined stiffness values of needle-punched nonwoven geotextile specimens at specific<br />
normal pressures. The projected zero gauge length stiffness values could be compared<br />
to the confined stiffness values to determine how closely they approximate the confined<br />
stiffness values, if at all, <strong>and</strong> for what normal pressures.<br />
The limited tests performed in this study, <strong>and</strong> the scatter in the test data, are insufficient<br />
to confirm or rule out the potential for a “zero” gauge length test to adequately<br />
predict the in-soil stiffness values of nonwoven needle-punched geotextiles. Further research<br />
is recommended as the monetary <strong>and</strong> time savings associated with performing<br />
in-isolation tests instead of in-soil tests would be significant. Any research undertaken<br />
for this purpose, using nonwoven needle-punched geotextile specimens similar to NW1<br />
<strong>and</strong> NW2, should use a large number of specimens because of the high degree of<br />
manufacturing variability observed in these geotextiles.<br />
218 GEOSYNTHETICS INTERNATIONAL S 1996, VOL. 3, NO. 2
BOYLE et al. D Influence of Strain Rate, Length <strong>and</strong> Confinement on Geotextiles<br />
3.3 Woven Geotextiles<br />
An increase in stiffness values with confinement was not observed for PP1, PP2, PP3,<br />
PET1 <strong>and</strong> PET2 specimens; instead, the stiffness values decreased significantly in comparison<br />
to the in-isolation ASTM D 4595 test values (Figure 9). The stiffness values<br />
computed for PP1, PP2 <strong>and</strong> PP3 specimens were between 40 <strong>and</strong> 80% of the 5% secant<br />
stiffness value (stiffness values taken at 5% strain) determined from ASTM D 4595<br />
tests. The PET1 specimens were not as greatly affected <strong>by</strong> confinement; with stiffness<br />
values near 90% of the ASTM D 4595 5% secant stiffness value. One notable difference<br />
between tests conducted in the UCD <strong>and</strong> ASTM D 4595 tests is the rate at which the<br />
geotextile specimens were strained. St<strong>and</strong>ard ASTM D 4595 tests are conducted at<br />
strain rates of 10%/minute while UCD specimens experienced average strain rates between<br />
0.5 <strong>and</strong> 0.035%/minute, 20 to 300 times slower than the st<strong>and</strong>ard test (Figure 9).<br />
Scatter in the normalized stiffness values for the in-soil tests is principally attributed<br />
to variability in the geotextile specimens, as the values determined for in-isolation tests<br />
have similar ranges. Also, the use of an “apparent” stiffness value for the in-soil tests,<br />
soil variability, <strong>and</strong> specimen preparation problems associated with clamping the geotextile<br />
specimen outside the soil specimen boundaries contributed to the scatter in the<br />
normalized stiffness values.<br />
A reduction in stiffness values of geosynthetics with decreasing strain rate has been<br />
reported <strong>by</strong> Rowe <strong>and</strong> Ho (1986), Wang et al. (1990), Nothdurft <strong>and</strong> Janardhanam<br />
5% secant stiffness / D 4595 5% secant stiffness<br />
1.4<br />
1.2<br />
1.0<br />
0.8<br />
0.6<br />
0.4<br />
Polyester<br />
Reinforcement, Soil<br />
PP1, Soil R<br />
PP2, Soil O<br />
PP2, Soil R<br />
PP3, Soil O<br />
PP3, Soil R<br />
PET1, Soil O<br />
PET1, Soil R<br />
Polypropylene<br />
Range from in-isolation tests (typical)<br />
0.2<br />
0.00 0.05 0.10 0.15 0.20 0.25<br />
Strain rate (%/minute)<br />
Figure 9. Normalized 5% secant stiffness values versus strain rate for woven geotextile<br />
specimens.<br />
Note: Ranges shown were determined from in-isolation tests performed at the indicated strain rate.<br />
GEOSYNTHETICS INTERNATIONAL S 1996, VOL. 3, NO. 2<br />
219
BOYLE et al. D Influence of Strain Rate, Length <strong>and</strong> Confinement on Geotextiles<br />
(1994) <strong>and</strong> Nothdurft (1995). A decreasing strain rate is the suspected cause of the reduction<br />
in stiffness values observed in this study. The increase in the rate at which tension<br />
developed in the woven geotextile specimens when the lateral strain rate was increased<br />
verified that woven geotextiles display substantial strain rate dependency. This<br />
is in agreement with the in-isolation tests conducted in this study (Figure 9). This fairly<br />
close relationship between strain rate <strong>and</strong> woven geotextile stiffness values, especially<br />
for PP1, PP2 <strong>and</strong> PP3 specimens, suggests that neither the stiffness values nor the strain<br />
dependency of the woven geotextile specimens measured in the UCD were influenced<br />
<strong>by</strong> confinement. The slight difference in strength reduction with decreasing strain rate<br />
for PET1 specimens, when compared with the in-isolation tests, may be due to confinement<br />
in soil but is more likely due to differences between PET2 specimens, which were<br />
tested in-isolation, <strong>and</strong> PET1 specimens which were exhumed from the Rainier Avenue<br />
wall site. Provided the strain rate effects are known, this decoupling of woven geotextile<br />
stiffness values from confinement effects should simplify testing of woven geotextiles,<br />
since only in-isolation testing is required. This is in agreement with the in-soil loadelongation<br />
tests reported <strong>by</strong> Wilson-Fahmy et al. (1993) who concluded that only nonwoven<br />
geotextile specimens require confined testing. In-isolation testing should be performed<br />
to define the relationship of strength <strong>and</strong> stiffness to strain rate.<br />
4 ASSESSMENT OF ASTM D 4595: WIDE-WIDTH STRIP TENSILE TEST<br />
The ASTM D 4595 st<strong>and</strong>ard test specifies that strength <strong>and</strong> stiffness values of geotextiles<br />
be determined, regardless of the material properties <strong>and</strong> the manufacturing technique,<br />
<strong>by</strong> conducting an in-isolation load-elongation test on 100 mm gauge length <strong>by</strong><br />
200 mm wide specimens strained at 10%/minute. The tests conducted on both the woven<br />
<strong>and</strong> nonwoven geotextile specimens in this study illustrate the problem of applying<br />
such a universal st<strong>and</strong>ard to geotextiles which are manufactured using a variety of materials<br />
<strong>and</strong> techniques. Material properties, manufacturing process, specimen size, strain<br />
rate, <strong>and</strong>, in the case of the nonwoven geotextiles, confinement, affect the measured<br />
performance of these geotextiles. While a universal st<strong>and</strong>ard may be appropriate for<br />
quality control testing <strong>by</strong> manufacturers, it appears that the ASTM D 4595 st<strong>and</strong>ard is<br />
inappropriate, in its current form, for obtaining engineering properties of geotextile reinforcement.<br />
The effect of strain rate on the computed stiffness values of the woven geotextile<br />
specimens (PP1, PP2, PP3 <strong>and</strong> PET2) implies that the stiffness values determined from<br />
ASTM D 4595 are actually “apparent” stiffness values <strong>and</strong> are not an intrinsic property<br />
of the material (Nothdurft <strong>and</strong> Janardhanam 1994; Nothdurft 1995). For strain rate susceptible<br />
geotextiles not influenced <strong>by</strong> confinement in soil, a better approach for obtaining<br />
the engineering properties may be to perform a series of in-isolation tests at various<br />
strain rates <strong>and</strong> plot the 5% secant stiffness values versus gauge length (Figure 5). When<br />
designing or evaluating a GRS wall, the “apparent” stiffness values, which depend on<br />
the strain rate anticipated during construction, could be obtained from interpolation or<br />
extrapolation of the strain rate test data from such a plot. Since a series of tests which<br />
define the influence of strain rate on engineering properties would take less time to perform<br />
than creep tests, the engineering data needed for the design of GRS structures<br />
could be quickly obtained for any particular geosynthetic reinforcement. While each<br />
220 GEOSYNTHETICS INTERNATIONAL S 1996, VOL. 3, NO. 2
BOYLE et al. D Influence of Strain Rate, Length <strong>and</strong> Confinement on Geotextiles<br />
designer could commission testing for each geosynthetic in the design, it would be easier<br />
<strong>and</strong> reduce repetition, if manufacturers, suppliers, or independent research facilities<br />
provided charts or tables which address the influence of strain rate on each specific geosynthetic.<br />
A similar situation exists for testing nonwoven geotextiles that have apparent stiffness<br />
values dependent on gauge length, strain rate, <strong>and</strong> normal pressure. Although the<br />
ASTM D 4595 st<strong>and</strong>ard test may be appropriate for manufacturer quality control, <strong>and</strong><br />
while conservative if used directly in design, it is all but useless for obtaining “actual”<br />
engineering properties without a correlation to account for gauge length, strain rate, <strong>and</strong><br />
normal pressure. Furthermore, the substantial variation in the mass per unit area of the<br />
nonwoven geotextile specimens (NW1 <strong>and</strong> NW2) tested, emphasizes the importance<br />
of testing a statistically significant number of specimens in any program performed to<br />
characterize nonwoven geotextiles. A large number of tests may be required to determine<br />
with confidence the minimum average strength <strong>and</strong> stiffness values (i.e. two or<br />
more st<strong>and</strong>ard deviations below the mean) for these materials so that sufficiently conservative<br />
values may be used in design.<br />
The laboratory program reported here was of insufficient scope to make more specific<br />
recommendations with regard to modification of the ASTM D 4595 st<strong>and</strong>ard than those<br />
made above. The findings do, however, highlight the problems which accompany the<br />
universal application of a single st<strong>and</strong>ardized test procedure to geotextiles that behave<br />
differently depending on the geotextile composition <strong>and</strong> the manufacturing process.<br />
Further research is needed.<br />
5 PRACTICAL IMPLICATIONS<br />
The importance of a clear underst<strong>and</strong>ing of geosynthetic reinforcement behavior, developed<br />
through appropriate testing, when designing GRS structures or modeling their<br />
behavior can be illustrated <strong>by</strong> comparing the findings reported above with the conclusions<br />
reached <strong>by</strong> Zornberg <strong>and</strong> Mitchell (1993, 1994). Zornberg <strong>and</strong> Mitchell performed<br />
a finite element method (FEM) analysis of the Rainier Avenue wall, the same<br />
wall from which PP1, PP2, PP3 <strong>and</strong> PET1 samples were obtained (Allen et al. 1992).<br />
Zornberg <strong>and</strong> Mitchell used backfill soil properties determined from triaxial tests <strong>and</strong><br />
geosynthetic reinforcement properties determined using the ASTM D 4595 st<strong>and</strong>ard<br />
(STS 1990) to model the soil <strong>and</strong> the geosynthetic reinforcement behavior. To calibrate<br />
their FEM model <strong>and</strong> thus adequately model the behavior observed in the Rainier Avenue<br />
wall, Zornberg <strong>and</strong> Mitchell had to increase the stiffness of the woven geotextile.<br />
Since this action was necessary, Zornberg <strong>and</strong> Mitchell concluded that the stiffness of<br />
the woven geotextiles must have increased due to confinement. The results of the writers’<br />
laboratory investigation contradict the conclusion drawn <strong>by</strong> Zornberg <strong>and</strong> Mitchell.<br />
The Rainier Avenue wall was constructed in approximately two months <strong>and</strong> the woven<br />
geotextile reinforcement generally experienced strain values less than 1% (Allen<br />
et al. 1992). Strain rates were, therefore, of the order of 0.00001%/minute - 1 million<br />
times slower than the ASTM D 4595 specified strain rate. Extrapolating the data presented<br />
in Figures 3 or 9, the stiffness values corresponding to this strain rate would fall<br />
between 30 to 50% <strong>and</strong> 70 to 90% of the ASTM D 4595 determined stiffness values for<br />
the polypropylene <strong>and</strong> polyester woven geotextiles, respectively. Since confinement<br />
GEOSYNTHETICS INTERNATIONAL S 1996, VOL. 3, NO. 2<br />
221
BOYLE et al. D Influence of Strain Rate, Length <strong>and</strong> Confinement on Geotextiles<br />
was not shown to influence the geotextile specimens in the laboratory tests of this study,<br />
it is unlikely that confinement resulted in doubling of the ASTM D 4595 geotextile<br />
specimen strength values for geotextiles used in the Rainier Avenue wall, as Zornberg<br />
<strong>and</strong> Mitchell concluded. A different factor associated with the method which Zornberg<br />
<strong>and</strong> Mitchell used to model the wall must have been responsible for the increased stiffness<br />
values of the geotextile reinforced soil.<br />
The writers’ suggest that plane strain soil behavior was likely responsible for the reduction<br />
in deformations below those computed <strong>by</strong> Zornberg <strong>and</strong> Mitchell with the unadjusted<br />
reinforcement properties. The plane strain friction angles for dense cohesionless<br />
soils have been shown to be greater than the friction angle obtained from triaxial<br />
tests, <strong>and</strong> reach their peak strength values at lower strain values in plane strain tests than<br />
in triaxial tests (Marachi et al. 1981). Both of these factors were confirmed for the soil<br />
used in the Rainier Avenue wall (<strong>Boyle</strong> 1995a), <strong>and</strong> would account for decreased deformations.<br />
Thus, the conclusion reached <strong>by</strong> Zornberg <strong>and</strong> Mitchell that the stiffness<br />
values of the woven geotextiles must increase with confinement is incorrect.<br />
It should be acknowledged that adjustment of the soil data (i.e. the stress-strain<br />
curves), instead of the geotextile reinforcement data, would have been much more complicated<br />
since no plane strain soil data was available to Zornberg <strong>and</strong> Mitchell. Also,<br />
no technique is available for converting triaxial stress-strain curves to plane strain<br />
stress-strain curves. Furthermore, Zornberg <strong>and</strong> Mitchell did not have access to variable<br />
strain rate test results for the four woven geotextiles, which were produced as part of<br />
this study, <strong>and</strong> thus they could not incorporate the reduction in stiffness values with decreased<br />
strain rate into their model.<br />
6 CONCLUSIONS<br />
The following conclusions from this study can be made:<br />
(1) In-isolation wide-width strip tensile tests (ASTM D 4595) on woven geotextile<br />
specimens (PP1, PP2, PP3 <strong>and</strong> PET2) conducted at different strain rates determined<br />
that the strength <strong>and</strong> stiffness values of these geotextiles decreased with decreasing<br />
strain rate. The decrease in the 5% secant stiffness values associated with a decrease<br />
in strain rate from 10 to 0.01%/minute was approximately 50 <strong>and</strong> 15% for the polypropylene<br />
<strong>and</strong> polyester geotextiles, respectively.<br />
(2) No increase in strength values was observed with reductions in specimen length for<br />
the nonwoven geotextile specimens (NW1 <strong>and</strong> NW2), although the stiffness values<br />
of these geotextiles did increase. The “zero” gauge length 5% secant stiffness values<br />
for the NW1 <strong>and</strong> NW2 specimens increased <strong>by</strong> approximately 130 <strong>and</strong> 65%, respectively,<br />
above the stiffness values measured using the st<strong>and</strong>ard 100 mm gauge length.<br />
Confinement of NW1 <strong>and</strong> NW2 specimens in soil resulted in an increase in stiffness<br />
values above the in-isolation stiffness values measured on 100 mm gauge length<br />
specimens using ASTM D 4595, but no correlation between the “zero” gauge length<br />
in-isolation stiffness <strong>and</strong> the confined stiffness could be made.<br />
(3) The stiffness values of the woven geotextile specimens did not increase with confinement<br />
in soil, <strong>and</strong> confinement did not influence the strain rate effect. The woven<br />
geotextile specimens tested in soil exhibited reductions in stifffness with decreases<br />
222 GEOSYNTHETICS INTERNATIONAL S 1996, VOL. 3, NO. 2
BOYLE et al. D Influence of Strain Rate, Length <strong>and</strong> Confinement on Geotextiles<br />
in strain rate similar to those observed in in-isolation tests on the same type of geotextile.<br />
(4) The ASTM D 4595 wide-width strip tensile test was found to be deficient for the<br />
determination of the engineering properties of geotextiles used in reinforcement applications.<br />
The cause of this deficiency is the universal application of st<strong>and</strong>ardized<br />
strain rates <strong>and</strong> specimen dimensions to geotextiles that are strain rate sensitive <strong>and</strong><br />
influenced <strong>by</strong> specimen dimensions. To determine the engineering properties of<br />
geotextiles that may be used in the design <strong>and</strong> evaluation of GRS structures it is recommended<br />
that modifications be made to ASTM D 4595 which account for material<br />
variability.<br />
ACKNOWLEDGMENTS<br />
The work presented in this paper was funded <strong>by</strong> the Washington State Department<br />
of Transportation. Their financial support is greatly appreciated. Thanks also to T.M.<br />
Allen for his continued interest in the project <strong>and</strong> many helpful discussions. We also<br />
thank the reviewers of the paper for their comments.<br />
REFERENCES<br />
Allen, T.M., Christopher, B.R. <strong>and</strong> Holtz, R.D., 1992, “Performance of a 12.6 m High<br />
Geotextile Wall in Seattle, Washington”, Geosynthetic-Reinforced Soil Retaining<br />
Walls, Wu, J.T.H., Editor, Balkema, Proceedings of a symposium held in Denver, Colorado,<br />
USA, August 1991, pp. 81-100.<br />
ASTM D 4253, “St<strong>and</strong>ard Test Methods for Maximum Index Density <strong>and</strong> Unit Weight<br />
of Soils Using a Vibratory Table”, American Society for Testing <strong>and</strong> Materials, West<br />
Conshohocken, Pennsylvania, USA.<br />
ASTM D 4595, “St<strong>and</strong>ard Test Method for Tensile Properties of Geotextiles <strong>by</strong> the<br />
Wide-Width Strip Method”, American Society for Testing <strong>and</strong> Materials, West Conshohocken,<br />
Pennsylvania, USA.<br />
<strong>Boyle</strong>, S.R., 1995a, “Deformation Prediction of Geosynthetic Reinforced Soil Retaining<br />
Walls”, Ph.D. Dissertation, Department of Civil Engineering, University of<br />
Washington, Seattle, Washington, USA, 391 p.<br />
<strong>Boyle</strong>, S.R., 1995b, “Unit Cell Tests on Reinforced Cohesionless Soils”, Proceedings<br />
of Geosynthetics ’95, IFAI, Vol. 3, Nashville, Tennessee, USA, February 1995, pp.<br />
1221-1234.<br />
<strong>Boyle</strong>, S.R. <strong>and</strong> Holtz, R.D., 1994, “Deformation Characteristics of Geosynthetic-Reinforced<br />
Soil”, Proceedings of the Fifth <strong>International</strong> Conference on Geotextiles,<br />
Geomembranes <strong>and</strong> Related Products, Vol. 1, Singapore, September 1994, pp.<br />
361-364.<br />
Christopher, B.R., Holtz, R.D. <strong>and</strong> Bell, W.D., 1986, “New Tests for Determining The<br />
In-Soil Stress-Strain Properties of Geotextiles”, Proceedings of the Third <strong>International</strong><br />
Conference On Geotextiles, Vol. 3, Vienna, Austria, April 1986, pp. 683-686.<br />
GEOSYNTHETICS INTERNATIONAL S 1996, VOL. 3, NO. 2<br />
223
BOYLE et al. D Influence of Strain Rate, Length <strong>and</strong> Confinement on Geotextiles<br />
<strong>Gallagher</strong>, M., 1995, “In-Isolation Wide Width Tests on Geotextiles”, M.Sc. Thesis, Department<br />
of Civil Engineering, University of Washington, Seattle, USA, 135 p.<br />
Industrial Fabrics Association <strong>International</strong>, 1989, “1990 Specifier’s Guide”, Geotechnical<br />
Fabrics Report, Vol. 7, No. 7, 120 p.<br />
Industrial Fabrics Association <strong>International</strong>, 1992, “1993 Specifier’s Guide”, Geotechnical<br />
Fabrics Report, Vol. 10, No. 7, 196 p.<br />
Koerner, R.M., 1994, “Designing with Geosynthetics”, 3rd Edition, Prentice Hall, Englewood<br />
Cliffs, New Jersey, USA, 783 p.<br />
Leshchinsky, D. <strong>and</strong> Fowler, J., 1990, “Laboratory Measurement of Load-Elongation<br />
Relationship of High Strength Geotextiles”, Geotextiles <strong>and</strong> Geomembranes, Vol. 9,<br />
No. 2, pp. 145-164.<br />
Ling, H.I., Wu, J.T.H. <strong>and</strong> Tatsuoka, F., 1992, “Short-term Strength <strong>and</strong> Deformation<br />
Characteristics of Geotextiles Under Typical Operational Conditions”, Geotextiles<br />
<strong>and</strong> Geomembranes, Vol. 11, No. 2, pp. 185-219.<br />
Marachi, N.D., Duncan, J.M., Chan, C.K. <strong>and</strong> Seed, H.B., 1981, “Plane-Strain Testing<br />
of S<strong>and</strong>”, Laboratory Shear Strength of Soil, Yong, R.N. <strong>and</strong> Townsend, F.C., Editors,<br />
ASTM Special <strong>Technical</strong> Publication 740, proceedings of a symposium held in Chicago,<br />
Illinois, USA, June 1980, pp. 294-302.<br />
McGown, A., Andrawes, K.Z. <strong>and</strong> Kabir, M.H., 1982, “Load-Extension Testing of<br />
Geotextiles Confined In Soil”, Proceedings of the Second <strong>International</strong> Conference<br />
on Geotextiles, IFAI, Vol. 3, Las Vegas, Nevada, USA, August 1982, pp. 793-798.<br />
Nothdurft, D.B., 1995, “Discussion of ‘Tensile Reinforcement Effects on Bridge-Approach<br />
Settlement’”, Journal of Geotechnical Engineering, Vol. 121, No. 1, pp.<br />
94-96.<br />
Nothdurft, D.B. <strong>and</strong> Janardhanam, R., 1994, “Influence of Polymer Viscoelasticity in<br />
Reinforced Soil Structure Design”, Proceedings of the Fifth <strong>International</strong> Conference<br />
on Geotextiles, Geomembranes <strong>and</strong> Related Products, Vol. 1, Singapore, September<br />
1994, pp. 247-250.<br />
Paulson, J., 1993, “High Strength Polyester Geotextile Testing <strong>and</strong> Material Property<br />
Evaluation”, Geosynthetic Soil Reinforcement Testing Procedures, Chen, S.C.J., Editor,<br />
ASTM St<strong>and</strong>ard <strong>Technical</strong> Publication 1190, proceedings of a symposium held<br />
in San Antonio, Texas, USA, January 1993, pp. 111-118.<br />
Resl, S., 1990, “Soil-Reinforcing Mechanisms of Nonwoven Geotextiles”, Proceedings<br />
of the Fourth <strong>International</strong> Conference on Geotextiles, Geomembranes <strong>and</strong> Related<br />
Products, Balkema, Vol. 1, The Hague, The Netherl<strong>and</strong>s, May 1990, pp. 93-96.<br />
Rowe, R.K. <strong>and</strong> Ho, S.K., 1986, “Determination of Geotextile Stress-Strain Characteristics<br />
Using a Wide Strip Test”, Proceedings of the Third <strong>International</strong> Conference<br />
on Geotextiles, Vol. 3, Vienna, Austria, April 1986, pp. 885-890.<br />
STS Consultants, Inc., 1990, “Final Report of <strong>SR</strong>-90, Rainier Avenue Interchange:<br />
Geotextile Wall Instumentation Project”, Prepared for the Washington State Department<br />
of Transportation, Washington, USA, 73 p. plus appendices.<br />
224 GEOSYNTHETICS INTERNATIONAL S 1996, VOL. 3, NO. 2
BOYLE et al. D Influence of Strain Rate, Length <strong>and</strong> Confinement on Geotextiles<br />
Wang, A., Zhang, B. <strong>and</strong> Lu, L., 1990, “Research of Influence of Test Conditions on<br />
the Tensile Strength of Geotextile”, Proceedings of the Fourth <strong>International</strong> Conference<br />
on Geotextiles, Geomembranes <strong>and</strong> Related Products, Balkema, Vol. 2, The<br />
Hague, The Netherl<strong>and</strong>s, May 1990, p. 782.<br />
Wilson-Fahmy, R.F., Koerner, R.M. <strong>and</strong> Fleck, J.A., 1993, “Unconfined <strong>and</strong> Confined<br />
Wide Width Testing of Geosynthetics”, Geosynthetic Soil Reinforcement Testing Procedures,<br />
Chen, S.C.J., Editor, ASTM St<strong>and</strong>ard <strong>Technical</strong> Publication 1190, proceedings<br />
of a symposium held in San Antonio, Texas, USA, January 1993, pp. 49-63.<br />
Wu, J.T.H., 1991, “Measuring Inherent Load-Extension Properties of Geotextiles for<br />
Design of Reinforced Structures”, Geotechnical Testing Journal, ASTM, Vol. 14, No.<br />
2, pp. 157-165.<br />
Yeo, K.C., 1985, “The Behavior of Polymeric Grids for Soil Reinforcement”, Ph.D. Dissertation,<br />
University of Strathclyde, Glasgow, UK, 356 p.<br />
Zornberg, J.G. <strong>and</strong> Mitchell, J.K., 1993, “Finite Element Analysis of Geosynthetically<br />
Reinforced Soil Walls with Sloping Backfills”, Geotechnical Engineering Report No.<br />
UCB/GT/93-04, Department of Civil Engineering, University of California, Berkeley,<br />
California, USA, 164 p.<br />
Zornberg, J.G. <strong>and</strong> Mitchell, J.K., 1994, “Effect of Sloping Backfills on Geosynthetically<br />
Reinforced Walls”, Proceedings of the Fifth <strong>International</strong> Conference on Geotextiles,<br />
Geomembranes <strong>and</strong> Related Products, Vol. 1, Singapore, September 1994,<br />
pp. 201-206.<br />
GEOSYNTHETICS INTERNATIONAL S 1996, VOL. 3, NO. 2<br />
225