Identification of hydrocarbons in chalk reservoirs from surface - GEUS
Identification of hydrocarbons in chalk reservoirs from surface - GEUS
Identification of hydrocarbons in chalk reservoirs from surface - GEUS

You also want an ePaper? Increase the reach of your titles
YUMPU automatically turns print PDFs into web optimized ePapers that Google loves.
<strong>Identification</strong> <strong>of</strong> <strong>hydrocarbons</strong> <strong>in</strong> <strong>chalk</strong> <strong>reservoirs</strong> <strong>from</strong><br />
<strong>surface</strong> seismic data: South Arne field, North Sea<br />
Peter Japsen, Anders Bruun, Ida L. Fabricius and Gary Mavko<br />
Seismic data are ma<strong>in</strong>ly used to map out structures <strong>in</strong> the<br />
sub<strong>surface</strong>, but are also <strong>in</strong>creas<strong>in</strong>gly used to detect differences<br />
<strong>in</strong> porosity and <strong>in</strong> the fluids that occupy the pore space <strong>in</strong><br />
sedimentary rocks. Hydrocarbons are generally lighter than<br />
br<strong>in</strong>e, and the bulk density and sonic velocity (speed <strong>of</strong> pressure<br />
waves or P-wave velocity) <strong>of</strong> hydrocarbon-bear<strong>in</strong>g sedimentary<br />
rocks are therefore reduced compared to non-reservoir<br />
rocks. However, sound is transmitted <strong>in</strong> different wave<br />
forms through the rock, and the shear velocity (speed <strong>of</strong> shear<br />
waves or S-wave velocity) is hardly affected by the density <strong>of</strong><br />
the pore fluid. In order to detect the presence <strong>of</strong> <strong>hydrocarbons</strong><br />
<strong>from</strong> seismic data, it is thus necessary to <strong>in</strong>vestigate how<br />
porosity and pore fluids affect the acoustic properties <strong>of</strong> a<br />
sedimentary rock. Much previous research has focused on<br />
describ<strong>in</strong>g such effects <strong>in</strong> sandstone (see Mavko et al. 1998),<br />
and only <strong>in</strong> recent years have correspond<strong>in</strong>g studies on the<br />
rock physics <strong>of</strong> <strong>chalk</strong> appeared (e.g. Walls et al. 1998; Røgen<br />
2002; Fabricius 2003; Gommesen 2003; Japsen et al. 2004).<br />
In the North Sea, <strong>chalk</strong> <strong>of</strong> the Danian Ek<strong>of</strong>isk Formation<br />
and the Maastrichtian Tor Formation are important reservoir<br />
rocks. More <strong>in</strong>formation could no doubt be extracted <strong>from</strong><br />
seismic data if the fundamental physical properties <strong>of</strong> <strong>chalk</strong><br />
were better understood. The presence <strong>of</strong> gas <strong>in</strong> <strong>chalk</strong> is known<br />
to cause a phase reversal <strong>in</strong> the seismic signal (Megson 1992),<br />
but the presence <strong>of</strong> oil <strong>in</strong> <strong>chalk</strong> has only recently been demonstrated<br />
to have an effect on <strong>surface</strong> seismic data (Japsen et al.<br />
2004). The need for a better l<strong>in</strong>k between <strong>chalk</strong> reservoir<br />
parameters and geophysical observations has, however,<br />
strongly <strong>in</strong>creased s<strong>in</strong>ce the discovery <strong>of</strong> the Halfdan field<br />
proved major reserves outside four-way dip closures (Jacobsen<br />
et al. 1999; Vejbæk & Kristensen 2000).<br />
fitted to Ek<strong>of</strong>isk field <strong>chalk</strong> (Walls et al. 1998). The curve was<br />
smoothly extended to 45% porosity us<strong>in</strong>g core data <strong>from</strong> the<br />
high-porosity South Arne <strong>chalk</strong>. Based on this curve, the<br />
acoustic properties <strong>of</strong> <strong>chalk</strong> may be calculated as a function<br />
<strong>of</strong> water saturation. This is done by apply<strong>in</strong>g Gassmann’s<br />
equations, which relate the elastic properties <strong>of</strong> a rock saturated<br />
with one fluid to those <strong>of</strong> the same rock saturated with<br />
a different fluid (cf. Mavko et al. 1998). The results <strong>in</strong>dicate<br />
a pronounced change <strong>in</strong> the relationship between P- and S-<br />
velocities for <strong>chalk</strong> saturated with light oil for porosities<br />
above c. 30% (Fig. 2). This relationship is described by the<br />
Poisson ratio, and this can provide <strong>in</strong>formation about lithology<br />
and fluid content <strong>of</strong> hydrocarbon-bear<strong>in</strong>g <strong>reservoirs</strong>. For<br />
a rock <strong>of</strong> a given porosity, high pore fluid density results <strong>in</strong><br />
high P-wave velocity and high Poisson ratio, whereas <strong>hydrocarbons</strong><br />
with low fluid density result <strong>in</strong> low P-wave velocity<br />
and almost unchanged S-wave velocity and a low Poisson<br />
ratio.<br />
These results <strong>from</strong> the model <strong>of</strong> the acoustic properties <strong>of</strong><br />
the <strong>chalk</strong> <strong>in</strong>dicate that light oil <strong>in</strong> the high-porous <strong>chalk</strong> <strong>of</strong><br />
the South Arne field may be detected through Amplitude<br />
Rigs-1<br />
SA-1<br />
Rigs-2<br />
Ek<strong>of</strong>isk North<br />
Sea<br />
Denmark<br />
South Arne<br />
Halfdan<br />
3000<br />
A l<strong>in</strong>k between reservoir porosity and<br />
sonic velocity <strong>in</strong> the South Arne <strong>chalk</strong><br />
Acoustic properties <strong>of</strong> the <strong>chalk</strong> <strong>of</strong> the Danish South Arne<br />
field have been <strong>in</strong>vestigated at three scales by analys<strong>in</strong>g core<br />
data, log read<strong>in</strong>gs and <strong>surface</strong> seismic data (Japsen et al.<br />
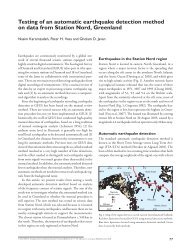
2004). The South Arne field is located <strong>in</strong> the central North<br />
Sea and <strong>chalk</strong> porosities <strong>of</strong> up to 45% are found <strong>in</strong> the reservoir<br />
at almost 3 km depth (Fig. 1). The velocity–porosity<br />
trend for pure <strong>chalk</strong> samples <strong>from</strong> the South Arne field<br />
matches a modified upper Hash<strong>in</strong>-Shtrikman (MUHS) curve<br />
56°03´N<br />
1 km<br />
3000<br />
2900<br />
I-1x<br />
4°15´E<br />
Fig. 1. The South Arne field; top <strong>chalk</strong> structure with<br />
location <strong>of</strong> selected wells.<br />
2820<br />
2900<br />
Geological Survey <strong>of</strong> Denmark and Greenland Bullet<strong>in</strong> 7, 13–16 (2005) © <strong>GEUS</strong>, 2005<br />
13
Moduli (GPa)<br />
40<br />
0.4<br />
K<br />
Sw<br />
1.0<br />
30<br />
0.3<br />
0.8<br />
20 G<br />
0.6<br />
0.2<br />
10<br />
0.4<br />
0.2<br />
0.0<br />
A<br />
B<br />
0<br />
0.1<br />
10 20 30 40 50 10 20 30 40 50<br />
Porosity (%) Porosity (%)<br />
Poisson ratio (-)<br />
Fig. 2. Acoustic properties <strong>of</strong> <strong>chalk</strong> as a<br />
function <strong>of</strong> porosity and water saturation<br />
(Sw). A: Bulk (K) and shear modulus (G);<br />
B: Poisson ratio. Note the pronounced<br />
difference <strong>in</strong> the Poisson ratio between<br />
br<strong>in</strong>e and oil for porosities above c. 30%.<br />
MUHS prediction based on f<strong>in</strong>e-scale mix<strong>in</strong>g<br />
and fluid properties for the South Arne field.<br />
Modified <strong>from</strong> Japsen et al. (2004).<br />
Versus Offset (AVO) <strong>in</strong>version <strong>of</strong> <strong>surface</strong> seismic data. This is<br />
because the variation <strong>in</strong> seismic reflection amplitude with<br />
change <strong>in</strong> distance between shotpo<strong>in</strong>t and receiver may <strong>in</strong>dicate<br />
differences <strong>in</strong> rock properties above and below the reflector.<br />
Changes <strong>in</strong> AVO can be directly related to changes <strong>in</strong> the<br />
Poisson ratio and thus to differences <strong>in</strong> pore fluid properties.<br />
The uppermost part <strong>of</strong> the <strong>chalk</strong> <strong>of</strong> the South Arne field is<br />
rich <strong>in</strong> clay (the Ek<strong>of</strong>isk Formation). Core data <strong>in</strong>dicate that<br />
clayrich <strong>chalk</strong> has significantly smaller P- and S-velocities and<br />
a higher Poisson ratio than observed for pure <strong>chalk</strong> (see Japsen<br />
et al. 2004, fig. 2). The relatively small velocities for a<br />
given porosity are probably an artefact due to a reduction <strong>in</strong><br />
porosity because clay fills up the pore space without affect<strong>in</strong>g<br />
the acoustic properties <strong>of</strong> the <strong>chalk</strong> matrix. However, the<br />
amount <strong>of</strong> silicates (typically quartz and clay) cannot always<br />
be predicted <strong>from</strong> the gamma log, because the <strong>chalk</strong> may be<br />
rich <strong>in</strong> very f<strong>in</strong>e-gra<strong>in</strong>ed silicates which are not all radioactive.<br />
In water-wet <strong>chalk</strong> the amount <strong>of</strong> very f<strong>in</strong>e-gra<strong>in</strong>ed<br />
material may be estimated <strong>from</strong> the water saturation (cf.<br />
Fabricius et al. 2002). The MUHS model <strong>of</strong> the acoustic<br />
properties <strong>of</strong> the <strong>chalk</strong> is therefore scaled accord<strong>in</strong>g to silicate<br />
content estimated <strong>from</strong> the water saturation.<br />
Comparison <strong>of</strong> well log data and core data<br />
The l<strong>in</strong>k between the <strong>surface</strong> seismic data and the reservoir<br />
properties <strong>in</strong> the South Arne field is complicated by difficulties<br />
<strong>in</strong> <strong>in</strong>terpret<strong>in</strong>g the sonic log, because mud filtrate has<br />
<strong>in</strong>vaded the reservoir near the well bore where the sonic log is<br />
registered (Fig. 3). The water saturation can be estimated at<br />
<strong>in</strong>termediate and long distances <strong>from</strong> the bore hole based on<br />
resistivity logs, but not adjacent to the well bore. However,<br />
the sonic waves travel close to the well bore and it is thus difficult<br />
to perform ‘fluid substitution’ <strong>of</strong> the data, i.e. to transform<br />
the acoustic data <strong>from</strong> the pore fluid environment<br />
where they are measured to the fully hydrocarbon-saturated<br />
environment <strong>of</strong> the reservoir (the virg<strong>in</strong> zone; cf. Gommesen<br />
2003).<br />
Comparison <strong>of</strong> P-wave velocity and porosity <strong>from</strong> log and<br />
core data clearly shows that the logg<strong>in</strong>g data record conditions<br />
close to the well bore, where mud filtrate has almost<br />
completely flushed the reservoir (Fig. 4). Core porosities<br />
match log porosities estimated <strong>from</strong> the density log assum<strong>in</strong>g<br />
full <strong>in</strong>vasion <strong>of</strong> mud filtrate (Fig. 4A) and P-wave velocities<br />
<strong>of</strong> br<strong>in</strong>e saturated cores generally correspond to read<strong>in</strong>gs <strong>of</strong> P-<br />
wave velocity <strong>in</strong> the borehole (Fig. 4B). Estimation <strong>of</strong> <strong>in</strong>vasion<br />
effects is usually difficult because <strong>of</strong> the lack <strong>of</strong> different<br />
types <strong>of</strong> data, and this study underl<strong>in</strong>es the importance <strong>of</strong><br />
hav<strong>in</strong>g access to core data.<br />
Sw<br />
Sxo<br />
?<br />
Water saturation<br />
Seismic Acoustic Acoustic<br />
Seismic<br />
data<br />
log log<br />
data<br />
Distance <strong>from</strong> drill hole Distance <strong>from</strong> drill hole<br />
Velocity<br />
Vp<br />
?<br />
Fig. 3. Illustration <strong>of</strong> the effects <strong>of</strong> <strong>in</strong>vasion <strong>of</strong> mud filtrate (blue) <strong>in</strong>to<br />
a reservoir saturated with <strong>hydrocarbons</strong> (red). Lower left diagram<br />
shows how water saturation (Sw) <strong>in</strong>creases towards the bore hole.<br />
Lower right diagram shows how the P-velocity also <strong>in</strong>creases towards<br />
the borehole due to the higher density <strong>of</strong> the mud filtrate compared to<br />
the <strong>hydrocarbons</strong>. The seismic data are <strong>in</strong>fluenced by water saturation<br />
<strong>in</strong> the virg<strong>in</strong> zone (Sw, registered by the deep resistivity log), and the<br />
acoustic log by the properties close to the well bore, whereas the<br />
shallow resistivity log registers the water saturation at some distance<br />
<strong>from</strong> the well bore (Sxo). Water saturation and sonic velocity are thus<br />
not known at the same di-stance <strong>from</strong> the bore hole, and therefore the<br />
acoustic properties <strong>of</strong> the virg<strong>in</strong> zone cannot be easily estimated.<br />
14
2780<br />
A B C<br />
Vs<br />
Vp<br />
2800<br />
Measured depth (m)<br />
2850<br />
Core porosity<br />
Ek<strong>of</strong>isk Fm<br />
Tor Fm<br />
Core Vp<br />
Core Vs<br />
MUHS<br />
Sonic log<br />
Ek<strong>of</strong>isk Fm<br />
Tor Fm<br />
MUHS<br />
Landís eq.<br />
0 25 50 75 100 1 2 3 4 0.1 0.2 0.3 0.4<br />
Sw, Porosity (%) Velocity (km/s) Poisson ratio (-)<br />
Fig. 4. Log data and predictions <strong>from</strong> the corrected MUHS model based on porosity and water saturation for the <strong>chalk</strong> section <strong>in</strong> the Rigs-2 well. A:<br />
Porosity (estimated <strong>from</strong> the density log) and water saturation (Sw). B: P- and S-wave velocity (Vp, Vs). Data (blue curves) and predictions <strong>from</strong> the<br />
corrected MUHS model (red curves). C: Poisson ratio <strong>in</strong> the virg<strong>in</strong> zone; prediction <strong>of</strong> the corrected MUHS model (full red curve), prediction based<br />
on Land’s (1968) equation (black dashed curve). In the high-porosity oil zone <strong>of</strong> the Tor Formation, the oil is predicted to be almost completely<br />
flushed. This is <strong>in</strong>dicated by the closeness <strong>of</strong> the measured Vp log (blue curve) and measured Vp for the br<strong>in</strong>e saturated cores (green circles),<br />
whereas the predicted Vp for the virg<strong>in</strong> zone is low (red curve based on the MUHS model and Sw). Modified <strong>from</strong> Japsen et al. 2004.<br />
Comparison <strong>of</strong> well log data and seismic<br />
data<br />
Two approaches may be followed to estimate the acoustic<br />
properties <strong>of</strong> the virg<strong>in</strong> zone <strong>in</strong> order to compare well data<br />
with seismic data (both are based on Gassmann’s equations):<br />
1. Transformation <strong>of</strong> the sonic data to reservoir conditions<br />
based on an estimation <strong>of</strong> the water saturation near the<br />
well bore. This can be done us<strong>in</strong>g Land’s (1968) equation<br />
that gives a smooth estimate <strong>of</strong> the water saturation some<br />
distance <strong>from</strong> the well bore (correspond<strong>in</strong>g to the more scattered<br />
registrations by the shallow resistivity log).<br />
2. Estimation <strong>of</strong> the acoustic properties <strong>of</strong> the reservoir <strong>from</strong><br />
the MUHS model with porosity and water saturation as<br />
<strong>in</strong>put (based on the deep resistivity log).<br />
Estimation <strong>of</strong> the Poisson ratio versus depth <strong>in</strong> the reservoir<br />
depends very much on the approach taken (Fig. 4). In the<br />
first approach, moderate <strong>in</strong>vasion is assumed and a featureless<br />
variation <strong>of</strong> the Poisson ratio results (Fig. 4C, dashed black<br />
curve). In the second approach, forced displacement <strong>of</strong> the<br />
<strong>hydrocarbons</strong> near the well bore is assumed and forward<br />
modell<strong>in</strong>g results <strong>in</strong> a characteristic pattern with pronounced<br />
peaks at top Ek<strong>of</strong>isk Formation and top Tor Formation, and<br />
low values <strong>in</strong> the highly porous Tor reservoir (full red curve).<br />
The latter pattern is <strong>in</strong> good agreement with the <strong>in</strong>verted seismic<br />
data (Fig. 5B, blue AVO curve). The AVO attributes<br />
were calculated <strong>from</strong> the angle-dependent impedance <strong>in</strong>versions<br />
comb<strong>in</strong>ed with <strong>in</strong>formation on the absolute level <strong>of</strong><br />
<strong>chalk</strong> velocity which is not conta<strong>in</strong>ed <strong>in</strong> the seismic data<br />
(Bach et al. 2003). Acoustic impedance, shear impedance and<br />
the Poisson ratio were extracted at the location <strong>of</strong> the Rigs-2<br />
well. The AVO results show a good match with the well log<br />
data. A low Poisson ratio <strong>in</strong> the Tor Formation near the Rigs-<br />
2 well is <strong>in</strong> agreement with the presence <strong>of</strong> light oil <strong>in</strong> the<br />
highly porous <strong>chalk</strong> <strong>of</strong> the South Arne field.<br />
The first approach based on Land’s (1968) equation<br />
results <strong>in</strong> a mismatch between log and seismic estimates <strong>of</strong><br />
the Poisson ratio <strong>in</strong> the virg<strong>in</strong> zone (Fig. 4C, dashed red curve<br />
versus Fig. 5B, blue AVO curve). Land’s equation (and the<br />
shallow resistivity log) thus apparently underestimates the<br />
mud-<strong>in</strong>vasion close to the well bore <strong>in</strong> the highly porous<br />
parts <strong>of</strong> the reservoir and probably reflects the conditions at<br />
some distance <strong>from</strong> where the sonic log P-wave propagates.<br />
This suggestion is further supported by the co<strong>in</strong>cidence <strong>of</strong><br />
log estimates <strong>of</strong> density and P-wave velocity with results <strong>from</strong><br />
core samples saturated with br<strong>in</strong>e. The content <strong>of</strong> <strong>hydrocarbons</strong><br />
thus appears to drop to a very low value close to the well<br />
bore where the P-wave velocity reaches its maximum value<br />
restrict<strong>in</strong>g the propagation <strong>of</strong> P-waves to a very narrow zone,<br />
whereas the propagation <strong>of</strong> S-waves is less affected by the<br />
pore fluid content (Fig. 3).<br />
The second approach based on the MUHS model results<br />
<strong>in</strong> a good match between log and seismic estimates <strong>of</strong> the<br />
Poisson ratio <strong>in</strong> the virg<strong>in</strong> zone (Fig. 4C, full red curve versus<br />
Fig. 5B, blue AVO curve). The best way to estimate the<br />
acoustic properties <strong>of</strong> the virg<strong>in</strong> zone is therefore to use the<br />
extended modified upper Hash<strong>in</strong>-Shtrikman velocity–porosity<br />
relation for <strong>chalk</strong>. AVO <strong>in</strong>version <strong>of</strong> the seismic data<br />
based on such synthetic sonic logs reveals a zone <strong>of</strong> very low<br />
15
4<br />
Acoustic impedance<br />
(10 6 kg/m 2 s)<br />
13<br />
top Ek<strong>of</strong>isk<br />
top Tor<br />
base Chalk<br />
top Ek<strong>of</strong>isk<br />
top Tor<br />
base Chalk<br />
Well log<br />
AVO result<br />
A<br />
Two way time (s) Two way time (s)<br />
B<br />
NE<br />
Rigs-2<br />
SW<br />
2.7<br />
2.8<br />
5 6 7 8 9 10<br />
Acoustic impedance (10 6 kg/m 2 s)<br />
2.7<br />
2.8<br />
Fig. 5. Two-way time section with AVO<br />
<strong>in</strong>version <strong>of</strong> seismic data and <strong>in</strong>serted log<br />
response for the Rigs-2 well computed <strong>from</strong><br />
forward modell<strong>in</strong>g <strong>of</strong> the corrected MUHS<br />
model (Fig. 4). A: Acoustic impedance (density<br />
× Vp). B: Poisson ratio. Very good agreement<br />
is observed between AVO and log<br />
estimates for the acoustic impedance. Note<br />
the peaks <strong>in</strong> the tight zones near top Ek<strong>of</strong>isk<br />
Formation (top Chalk) and top Tor Formation.<br />
There is also good agreement between the log<br />
and AVO estimates <strong>of</strong> the Poisson ratio, e.g.<br />
the peak at top Tor Formation and the low<br />
values with<strong>in</strong> the Tor Formation. This pattern<br />
cannot be resolved by the log if the acoustic<br />
properties are estimated <strong>from</strong> the sonic log<br />
because the water saturation near the well<br />
bore is unknown. Seismic quality is severely<br />
reduced south-west <strong>of</strong> the well location due<br />
to an overly<strong>in</strong>g gas cap. Modified <strong>from</strong> Japsen<br />
et al. (2004).<br />
0.15 Poisson ratio 0.45<br />
(-)<br />
0.15 0.30 0.45<br />
Poisson ratio (-)<br />
Poisson ratio that correlates with the oil reservoir <strong>in</strong> the Tor<br />
Formation. In this way AVO <strong>in</strong>version provides direct evidence<br />
for the presence <strong>of</strong> oil <strong>in</strong> highly porous <strong>chalk</strong> <strong>of</strong> the<br />
South Arne field.<br />
References<br />
Bach, T., Espersen, T.B., Pedersen, J.M., Rasmussen, K.B., H<strong>in</strong>kley, R. &<br />
Pillet, R.P. 2003: Seismic <strong>in</strong>version <strong>of</strong> AVO data. In: Hansen, P.C., Jacobsen,<br />
B.H. & Mosegaard, K. (eds): Methods and applications <strong>of</strong> <strong>in</strong>version,<br />
31–42. Berl<strong>in</strong>: Spr<strong>in</strong>ger Verlag.<br />
Fabricius, I.L. 2003: How burial diagenesis <strong>of</strong> <strong>chalk</strong> sediments controls<br />
sonic velocity and porosity. American Association <strong>of</strong> Petroleum Geologist<br />
Bullet<strong>in</strong> 87, 1755–1778.<br />
Fabricius, I.L., Mavko, G., Mogensen, C. & Japsen, P. 2002: Elastic moduli<br />
<strong>of</strong> <strong>chalk</strong> as a reflection <strong>of</strong> porosity, sort<strong>in</strong>g and irreducible water<br />
saturation. Society <strong>of</strong> Exploration Geophysicists Technical Programme<br />
and Expanded Abstracts 21, 1903–1906.<br />
Gommesen, L. 2003: Prediction <strong>of</strong> porosity and fluid <strong>in</strong> <strong>chalk</strong> <strong>from</strong><br />
acoustic measurements, 94 pp. Ph.D. thesis. Lyngby: Technical<br />
University <strong>of</strong> Denmark.<br />
Jacobsen, N.L., Engstrøm, F., Uldall, A. & Petersen, N.W. 1999:<br />
Del<strong>in</strong>eation <strong>of</strong> hydrodynamic/geodynamic trapped oil <strong>in</strong> low permeability<br />
<strong>chalk</strong>. Society <strong>of</strong> Petroleum Eng<strong>in</strong>eers Paper 56514, 10 pp.<br />
Japsen, P., Bruun, A., Fabricius, I.L., Rasmussen, R., Vejbæk, O.V.,<br />
Pedersen, J.M., Mavko, G., Mogensen, C. & Høier, C. 2004: Influence<br />
<strong>of</strong> porosity and pore fluid on acoustic properties <strong>of</strong> <strong>chalk</strong>: AVOresponse<br />
<strong>from</strong> oil, South Arne Field, North Sea. Petroleum Geoscience<br />
10, 319–330.<br />
Land, C.S. 1968: Calculation <strong>of</strong> imbibition relative permeability for twoand<br />
three-phase flow <strong>from</strong> rock properties. Society <strong>of</strong> Petroleum<br />
Eng<strong>in</strong>eers Journal 1968, 149–156.<br />
Mavko, G., Mukerji, T. & Dvork<strong>in</strong>, J. 1998: The rock physics handbook,<br />
329 pp. Cambridge: Cambridge University Press.<br />
Megson, J.B. 1992: The North Sea <strong>chalk</strong> play; examples <strong>from</strong> the Danish<br />
Central Graben. In: Hardman, R.F.P. (ed.): Exploration Brita<strong>in</strong>:<br />
Geological <strong>in</strong>sights for the next decade. Geological Society Special<br />
Publication (London) 67, 247–282.<br />
Røgen, B. 2002: North Sea <strong>chalk</strong> – textural, petrophysical and acoustic<br />
properties, 106 pp. Ph.D. thesis. Lyngby: Technical University <strong>of</strong><br />
Denmark.<br />
Vejbæk, O.V. & Kristensen, L. 2000: Downflank hydrocarbon potential<br />
identified us<strong>in</strong>g seismic <strong>in</strong>version and geostatistics: Upper Maastrichtian<br />
reservoir unit, Dan Field, Danish Central Graben. Petroleum<br />
Geoscience 6, 1–13.<br />
Walls, J.D., Dvork<strong>in</strong>, J. & Smith, B.A. 1998: Model<strong>in</strong>g seismic velocity <strong>in</strong><br />
Ek<strong>of</strong>isk Chalk. Society <strong>of</strong> Exploration Geophysicists Technical Programme<br />
and Expanded Abstracts 17, 1016–1019.<br />
Authors’ addresses<br />
P.J., Geological Survey <strong>of</strong> Denmark and Greenland, Øster Voldgade 10, DK-1350 Copenhagen K, Denmark. E-mail: pj@geus.dk<br />
A.B., Ødegaard & Danneskiold-Samsøe A/S, Titangade 10, DK-2200 Copenhagen N, Denmark.<br />
I.L.F., Technical University <strong>of</strong> Denmark, Build<strong>in</strong>g 115, Anker Engelundsvej 1, DK-2800 Lyngby, Denmark.<br />
G.M., Stanford University, Stanford, California 94305-2215, USA.<br />
16