Geological Survey of Denmark and Greenland Bulletin 26 ... - GEUS
Geological Survey of Denmark and Greenland Bulletin 26 ... - GEUS
Geological Survey of Denmark and Greenland Bulletin 26 ... - GEUS

Create successful ePaper yourself
Turn your PDF publications into a flip-book with our unique Google optimized e-Paper software.
Testing <strong>of</strong> an automatic earthquake detection method<br />
on data from Station Nord, Greenl<strong>and</strong><br />
Nasim Karamzadeh, Peter H. Voss <strong>and</strong> Gholam D. Javan<br />
Earthquakes are continuously monitored by a global network<br />
<strong>of</strong> several thous<strong>and</strong> seismic stations equipped with<br />
highly sensitive digital seismometers. The <strong>Geological</strong> <strong>Survey</strong><br />
<strong>of</strong> <strong>Denmark</strong> <strong>and</strong> Greenl<strong>and</strong> (<strong>GEUS</strong>) takes part in it by operating<br />
five seismic stations in <strong>Denmark</strong> <strong>and</strong> 18 in Greenl<strong>and</strong>,<br />
some <strong>of</strong> the latter in collaboration with international partners.<br />
There are two main ways <strong>of</strong> detecting earthquakes from<br />
digital recordings <strong>of</strong> seismometers: (1) by a manual review <strong>of</strong><br />
the data by an expert in processing seismic earthquake signals<br />
<strong>and</strong> (2) by an automatic method that uses a computerised<br />
algorithm to analyse the recordings.<br />
Since the beginning <strong>of</strong> earthquake recording, earthquake<br />
detection at <strong>GEUS</strong> has been based on the manual review<br />
method. There are several reasons why an automatic detection<br />
procedure has not yet been implemented at <strong>GEUS</strong>: (1)<br />
historically, the staff at <strong>GEUS</strong> have conducted high-quality<br />
manual detection <strong>of</strong> earthquakes, based on a long tradition<br />
<strong>of</strong> manual seismogram analysis (Lehmann 1954), (2) the<br />
ambient noise level in <strong>Denmark</strong> is generally too high for<br />
small local earthquakes to be detected automatically <strong>and</strong> (3)<br />
in Greenl<strong>and</strong>, the distance between the seismometers is too<br />
long for automatic methods. Previous tests on <strong>GEUS</strong> data<br />
showed that automatic detection using the so-called st<strong>and</strong>ard<br />
method resulted in a very high number <strong>of</strong> false detections,<br />
<strong>and</strong> the effort needed to distinguish real earthquake signals<br />
from noise signals was much greater than that needed in the<br />
manual method. In addition, the automatic method detected<br />
fewer earthquakes than the manual analysis. Therefore, new<br />
automatic methods are needed to extract real earthquake signals<br />
from the background noise.<br />
In this article, we present results from testing a newly<br />
developed automatic detection method based on analysis<br />
<strong>of</strong> the frequency content <strong>of</strong> seismic signals. The aim <strong>of</strong> the<br />
study was to investigate whether the automated method can<br />
be used in Greenl<strong>and</strong> or whether the manual procedure is<br />
still superior. The new method was tested on seismic data<br />
from Station Nord, which was selected because it is located<br />
in a region with many earthquakes, <strong>and</strong> because there are no<br />
nearby seismograph stations to support the measurements.<br />
The closest station is located at Danmarkshavn c. 540 km to<br />
the south. Therefore, the majority <strong>of</strong> earthquakes that occur<br />
in this region are only registered at Station Nord.<br />
Earthquakes in the Station Nord region<br />
Station Nord is located in eastern North Greenl<strong>and</strong>, in a<br />
region where a major tectonic factor is the spreading that<br />
occurs along the rift zones in the northern North Atlantic<br />
<strong>and</strong> the Arctic Ocean (Døssing et al. 2010), <strong>and</strong> which gives<br />
rise to high seismic activity (Fig. 1). Another tectonic factor<br />
is postglacial isostatic rebound that was the source <strong>of</strong> three<br />
major earthquakes in 1971, 1987 <strong>and</strong> 1993 (Chung 2002),<br />
with magnitudes <strong>of</strong> 5.1, 5.5 <strong>and</strong> 5.4 on the Richter scale.<br />
Apart from the seismicity observed at the rift zone, most <strong>of</strong><br />
the earthquakes in the region occur to the south <strong>and</strong> west <strong>of</strong><br />
Station Nord (Fig. 1; Gregersen 1982). The earthquake hazard<br />
in the region is low, but represents the highest in Greenl<strong>and</strong><br />
(Voss et al. 2007). The hazard was illustrated by a strong<br />
tremor felt at Station Nord on 30 August 2005, caused by a<br />
magnitude 4.2 earthquake with an epicentre only 20 km away.<br />
Automatic earthquake detection<br />
The st<strong>and</strong>ard automatic earthquake detection method is<br />
known as the Short Term Average versus Long Term Average<br />
(STA/LTA) method (Havskov & Alguacil 2010). The<br />
basis <strong>of</strong> this method is two running time windows that both<br />
compute the average amplitude <strong>of</strong> the signal, one with a short<br />
84°N<br />
40°W 24°W 8°W 8°E<br />
Station<br />
Arctic Ocean<br />
Nord<br />
Magnitude<br />
(Richter scale)<br />
80°N 3<br />
2<br />
Rift zone<br />
1<br />
200 km<br />
Atlantic Ocean<br />
40°W 16°W 8°W<br />
Fig. 1. Map <strong>of</strong> the region between north-eastern Greenl<strong>and</strong> <strong>and</strong> Svalbard.<br />
Red dots: Epicentres located by <strong>GEUS</strong> using manual detection methods.<br />
Blue dots: Epicentres located using automatic detection method. Green<br />
dots: Located by both methods.<br />
0°<br />
© 2012 <strong>GEUS</strong>. <strong>Geological</strong> <strong>Survey</strong> <strong>of</strong> <strong>Denmark</strong> <strong>and</strong> Greenl<strong>and</strong> <strong>Bulletin</strong> <strong>26</strong>, 77–80. Open access: www.geus.dk/publications/bull<br />
77
Amp. (counts)<br />
Frequency (Hz)<br />
90<br />
50<br />
0<br />
0<br />
–50<br />
–100<br />
16<br />
14<br />
12<br />
10<br />
8<br />
6<br />
4<br />
2<br />
0<br />
Vertical component<br />
100 200 300 400 500 600 700 800 900 1000 1100 1200 1300 1400 1500 1600<br />
Time (sec.)<br />
0 100 200 300 400 500 600 700 800 900 1000 1100 1200 1300 1400 1500 1600<br />
Time (sec.)<br />
F = 16 Hz<br />
F = 14 Hz<br />
F = 12 Hz<br />
100<br />
50<br />
0<br />
100<br />
0<br />
100<br />
0<br />
F = 10 Hz 200<br />
F = 8 Hz<br />
F = 6 Hz<br />
F = 4 Hz<br />
F = 2 Hz<br />
0<br />
250<br />
0<br />
500<br />
0<br />
500<br />
0<br />
500<br />
0<br />
0 200 400 600 800 1000 1200 1400 1600<br />
Time (sec.)<br />
A<br />
B<br />
C<br />
60<br />
50<br />
40<br />
30<br />
20<br />
10<br />
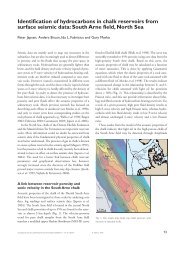
Fig. 2. A: Vertical component <strong>of</strong> a continuous<br />
seismogram, which included a signal from an<br />
earthquake <strong>and</strong> several short-duration, high-energy<br />
perturbations. B: Normalised spectrogram<br />
produced by short-time Fourier transformation<br />
for frequencies <strong>of</strong> 2–16 Hz with 2 Hz steps. The<br />
colours (scaled to use full colour spectrum) represent<br />
an estimate <strong>of</strong> the energy contained at the<br />
given frequency, within a short window (about<br />
0.6 s). At 800–900 s, when an earthquake signal<br />
appears in the seismogram, the colours on the<br />
spectrogram change, which indicates an order <strong>of</strong><br />
magnitude increase in the seismic energy over all<br />
frequencies. The detection <strong>of</strong> changes in energy<br />
over a proper range <strong>of</strong> frequencies, corresponding<br />
to the frequency content <strong>of</strong> the earthquake<br />
signals, led to the detection <strong>of</strong> an earthquake.<br />
Other increases in the energy level are seen at<br />
several other times, for example at 600–700 s.<br />
These peaks are only seen at low frequencies. C:<br />
Another representation <strong>of</strong> the same spectrogram<br />
showing the variation <strong>of</strong> local spectral energy<br />
for each frequency b<strong>and</strong> over time. A sharp<br />
increase is seen at the onset <strong>of</strong> the earthquake<br />
signal, whereas the perturbation <strong>of</strong> energy in<br />
the background noise has disappeared at higher<br />
frequency b<strong>and</strong>s.<br />
duration (STA) <strong>and</strong> the other with a long duration (LTA).<br />
The LTA represents the stable background noise level <strong>of</strong> the<br />
seismic signal, whereas the STA will increase rapidly at the<br />
onset <strong>of</strong> a seismic signal. The signal is <strong>of</strong>ten b<strong>and</strong> pass filtered<br />
to lower the ambient noise. The earthquake is detected when<br />
the STA/LTA exceeds a predefined threshold level (e.g. 10).<br />
The basic parameters required for this method are (1) the<br />
b<strong>and</strong> pass filter, (2) the duration <strong>of</strong> STA <strong>and</strong> LTA <strong>and</strong> (3) the<br />
STA/LTA threshold level. The disadvantage <strong>of</strong> this method<br />
is that it triggers with all ground shaking that exceeds the<br />
threshold level. So, if the STA/LTA threshold level is set low<br />
to detect small earthquakes, many detections that are nothing<br />
but noise or bogus events lead to much additional manual<br />
post-processing. A high number <strong>of</strong> noise detections can be<br />
avoided by setting the STA/LTA at a higher threshold level,<br />
but then important earthquakes may not be detected.<br />
In many seismic networks, automatic detection is operated<br />
with a low STA/LTA threshold level, but to avoid a lot<br />
<strong>of</strong> manual post-processing <strong>of</strong> detected signals, an additional<br />
criterion is applied before they are forwarded to manual processing.<br />
It states that the detection is only valid if the signal<br />
is also detected by a number <strong>of</strong> other seismic stations (e.g. 3)<br />
within a predefined time window; otherwise the detection is<br />
disregarded as being seismic noise. However, in order to use<br />
this criterion in the detection <strong>of</strong> small earthquakes, the network<br />
must include a large number <strong>of</strong> seismic stations located<br />
less than 100 km from each other. This is not the case in<br />
Greenl<strong>and</strong> where the distance between the stations is around<br />
300 km in western Greenl<strong>and</strong> <strong>and</strong> around 600 km in eastern<br />
Greenl<strong>and</strong>. Alternative methods are therefore required, <strong>and</strong><br />
we have chosen an automatic method based on analysis <strong>of</strong><br />
the short-time Fourier transform <strong>of</strong> the data. In addition to<br />
event detection, the automatic method also provides phase<br />
picks, magnitude measurements <strong>and</strong> azimuth estimates, but<br />
the primary aim <strong>of</strong> this study was to test the performance <strong>of</strong><br />
the automatic event detections.<br />
78
A spectrogram produced by short-time Fourier transform<br />
is a very useful tool in seismology because it can provide an<br />
image indicating the time at which a burst <strong>of</strong> energy occurs<br />
on a seismogram, in addition to the spectral composition <strong>of</strong><br />
the signal (Gibbons et al. 2008). The event detection algorithm<br />
used in this study inspects the temporal variation <strong>of</strong><br />
the signal spectrogram calculated in frequency b<strong>and</strong>s corresponding<br />
to the frequency content <strong>of</strong> local <strong>and</strong> regional<br />
earthquakes (e.g. 2–16 Hz). For detected events, the P- <strong>and</strong><br />
S-phases are picked. An example <strong>of</strong> a recorded seismogram<br />
with an earthquake signal <strong>and</strong> corresponding spectrogram<br />
is shown in Fig. 2 where an earthquake is observed on a seismogram<br />
at an approximate time <strong>of</strong> 800 s. Obvious changes<br />
in the colour <strong>of</strong> the spectrogram take place over a wide range<br />
<strong>of</strong> frequencies along the time axis, which indicate the arrivals<br />
<strong>of</strong> earthquake energy (Fig. 2B). Accordingly, the detection<br />
<strong>of</strong> a change in energy pattern over a pre-defined range <strong>of</strong><br />
frequencies, corresponding to the frequency content <strong>of</strong> the<br />
earthquake signals, leads to the detection <strong>of</strong> an earthquake.<br />
The plots presented in Fig. 2C show the variation <strong>of</strong> energy<br />
for each frequency b<strong>and</strong>, corresponding to the above spectrogram.<br />
These plots provide another representation <strong>of</strong> the<br />
spectrogram. The problem <strong>of</strong> detecting an earthquake on<br />
seismograms is now reduced to detecting sharp increases in<br />
the individual time series representing spectral energy versus<br />
time (the plot shown in Fig. 2C). To avoid false detections<br />
due to seismic noise with a frequency content overlapping<br />
the analysed frequencies, only detections made in most <strong>of</strong><br />
the frequency b<strong>and</strong>s are accepted. For instance, detections<br />
should be made at about the same time in at least five out <strong>of</strong><br />
eight frequency sub-b<strong>and</strong>s for a given spectrogram (Fig. 2B).<br />
Three missing detections are allowed, because this may happen<br />
for small events <strong>and</strong> noisy backgrounds, or low signal to<br />
noise ratio in some frequency b<strong>and</strong>s. To reduce the false detection<br />
rate, all three components (vertical, N–S <strong>and</strong> E–W)<br />
<strong>of</strong> the seismograms are used in the event detection procedure.<br />
Results<br />
To test the automatic detection method, Station Nord data<br />
from 6 July 2010 to 6 March 2011 were used. Prior to this<br />
period, the digitising unit <strong>of</strong> the seismometer had been upgraded<br />
to sample at 100 Hz. Earlier, the instrument had sampled<br />
at 20 Hz; this limits earthquake analysis to frequencies<br />
below 10 Hz, which the automatic method was not prepared<br />
for. Station Nord is equipped with a Streckeisen STS-2 sensor<br />
<strong>and</strong> a Quanterra Q330 digitiser. The automatic method<br />
analyses data from all three components <strong>of</strong> the sensor, using<br />
24 hour data files. The data are b<strong>and</strong> pass filtered between<br />
0.95 <strong>and</strong> 20 Hz before the detection algorithm is applied. The<br />
Plot start 10 Feb. 2011 4:52:15.000<br />
Vertical component<br />
North–south component<br />
East–west component<br />
Time (min.; UTC)<br />
04:53 04:54 04:55 04:56 04:57 04:58<br />
Plot start <strong>26</strong> Sep. 2010 10:15:59.320<br />
Vertical component<br />
Vertical component<br />
P<br />
S<br />
S<br />
P<br />
Duration<br />
Filter: 1–17 Hz<br />
Filter: 1–17 Hz<br />
Time (min.; UTC)<br />
10:17 10:18 10:19 10:20 10:21<br />
Filter: 2–9 Hz<br />
Fig. 3. A: Seismogram <strong>of</strong> a magnitude 2.2 earthquake filtered with a 1–17<br />
Hz b<strong>and</strong> pass filter containing the frequencies used for the automatic detection.<br />
The epicentre was located 354 km south-south-east <strong>of</strong> Station<br />
Nord. The automatic P-phase (P) was kept in the review, but the automatic<br />
S-phase (S) was repicked moving the epicentre 118 km. Automatic S pick<br />
is seen on the north–south channel, manual S pick is seen on the east–west<br />
channel <strong>and</strong> the automatic tremor duration is seen on the vertical channel.<br />
B: Vertical component <strong>of</strong> an earthquake not detected by the automatic<br />
method. Top trace: data with the 1–17 Hz filter used by the automatic<br />
method. Bottom trace: data with the 2–9 Hz filter used by the manual<br />
method. The earthquake had a magnitude <strong>of</strong> 1.1 <strong>and</strong> was located 234 km<br />
east-south-east <strong>of</strong> Station Nord. UTC: Universal Time, Coordinated.<br />
A<br />
B<br />
79
detections are stored in the international SEISAN format.<br />
During the test period, 156 detections were recorded with<br />
the automatic method. A review <strong>of</strong> these detections showed<br />
that 13 were due to sensor calibrations or sensor noise, <strong>and</strong> 52<br />
were caused by other noise signals such as man-made noise.<br />
The remaining 91 events were identified as earthquakes.<br />
To test the performance <strong>of</strong> the automatic method, the data<br />
were also analysed with the Rasmussen method, where data<br />
are manually scanned using predefined time windows <strong>and</strong> filters<br />
(Rasmussen & Voss 2011). During this manual scanning,<br />
the z-channel was checked in two-hourly windows using a<br />
2–9 Hz b<strong>and</strong> pass filter, the same filter that is used to analyse<br />
the data from the seismometer at Danmarkshavn in the daily<br />
processing at <strong>GEUS</strong>. The scanning found 229 earthquakes<br />
in the study period, approximately two <strong>and</strong> a half times more<br />
earthquakes than found by the automatic method. An example<br />
<strong>of</strong> an earthquake that was not detected by the automatic<br />
method is shown in Fig. 3B. Comparison <strong>of</strong> the lists<br />
<strong>of</strong> earthquakes detected by the two methods shows that the<br />
automatic detections do not give a full subset <strong>of</strong> the manual<br />
detections, as the automatic method detected <strong>26</strong> events that<br />
were not found by the manual method. A review <strong>of</strong> these <strong>26</strong><br />
earthquakes showed that 23 had a low signal to noise ratio in<br />
the frequency range <strong>of</strong> the b<strong>and</strong> pass filter (2–9 Hz) used <strong>and</strong><br />
three earthquakes were missed during the analysis.<br />
After the detection procedure, we processed the detected<br />
events. In this process, the arrival times <strong>of</strong> the P- <strong>and</strong> S-phases<br />
were picked <strong>and</strong> the magnitude <strong>of</strong> the signal determined.<br />
The automatic method picks P- <strong>and</strong> S-phases <strong>and</strong> uses the<br />
duration <strong>of</strong> the signal tremor to estimate the magnitude. We<br />
reviewed the 91 earthquakes detected <strong>and</strong> found that the automatic<br />
pick <strong>of</strong> the P- <strong>and</strong> S-phases should be adjusted for<br />
all earthquakes. Most <strong>of</strong> the adjustments were within a few<br />
seconds, but for seven <strong>of</strong> the events the automatic pick errors<br />
were several seconds. In many cases, the duration <strong>of</strong> the automatic<br />
signal located the end <strong>of</strong> the event in the last part <strong>of</strong> the<br />
S wave, but in some instances the end <strong>of</strong> the duration was in<br />
the end <strong>of</strong> the P wave. A similar approach was used by Agius<br />
& Galea (2011) with good results, but further improvement<br />
<strong>of</strong> the processing is required. Examples <strong>of</strong> the performance<br />
<strong>of</strong> the automatic method are shown on seismograms in Fig 3.<br />
Discussion <strong>and</strong> conclusions<br />
The manual detection method found two <strong>and</strong> a half times<br />
more events than the automatic detection method. Replacement<br />
<strong>of</strong> the manual method with the automatic detection <strong>of</strong><br />
earthquakes in Greenl<strong>and</strong> will therefore result in a significantly<br />
lower number <strong>of</strong> earthquake detections. The quality<br />
<strong>of</strong> earthquake risk evaluation depends on a high detection<br />
level; thus a lower number <strong>of</strong> detections will lead to a lower<br />
quality <strong>of</strong> an earthquake risk evaluation. The automatic<br />
method contributed with <strong>26</strong> (11%) additional events to the<br />
manual detections, <strong>and</strong> hence a combination <strong>of</strong> the two<br />
methods may increase the number <strong>of</strong> earthquakes detected<br />
in the region. In addition, the automatic method was effective<br />
in avoiding false detections.<br />
The automatic method gives earthquake locations <strong>and</strong><br />
magnitude estimates, based on automatic phase picks, phase<br />
polarisation <strong>and</strong> signal duration, but the quality <strong>of</strong> this information<br />
is poorer than that obtained by manual processing. A<br />
manual review <strong>of</strong> the data will still be an important part <strong>of</strong><br />
the quality control.<br />
Acknowledgements<br />
This study is part <strong>of</strong> a PhD project funded by the International Institute<br />
<strong>of</strong> Earthquake Engineering <strong>and</strong> Seismology for the first author, who was a<br />
visiting PhD student at <strong>GEUS</strong> in 2011. The Greenl<strong>and</strong> Ice Sheet Monitoring<br />
Network is thanked for upgrading Station Nord.<br />
References<br />
Agius, M.R. & Galea, P. 2011: A single-station automated earthquake location<br />
system at Wied Dalam Station, Malta. Seismological Research<br />
Letters 82, 545–559.<br />
Chung, W.-Y. 2002: Earthquakes along the passive margin <strong>of</strong> Greenl<strong>and</strong>:<br />
evidence for postglacial rebound control. Pure <strong>and</strong> Applied Geophysics<br />
159, 2567–2584.<br />
Døssing, A., Stemmerik, L., Dahl-Jensen, T. & Schlindwein, V. 2010: Segmentation<br />
<strong>of</strong> the eastern North Greenl<strong>and</strong> oblique-shear margin – regional<br />
plate tectonic implications. Earth <strong>and</strong> Planetary Science Letters<br />
292, 239–253.<br />
Gibbons, S. J., Ringdal, F. & Kværna, T. 2008: Detection <strong>and</strong> characterization<br />
<strong>of</strong> seismic phases using continuous spectral estimation on incoherent<br />
<strong>and</strong> partially coherent arrays. Geophysical Journal International<br />
172, 405–421.<br />
Gregersen, S. 1982: Seismicity <strong>and</strong> observations <strong>of</strong> Lg wave attenuation in<br />
Greenl<strong>and</strong>. Tectonophysics 89, 77–93.<br />
Havskov, J. & Alguacil, G. 2010: Instrumentation in earthquake seismology.<br />
Modern Approaches in Geophysics 22, 360 pp.<br />
Lehmann, I. 1954: Characteristic earthquake records. Geodætisk Instituts<br />
Skrifter III. Række 18, 33 pp.<br />
Rasmussen, H.P. & Voss, P.H. 2011: Detection <strong>of</strong> earthquakes at the <strong>Geological</strong><br />
<strong>Survey</strong> <strong>of</strong> <strong>Denmark</strong> <strong>and</strong> Greenl<strong>and</strong> – <strong>GEUS</strong>. 42nd Nordic Seminar<br />
on Detection Seismology, Reykjavik, 5–7 October 2011. Icel<strong>and</strong>ic<br />
Meteorological Office, programme <strong>and</strong> abstracts, 41 only.<br />
Voss, P., Poulsen, S.K., Simonson, S.B. & Gregersen, S. 2007: Seismic<br />
hazard assessment <strong>of</strong> Greenl<strong>and</strong>. <strong>Geological</strong> <strong>Survey</strong> <strong>of</strong> <strong>Denmark</strong> <strong>and</strong><br />
Greenl<strong>and</strong> <strong>Bulletin</strong> 13, 57–60.<br />
Authors’ addresses<br />
N.K. & G.D.J., International Institute <strong>of</strong> Earthquake Engineering <strong>and</strong> Seismology, Arghavan St. 21, North Dibajee, Farmanieh Tehran 3913/19395<br />
Islamic Republic <strong>of</strong> Iran. E-mail: n.karamzadeh@iiees.ac.ir<br />
P.H.V., <strong>Geological</strong> <strong>Survey</strong> <strong>of</strong> <strong>Denmark</strong> <strong>and</strong> Greenl<strong>and</strong>, Øster Voldgade 10, DK-1350 Copenhagen K, <strong>Denmark</strong>.<br />
80