Create successful ePaper yourself
Turn your PDF publications into a flip-book with our unique Google optimized e-Paper software.
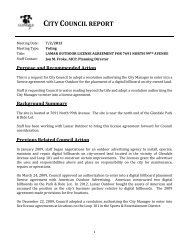
Jobing.com Arena Confidential Negotiations<br />
MEMORANDUM<br />
To:<br />
From:<br />
Ed Beasley<br />
<strong>City</strong> Manager, <strong>City</strong> <strong>of</strong> <strong>Glendale</strong><br />
Elliott <strong>Pollack</strong><br />
Chief Executive Officer, Elliott D. <strong>Pollack</strong> & Company<br />
Date: May 31, 2012<br />
Re:<br />
Analysis and Comparison <strong>of</strong> the Phoenix Coyotes and Jobing.com Arena<br />
Confidential Negotiations<br />
Elliott D. <strong>Pollack</strong> & Company was asked by the <strong>City</strong> <strong>of</strong> <strong>Glendale</strong> to analyze two proposals related to the<br />
operations and sale <strong>of</strong> Jobing.com Arena. The two proposals will be referred to in this memo as “Arizona<br />
Hockey” and “No Team”.<br />
Total Costs<br />
• Regardless <strong>of</strong> the discount rate and assumptions used, the Arizona Hockey proposal produced<br />
lower costs for the <strong>City</strong> <strong>of</strong> <strong>Glendale</strong> than if the Coyotes moved from <strong>Glendale</strong> and left the arena<br />
without a hockey team. The Arizona Hockey proposal is also more advantageous to the <strong>City</strong> than<br />
other proposals considered over the past year. The reasons for this conclusion are:<br />
o The cost to operate the arena without a team is estimated to total between $12 and $19<br />
million per year for the next 20 years with an average <strong>of</strong> $15.3 million each year. The<br />
cost to operate the arena without a team for the next 20 years is estimated to total $315.2<br />
million. With a 6.5% discount rate, the present value <strong>of</strong> the 20 year net cost is $176.6<br />
million.<br />
o In the Arizona Hockey proposal, rent payable to the <strong>City</strong> begins immediately and at<br />
higher levels than previous proposals.<br />
o In the Arizona Hockey proposal, arena management fees are substantially lower than the<br />
previous proposals.<br />
o The Arizona Hockey proposal includes annual revenues for the <strong>City</strong> from arena naming<br />
rights that are not included in competing proposals.<br />
• On a net present value basis and a 6.5% discount rate, the Arizona Hockey proposal costs the <strong>City</strong><br />
approximately $17.8 million less over 20 years than if the team vacates the arena and moves from<br />
<strong>Glendale</strong>. The net payment made by the <strong>City</strong> <strong>of</strong> <strong>Glendale</strong> is estimated to total $324 million.<br />
With a present value and 6.5% discount rate, payments by the <strong>City</strong> should be $203.7 million. The<br />
<strong>City</strong>’s estimated revenues over the 20 year period total $79.5 million. With present value and a<br />
6.5% discount rate, the revenues compute to $44.9 million for the duration <strong>of</strong> the 20 year deal.<br />
• Arizona Hockey’s average annual cost to the <strong>City</strong> using a 6.5% discount rate is $7.9 million.<br />
The average annual cost to the <strong>City</strong> if the team vacates the arena is $8.8 million.<br />
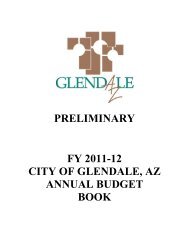
The worst <strong>of</strong> all possible scenarios for <strong>Glendale</strong> would be for the hockey team to leave. The<br />
viability <strong>of</strong> Westgate rests on the use <strong>of</strong> the Arena for hockey events, which represent 59% <strong>of</strong><br />
total events at the facility today. The loss <strong>of</strong> the team would have harmful effects on the retail<br />
and restaurant uses which depend on game day revenues to sustain their operations during nonevent<br />
times. The Renaissance <strong>Glendale</strong> Hotel & Spa and the smaller Hampton Inn would suffer<br />
as well. The ten NFL games held at the University <strong>of</strong> Phoenix Stadium are not enough to sustain
Jobing.com Arena Confidential Negotiations<br />
the entertainment venues. Ultimately, the loss <strong>of</strong> the team could lead to significant retail and<br />
restaurant vacancies in the Entertainment Center. These effects would spill over to the <strong>of</strong>fice<br />
uses and potentially the residential portion <strong>of</strong> the project as well. If the team leaves, it is unlikely<br />
that other events could completely fill the void.<br />
At the present time, the Arena is used 76 days <strong>of</strong> the year. The Arena already has excess<br />
capacity. Adding to that excess capacity would not help generate demand to the area. Thus, if<br />
the team leaves, retail revenues produced by the project would decline, as would property values<br />
and taxes. The <strong>City</strong> would still be obligated for the existing bond costs. The net effect on the<br />
<strong>City</strong> would be significantly negative.<br />
Jobing.com Arena Event Days<br />
Distribution by Type <strong>of</strong> Event<br />
2009-2011<br />
Non-Hockey Events Hockey Events Total Event<br />
Year Number Percent Number Percent Days<br />
2009 60 56% 48 44% 108<br />
2010 28 39% 44 61% 72<br />
2011 31 41% 45 59% 76<br />
Average 40 46% 46 54% 85<br />
*Source: <strong>City</strong> <strong>of</strong> <strong>Glendale</strong><br />
Finally, there is a certain status associated with an arena that is home to a pr<strong>of</strong>essional sports<br />
team. This noteworthy standing in the community and sports world would be lost and would be<br />
difficult, if not impossible, to recapture at a later time.
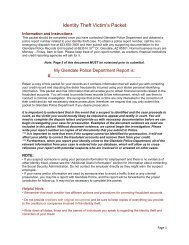
Jobing.com Arena Analysis<br />
Arizona Hockey Deal v. No Team Present<br />
Gross Amount<br />
Present Value Amount<br />
Net Payments Made By <strong>City</strong> <strong>of</strong> <strong>Glendale</strong> $324,000,000 $203,708,341<br />
Net Payments Made To <strong>City</strong> <strong>of</strong> <strong>Glendale</strong> $79,452,352 $44,911,739<br />
Difference ($244,547,648) ($158,796,601)<br />
Net Loss <strong>of</strong> <strong>City</strong> if NO TEAM Present ($315,171,271) ($176,561,515)
CURRENT DEAL::ARIZONA HOCKEY<br />
<strong>City</strong> Payments to Team Team Payments to <strong>City</strong> Differences<br />
Year<br />
Fiscal Year<br />
Arena<br />
Management<br />
Fees<br />
Capital Repair/<br />
Enhancement<br />
Total <strong>City</strong><br />
Payments<br />
Ticket Surcharge - All Events<br />
Net Present<br />
Value Rent Rate<br />
Total<br />
Attendance Amount<br />
Arena<br />
Naming<br />
Rights<br />
Total Team<br />
Payments<br />
Net Present<br />
Value Annual Amount<br />
Net Present<br />
Value<br />
6.50% 15.0% 6.50% 6.50%<br />
1 2013 $17,000,000 $1,000,000 $18,000,000 $18,000,000 $500,000 $2.75 886,460 $2,437,765 $375,000 $3,312,765 $3,312,765 ($14,687,235) ($14,687,235)<br />
2 2014 20,000,000 1,000,000 21,000,000 19,718,310 500,000 $2.75 895,325 2,462,143 375,000 3,337,143 3,133,467 ($17,662,857) (16,584,843)<br />
3 2015 20,000,000 1,000,000 21,000,000 18,514,845 500,000 $2.75 904,278 2,486,764 375,000 3,361,764 2,963,931 ($17,638,236) (15,550,914)<br />
4 2016 20,000,000 2,000,000 22,000,000 18,212,680 500,000 $2.75 913,321 2,511,632 375,000 3,386,632 2,803,620 ($18,613,368) (15,409,060)<br />
5 2017 18,000,000 1,000,000 19,000,000 14,769,139 500,000 $2.75 922,454 2,536,748 412,500 3,449,248 2,681,180 ($15,550,752) (12,087,959)<br />
6 2018 18,000,000 1,000,000 19,000,000 13,867,736 500,000 $3.00 931,678 2,795,035 412,500 3,707,535 2,706,059 ($15,292,465) (11,161,677)<br />
7 2019 18,000,000 2,000,000 20,000,000 13,706,682 650,000 $3.00 940,995 2,822,985 412,500 3,885,485 2,662,856 ($16,114,515) (11,043,827)<br />
8 2020 16,000,000 1,000,000 17,000,000 10,939,606 650,000 $3.00 950,405 2,851,215 412,500 3,913,715 2,518,500 ($13,086,285) (8,421,106)<br />
9 2021 16,000,000 1,000,000 17,000,000 10,271,930 650,000 $3.00 959,909 2,879,727 412,500 3,942,227 2,382,017 ($13,057,773) (7,889,913)<br />
10 2022 16,000,000 1,000,000 17,000,000 9,645,005 650,000 $3.00 969,508 2,908,525 453,750 4,012,275 2,276,377 ($12,987,725) (7,368,628)<br />
11 2023 16,000,000 2,000,000 18,000,000 9,589,069 650,000 $3.00 979,203 2,937,610 453,750 4,041,360 2,152,938 ($13,958,640) (7,436,131)<br />
12 2024 15,000,000 1,000,000 16,000,000 8,003,396 650,000 $3.00 988,995 2,966,986 453,750 4,070,736 2,036,232 ($11,929,264) (5,967,164)<br />
13 2025 15,000,000 1,000,000 16,000,000 7,514,926 650,000 $3.00 998,885 2,996,656 453,750 4,100,406 1,925,890 ($11,899,594) (5,589,035)<br />
14 2026 15,000,000 1,000,000 16,000,000 7,056,268 800,000 $3.00 1,008,874 3,026,623 453,750 4,280,373 1,887,716 ($11,719,627) (5,168,552)<br />
15 2027 10,000,000 2,000,000 12,000,000 4,969,203 800,000 $3.00 1,018,963 3,056,889 499,125 4,356,014 1,803,826 ($7,643,986) (3,165,377)<br />
16 2028 10,000,000 1,000,000 11,000,000 4,277,092 800,000 $3.00 1,029,153 3,087,458 499,125 4,386,583 1,705,620 ($6,613,417) (2,571,472)<br />
17 2029 10,000,000 1,000,000 11,000,000 4,016,049 800,000 $3.00 1,039,444 3,118,332 499,125 4,417,457 1,612,793 ($6,582,543) (2,403,256)<br />
18 2030 10,000,000 1,000,000 11,000,000 3,770,938 800,000 $3.00 1,049,839 3,149,516 499,125 4,448,641 1,525,050 ($6,551,359) (2,245,888)<br />
19 2031 10,000,000 1,000,000 11,000,000 3,540,787 800,000 $3.00 1,060,337 3,181,011 499,125 4,480,136 1,442,109 ($6,519,864) (2,098,677)<br />
20 2032 10,000,000 1,000,000 11,000,000 3,324,682 800,000 $3.00 1,070,940 3,212,821 549,038 4,561,858 1,378,794 ($6,438,142) (1,945,889)<br />
21 2033 0 0 0 0 0 $0.00 0 0 0 0 0 $0 0<br />
Totals $300,000,000 $24,000,000 $324,000,000 $203,708,341 $13,150,000 $19,518,966 $57,426,440 $8,875,913 $79,452,352 $44,911,739 ($244,547,648) ($158,796,601)<br />
Averages $15,000,000 $1,200,000 $16,200,000 $10,185,417 $657,500 $975,948 $2,871,322 $443,796 $3,972,618 $2,245,587 ($12,227,382) ($7,939,830)
OPERATING COSTS FOR CITY OF GLENDALE WITH NO TEAM PRESENT<br />
NET EXPENSES<br />
NET REVENUES<br />
Average Estimated Costs Annual Repair Expenses Major Capital Expenses Net Expenses<br />
Surcharge Revenues<br />
Difference<br />
Fiscal<br />
Year<br />
Arena<br />
Management<br />
Fees<br />
Net Present<br />
Value<br />
Repair &<br />
Replacement<br />
Expenses<br />
Net Present<br />
Value<br />
Capital<br />
Expenses<br />
Net Present<br />
Value<br />
Gross<br />
Amount<br />
Net Present<br />
Value<br />
Revenues on<br />
Non Hockey<br />
Events<br />
Net Present<br />
Value<br />
Net Present<br />
Value<br />
Year<br />
Gross Amount<br />
6.5% 6.5% 6.5% 6.5% 6.5%<br />
1 2013 $12,000,000 $12,000,000 $500,000 $500,000 $1,000,000 $1,000,000 $13,500,000 $13,500,000 $1,089,880 $1,089,880 ($12,410,120) ($12,410,120)<br />
2 2014 12,300,000 11,549,296 512,500 481,221 1,000,000 938,967 13,812,500 12,969,484 1,120,091 1,051,728 (12,692,409) (11,917,755)<br />
3 2015 12,607,500 11,115,519 525,313 463,147 1,000,000 881,659 14,132,813 12,460,325 1,150,797 1,014,610 (12,982,016) (11,445,715)<br />
4 2016 12,922,688 10,698,035 538,445 445,751 2,000,000 1,655,698 15,461,133 12,799,485 1,182,005 978,521 (14,279,128) (11,820,963)<br />
5 2017 13,245,755 10,296,231 551,906 429,010 1,000,000 777,323 14,797,661 11,502,564 1,213,722 943,454 (13,583,939) (10,559,110)<br />
6 2018 13,576,899 9,909,518 565,704 412,897 1,000,000 729,881 15,142,603 11,052,295 1,245,955 909,399 (13,896,648) (10,142,897)<br />
7 2019 13,916,321 9,537,330 579,847 397,389 2,000,000 1,370,668 16,496,168 11,305,387 1,278,712 876,345 (15,217,456) (10,429,042)<br />
8 2020 14,264,229 9,179,120 594,343 382,463 1,000,000 643,506 15,858,572 10,205,090 1,311,999 844,279 (14,546,573) (9,360,810)<br />
9 2021 14,620,835 8,834,364 609,201 368,099 1,000,000 604,231 16,230,036 9,806,694 1,345,824 813,189 (14,884,213) (8,993,505)<br />
10 2022 14,986,356 8,502,557 624,431 354,273 1,000,000 567,353 16,610,787 9,424,184 1,380,194 783,057 (15,230,593) (8,641,126)<br />
11 2023 15,361,015 8,183,212 640,042 340,967 2,000,000 1,065,452 18,001,057 9,589,632 1,415,117 753,870 (16,585,940) (8,835,762)<br />
12 2024 15,745,040 7,875,862 656,043 328,161 1,000,000 500,212 17,401,083 8,704,235 1,450,600 725,608 (15,950,483) (7,978,627)<br />
13 2025 16,138,666 7,580,055 672,444 315,836 1,000,000 469,683 17,811,110 8,365,573 1,486,652 698,255 (16,324,458) (7,667,318)<br />
14 2026 16,542,133 7,295,358 689,256 303,973 1,000,000 441,017 18,231,388 8,040,348 1,523,280 671,792 (16,708,108) (7,368,556)<br />
15 2027 16,955,686 7,021,354 706,487 292,556 2,000,000 828,200 19,662,173 8,142,111 1,560,491 646,200 (18,101,681) (7,495,911)<br />
16 2028 17,379,578 6,757,641 724,149 281,568 1,000,000 388,827 19,103,727 7,428,036 1,598,295 621,459 (17,505,432) (6,806,576)<br />
17 2029 17,814,067 6,503,833 742,253 270,993 1,000,000 365,095 19,556,320 7,139,921 1,636,698 597,551 (17,919,622) (6,542,370)<br />
18 2030 18,259,419 6,259,557 760,809 260,815 1,000,000 342,813 20,020,228 6,863,185 1,675,710 574,454 (18,344,518) (6,288,730)<br />
19 2031 18,715,905 6,024,457 779,829 251,019 1,000,000 321,890 20,495,734 6,597,365 1,715,338 552,150 (18,780,396) (6,045,216)<br />
20 2032 19,183,802 5,798,186 799,325 241,591 1,000,000 302,244 20,983,127 6,342,021 1,755,592 530,617 (19,227,536) (5,811,404)<br />
21 2033 0 0 0 0 0 0 0 0 0 0 0 0<br />
Totals $306,535,891 170,921,485 $12,772,329 $7,121,729 $24,000,000 $14,194,720 $343,308,220 $192,237,933 $28,136,950 $15,676,418 ($315,171,271) ($176,561,515)<br />
Averages $15,326,795 $8,546,074 $638,616 $356,086 $1,200,000 $709,736 $17,165,411 $9,611,897 $1,406,847 $783,821 ($15,758,564) ($8,828,076)