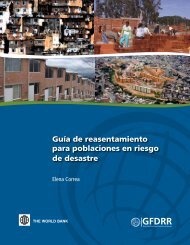
Preventive Resettlement of Populations at Risk of Disaster - GFDRR
Preventive Resettlement of Populations at Risk of Disaster - GFDRR
Preventive Resettlement of Populations at Risk of Disaster - GFDRR
You also want an ePaper? Increase the reach of your titles
YUMPU automatically turns print PDFs into web optimized ePapers that Google loves.
Figure 3.5. Houses Built by Province .............................................................................................................. 38<br />
Figure 3.6. Amounts Invested in each PPI Province .................................................................................... 39<br />
Figure 4.1. Percentage <strong>of</strong> Rural and Urban Popul<strong>at</strong>ion ............................................................................... 43<br />
Figure 5.1. Percentage <strong>of</strong> Rural and Urban Popul<strong>at</strong>ion ............................................................................... 59<br />
Figure 5.2. Percentage Distribution <strong>of</strong> N<strong>at</strong>ural Events in Colombia (1998-2008) .................................... 60<br />
Figure 5.3. Organiz<strong>at</strong>ional Chart <strong>of</strong> the District Emergency Prevention and Relief System (SDPAE) . 64<br />
Figure 5.4. Types <strong>of</strong> Houses ............................................................................................................................. 71<br />
Figure 6.1. Percentage <strong>of</strong> Rural and Urban Popul<strong>at</strong>ion .............................................................................. 85<br />
Figure 6.2. N<strong>at</strong>ional Council for <strong>Disaster</strong> Reduction (CONRED) ............................................................. 89<br />
Figure 6.3. The Chuk Muk <strong>Resettlement</strong> Site ................................................................................................ 100<br />
Tables<br />
Table 1.1. Occurrence <strong>of</strong> <strong>Disaster</strong>s Worldwide by Decade and Type <strong>of</strong> Hazard (1970-2009) ............... 3<br />
Table 1.2. Occurrence <strong>of</strong> <strong>Disaster</strong>s by Decade and Type <strong>of</strong> Hazard in Lac (1970-2009) ..................... 7<br />
Table 1.3. Top 10 Lethal <strong>Disaster</strong>s in Lac (1970-2009) .............................................................................. 8<br />
Table 1.4. Indic<strong>at</strong>ors <strong>of</strong> Reducing Underlying <strong>Risk</strong> Factors ....................................................................... 15<br />
Table 2.1. Savings Achieved by <strong>Preventive</strong> <strong>Resettlement</strong> vis-à-vis the Potential Costs <strong>of</strong><br />
Post-disaster Reconstruction......................................................................................................... 20<br />
Table 3.1. Urban and Rural Popul<strong>at</strong>ion and Nbi ........................................................................................ 26<br />
Table 3.2. Principal Floods in The Provinces <strong>of</strong> the La Pl<strong>at</strong>a River Basin and the Associ<strong>at</strong>ed<br />
Losses (1982-1998) .......................................................................................................................... 27<br />
Table 3.3. Flood <strong>Risk</strong>-reduction Programs and Housing Subprograms ................................................ 30<br />
Table 3.4. Number <strong>of</strong> Houses Built in each Program ................................................................................. 31<br />
Table 3.5. Agreements and Responsibilities <strong>of</strong> the Parties Involved ........................................................ 33<br />
Table 4.1. Number <strong>of</strong> N<strong>at</strong>ural <strong>Disaster</strong>s by Type and Region (2008) ....................................................... 44<br />
Table 4.2. Number <strong>of</strong> Municipalities with Cities with <strong>Risk</strong>-prone Areas ............................................... 44<br />
Table 4.3. Number <strong>of</strong> Municipalities with Inefficient Drainage Systems ................................................ 45<br />
Table 4.4. Popul<strong>at</strong>ion in Favelas in the City <strong>of</strong> São Paulo (1970-2008) .................................................... 46<br />
Table 4.5. Number <strong>of</strong> Families Resettled during the Stream Canaliz<strong>at</strong>ion Program ........................... 48<br />
Table 4.6. Overall Plan for <strong>Resettlement</strong> in Housing Complexes – Budget US$ .................................... 53<br />
Table 4.7. PROCAV Ii Objectives ................................................................................................................. 54<br />
Table 5.1. Effects <strong>of</strong> the Five Severe N<strong>at</strong>ural <strong>Disaster</strong>s ............................................................................... 61<br />
Table 5.2. <strong>Disaster</strong> <strong>Risk</strong> Management Instruments .................................................................................... 65<br />
Table 5.3. Particip<strong>at</strong>ion <strong>of</strong> Capital District Entities, by Str<strong>at</strong>egy, Program and Project ........................ 69<br />
Table 5.4. Appraised Value <strong>of</strong> the High-risk Houses .................................................................................. 69<br />
Table 5.5. Social And Cultural Impacts <strong>of</strong> <strong>Resettlement</strong> ............................................................................ 72<br />
Table 5.6. Institutional Responsibilities in the <strong>Resettlement</strong> Process ..................................................... 72<br />
Table 5.7. Housing Options Selected ............................................................................................................ 76<br />
Table 5.8. Total Cost <strong>of</strong> <strong>Resettlement</strong> ............................................................................................................ 79<br />
Table 5.9. Main Challenges and Solutions .................................................................................................... 80<br />
Table 6.1. Record <strong>of</strong> High-impact N<strong>at</strong>ural <strong>Disaster</strong>s until 2008 ............................................................... 87<br />
viii<br />
<strong>Preventive</strong> <strong>Resettlement</strong> <strong>of</strong> <strong>Popul<strong>at</strong>ions</strong> <strong>at</strong> <strong>Risk</strong> <strong>of</strong> <strong>Disaster</strong>: Experiences from L<strong>at</strong>in America


