Annual report 2001 - GL events
Annual report 2001 - GL events Annual report 2001 - GL events
4 Consolidated cash flow : Since 2000 cash flow is presented in compliance with the new methodology and includes the following rules : • Capital gains and losses as a result of disposals are shown net of tax. Provisions against accounts receivable included within the variation of cash flows relative to accounts receivable. “Net cash flow from acquisitions” corresponds to : • the price of acquisition, • less part of the price not yet paid, • less the available net cash flow (or plus the current cash flow still due) at the time of the acquisition. • For all disinvesting activities the logic retained is identical. • The lines “Cash and cash equivalents at the beginning of the year” and “Cash and cash equivalents at year-end” relate to positive cash (bank, short-term investment ) less discounted notes not yet due (off balance sheet items). They do not include the current accounts with the nonconsolidated companies. Note 3 Goodwill 2000 Mvts/Scope. Increase Decrease Other mvts 2001 K€ K€ K€ K€ K€ K€ Goodwill 60 785 9 758 571 7 (249) 70 859 Amortization and provisions (81) (81) Net total 60 785 9 677 571 7 (249) 70 778 At 31 December 2001, the item “Goodwill” can be broken down as follows : K€ Goodwill included in the individual company financial statements 6 597 Valuation differences allocated to goodwill 64 181 Net total 70 778
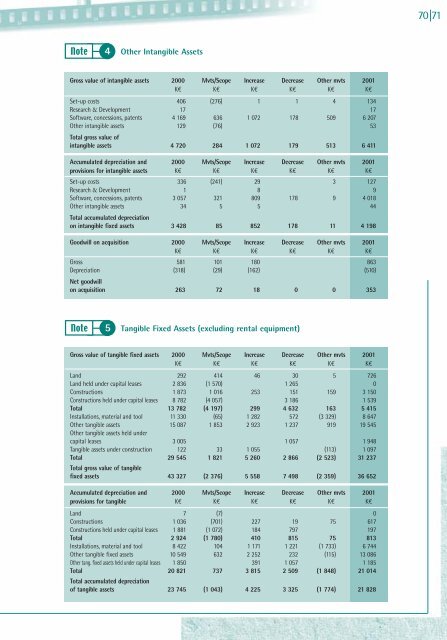
70 71 Note 4 Other Intangible Assets Gross value of intangible assets 2000 Mvts/Scope Increase Decrease Other mvts 2001 K€ K€ K€ K€ K€ K€ Set-up costs 406 (276) 1 1 4 134 Research & Development 17 17 Software, concessions, patents 4 169 636 1 072 178 509 6 207 Other intangible assets 129 (76) 53 Total gross value of intangible assets 4 720 284 1 072 179 513 6 411 Accumulated depreciation and 2000 Mvts/Scope Increase Decrease Other mvts 2001 provisions for intangible assets K€ K€ K€ K€ K€ K€ Set-up costs 336 (241) 29 3 127 Research & Development 1 8 9 Software, concessions, patents 3 057 321 809 178 9 4 018 Other intangible assets 34 5 5 44 Total accumulated depreciation on intangible fixed assets 3 428 85 852 178 11 4 198 Goodwill on acquisition 2000 Mvts/Scope Increase Decrease Other mvts 2001 K€ K€ K€ K€ K€ K€ Gross 581 101 180 863 Depreciation (318) (29) (162) (510) Net goodwill on acquisition 263 72 18 0 0 353 Note 5 Tangible Fixed Assets (excluding rental equipment) Gross value of tangible fixed assets 2000 Mvts/Scope Increase Decrease Other mvts 2001 K€ K€ K€ K€ K€ K€ Land 292 414 46 30 5 726 Land held under capital leases 2 836 (1 570) 1 265 0 Constructions 1 873 1 016 253 151 159 3 150 Constructions held under capital leases 8 782 (4 057) 3 186 1 539 Total 13 782 (4 197) 299 4 632 163 5 415 Installations, material and tool 11 330 (65) 1 282 572 (3 329) 8 647 Other tangible assets 15 087 1 853 2 923 1 237 919 19 545 Other tangible assets held under capital leases 3 005 1 057 1 948 Tangible assets under construction 122 33 1 055 (113) 1 097 Total 29 545 1 821 5 260 2 866 (2 523) 31 237 Total gross value of tangible fixed assets 43 327 (2 376) 5 558 7 498 (2 359) 36 652 Accumulated depreciation and 2000 Mvts/Scope Increase Decrease Other mvts 2001 provisions for tangible K€ K€ K€ K€ K€ K€ Land 7 (7) 0 Constructions 1 036 (701) 227 19 75 617 Constructions held under capital leases 1 881 (1 072) 184 797 197 Total 2 924 (1 780) 410 815 75 813 Installations, material and tool 8 422 104 1 171 1 221 (1 733) 6 744 Other tangible fixed assets 10 549 632 2 252 232 (115) 13 086 Other tang. fixed assets held under capital leases 1 850 391 1 057 1 185 Total 20 821 737 3 815 2 509 (1 848) 21 014 Total accumulated depreciation of tangible assets 23 745 (1 043) 4 225 3 325 (1 774) 21 828
- Page 22 and 23: Board of Directors Chairman - Chief
- Page 24 and 25: 1 1. Person responsible for the ref
- Page 26 and 27: 2 General Information regarding Gé
- Page 28 and 29: 2 General Information regarding Gé
- Page 30 and 31: 2 Evolution of the capital of Gén
- Page 32 and 33: 2 Thresholds crossing Due to the pr
- Page 34 and 35: 2 2-5 Financial communication Press
- Page 36 and 37: 3 1989 Alliance between the Group P
- Page 38 and 39: 3 3-3-4 Venue management This marke
- Page 40 and 41: 3 3-4-1-1 Role played by Générale
- Page 42 and 43: 3 Other services The Group offers o
- Page 44 and 45: 3 3-5-3 Risk linked to the activity
- Page 46 and 47: 3 3-7-2 Venue management The distin
- Page 48 and 49: 4 Evolution by market In 2001, the
- Page 50 and 51: 4 b - Operating profit Expressed as
- Page 52 and 53: 4 ● PACKAGE ORGANISATION PACKAGE
- Page 54 and 55: 4 ● DECORAMA DECORAMA (M€) 2001
- Page 56 and 57: 4 c - Future Prospects Générale L
- Page 58 and 59: 4 4-1-2 Five year financial summary
- Page 61 and 62: 58 59 4-2 Consolidated Financial St
- Page 63 and 64: 60 61 4-2-2 Consolidated Balance Sh
- Page 65 and 66: 62 63 4-2-4 Notes to the consolidat
- Page 67 and 68: 64 65 2-2-2 Consolidation scope The
- Page 69 and 70: 66 67 Tangible fixed assets Tangibl
- Page 71: 68 69 Net sales For shows, fairs, a
- Page 75 and 76: 72 73 Note 8 Rental Equipment Gross
- Page 77 and 78: 74 75 Breakdown of the corporate Ta
- Page 79 and 80: 76 77 The Mixed Annual General Meet
- Page 81 and 82: 78 79 Note 18 Loans and Debts The d
- Page 83 and 84: 80 81 The breakdown of charges for
- Page 85 and 86: 82 83 The analysis of the Exception
- Page 87 and 88: 84 85 Note 28 Other Risks Foreign C
- Page 89 and 90: 86 87 Scope of consolidation Compan
- Page 91 and 92: 88 89 4-6 Draft of proposed resolut
- Page 93 and 94: 90 91 will have to resign at the en
- Page 95 and 96: 5 Organs of administration, directi
- Page 97 and 98: 94 95 5-1-3 Board of Directors and
- Page 99 and 100: 96 97 5-3 Personnel profit sharing
70 71<br />
Note 4<br />
Other Intangible Assets<br />
Gross value of intangible assets 2000 Mvts/Scope Increase Decrease Other mvts <strong>2001</strong><br />
K€ K€ K€ K€ K€ K€<br />
Set-up costs 406 (276) 1 1 4 134<br />
Research & Development 17 17<br />
Software, concessions, patents 4 169 636 1 072 178 509 6 207<br />
Other intangible assets 129 (76) 53<br />
Total gross value of<br />
intangible assets 4 720 284 1 072 179 513 6 411<br />
Accumulated depreciation and 2000 Mvts/Scope Increase Decrease Other mvts <strong>2001</strong><br />
provisions for intangible assets K€ K€ K€ K€ K€ K€<br />
Set-up costs 336 (241) 29 3 127<br />
Research & Development 1 8 9<br />
Software, concessions, patents 3 057 321 809 178 9 4 018<br />
Other intangible assets 34 5 5 44<br />
Total accumulated depreciation<br />
on intangible fixed assets 3 428 85 852 178 11 4 198<br />
Goodwill on acquisition 2000 Mvts/Scope Increase Decrease Other mvts <strong>2001</strong><br />
K€ K€ K€ K€ K€ K€<br />
Gross 581 101 180 863<br />
Depreciation (318) (29) (162) (510)<br />
Net goodwill<br />
on acquisition 263 72 18 0 0 353<br />
Note 5<br />
Tangible Fixed Assets (excluding rental equipment)<br />
Gross value of tangible fixed assets 2000 Mvts/Scope Increase Decrease Other mvts <strong>2001</strong><br />
K€ K€ K€ K€ K€ K€<br />
Land 292 414 46 30 5 726<br />
Land held under capital leases 2 836 (1 570) 1 265 0<br />
Constructions 1 873 1 016 253 151 159 3 150<br />
Constructions held under capital leases 8 782 (4 057) 3 186 1 539<br />
Total 13 782 (4 197) 299 4 632 163 5 415<br />
Installations, material and tool 11 330 (65) 1 282 572 (3 329) 8 647<br />
Other tangible assets 15 087 1 853 2 923 1 237 919 19 545<br />
Other tangible assets held under<br />
capital leases 3 005 1 057 1 948<br />
Tangible assets under construction 122 33 1 055 (113) 1 097<br />
Total 29 545 1 821 5 260 2 866 (2 523) 31 237<br />
Total gross value of tangible<br />
fixed assets 43 327 (2 376) 5 558 7 498 (2 359) 36 652<br />
Accumulated depreciation and 2000 Mvts/Scope Increase Decrease Other mvts <strong>2001</strong><br />
provisions for tangible K€ K€ K€ K€ K€ K€<br />
Land 7 (7) 0<br />
Constructions 1 036 (701) 227 19 75 617<br />
Constructions held under capital leases 1 881 (1 072) 184 797 197<br />
Total 2 924 (1 780) 410 815 75 813<br />
Installations, material and tool 8 422 104 1 171 1 221 (1 733) 6 744<br />
Other tangible fixed assets 10 549 632 2 252 232 (115) 13 086<br />
Other tang. fixed assets held under capital leases 1 850 391 1 057 1 185<br />
Total 20 821 737 3 815 2 509 (1 848) 21 014<br />
Total accumulated depreciation<br />
of tangible assets 23 745 (1 043) 4 225 3 325 (1 774) 21 828


