Marine Ecosystems Research Department - jamstec japan agency ...
Marine Ecosystems Research Department - jamstec japan agency ...
Marine Ecosystems Research Department - jamstec japan agency ...

Create successful ePaper yourself
Turn your PDF publications into a flip-book with our unique Google optimized e-Paper software.
Japan <strong>Marine</strong> Science and Technology Center<br />
Frontier <strong>Research</strong> System for Extremophiles<br />
ciated with alkaliphily. First of all, we prepared the<br />
DNA chip containing , genes identified in the<br />
B. halodurans C- genome in this study, and then<br />
we analyzed the transcriptome with the mRNAs isolated<br />
from both alkaline and neutrality cultures at the<br />
exponential growth phase. It was observed that a number<br />
of the genes were induced apparently under alkaline<br />
pH conditions. The results for the expression pattern<br />
of some genes were also confirmed by Northern<br />
hybridization analysis. Since most of the alkaliphilic<br />
Bacillus strains require sodium ions for growth, we<br />
also carried out transcriptome analysis with DNA<br />
chips under various concentrations of NaCl.<br />
First, we attempted to make NDA chips. The specific<br />
-mer oligonucleotide sequence for each gene was<br />
designed through BLAST search analysis. The oligonucleotides<br />
designed were spotted in duplicate on the<br />
silane-treated glass slides by a pen type spotting robot.<br />
Bacteria were grown in Horikoshi II medium<br />
(pH. or .) in jar fermentor, and harvested during<br />
the logarithmic growth phase. Total RNAs from alkaline<br />
and neutral culture were isolated and purified. It<br />
was quantified by measuring absorbance at nm.<br />
The purity of RNA was confirmed by an agarose gel<br />
electrophoresis. The mRNAs were converted to<br />
cDNAs by coincident labeling with Cy-dUTP or<br />
Cy-dUTP. Random hexamer (MDI Inc., Tokyo) was<br />
used for the labeling reaction. The hybridization for<br />
each sample was duplicated with the probes labeled by<br />
reversal fluor. The hybridization was carried out at<br />
˚C for hours with the hybridization buffer. After<br />
washing and drying, array images were scanned using<br />
GenPix A laser microarray scanner (Axon, Inc).<br />
The analysis of the density of each spot and calculation<br />
of the expression ratio for each spot were performed<br />
using the analysis software. Calculation of the<br />
expression ratio between experiments allowed pairwise<br />
comparisons of the relative transcript levels for<br />
each gene under the two growth conditions. Thus, the<br />
changes observed in the DNA chips were not substantially<br />
influenced by the difference in bacteria densities.<br />
Only those genes whose expression levels differed<br />
by a ratio of at least . were evaluated.<br />
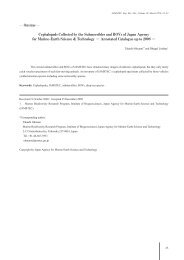
As shown in Fig. and Table , genes were sig-<br />
DNA Microarry Images<br />
pH7:pH9.5=Cy3:Cy5<br />
Sample 1<br />
pH7:pH9.5=Cy5:Cy3<br />
Sample 2<br />
Fig.2 Gene expression analysis using DNA microarray. RNA from alkaline and neutral cultures<br />
are compared. To ensure consistency, the two samples are labeled with different<br />
fluors. In sample 1, a red fluor for the mRNA from alkaline and a green fluor for the<br />
mRNA from the neutral cultures. In sample 2, we labeled RNA awaps. The colour was<br />
showed log 10<br />
(expression ratio) as: (1) red when the red-labeled RNA is upregulated relative<br />
to the green-labeled RNA; (2) green when the red-labeled RNA is downregulated<br />
relative to the green-labeled RNA; (3) Yellow when the red-labeled RNA is regulated as<br />
equal levels as the green-labeled RNA; (4) black when the log 10<br />
(expression ratio) is<br />
close to zero.<br />
71