Marine Ecosystems Research Department - jamstec japan agency ...
Marine Ecosystems Research Department - jamstec japan agency ...
Marine Ecosystems Research Department - jamstec japan agency ...

Create successful ePaper yourself
Turn your PDF publications into a flip-book with our unique Google optimized e-Paper software.
Japan <strong>Marine</strong> Science and Technology Center<br />
Ocean Observation and <strong>Research</strong> <strong>Department</strong><br />
0<br />
ExcessCO2 [UMOL/KG]<br />
70<br />
DEPTH [M]<br />
DEPTH [M]<br />
500<br />
1000<br />
1500<br />
0<br />
500<br />
1000<br />
1500<br />
20N 25N 30N 35N 40N<br />
CFC-11 [PMOL/KG]<br />
20N 25N 30N 35N 40N<br />
Ocean Data View Ocean Data View<br />
60<br />
50<br />
40<br />
30<br />
20<br />
10<br />
0<br />
4<br />
3<br />
2<br />
1<br />
0<br />
50N<br />
30N<br />
Ocean Data View<br />
10N<br />
130E 150E 170E<br />
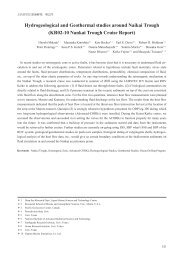
Fig.15 Distribution of the anthropogenic CO 2 and CFC-11 along 155E in 2003.<br />
CFC- along E line.<br />
(b) We measured nutrients and dissolved oxygen gas<br />
concentrations in seawater during the JARE<br />
Antarctic voyage abroad the R/V Tangaroa in<br />
February . Samples for measurement of some<br />
biogenic dissolved gases in seawater were also collected.<br />
Methane concentrations and stable carbon isotopes<br />
collected during the JARE Antarctic voyage in <br />
were also analyzed.<br />
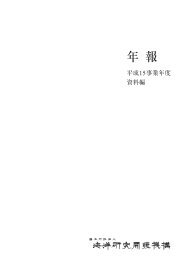
Distributions of dissolved methane, silicate and<br />
dimethyl sulfide (DMS) concentrations along E<br />
in are shown Fig.-, - and -, respectively.<br />
High concentrations of methane were found on<br />
the continental slope. This distribution is similar to<br />
that of silicate. The water mass with high methane<br />
concentration might be related to surface or shelf<br />
water. The stable carbon isotope ratio of methane suggests<br />
that the methane was not decomposed yet.<br />
Higher DMS concentrations were found around<br />
S in February , which were observed also in<br />
the R/V Hakuho-Maru cruise conducted in January.<br />
However, ratios between DMS, dissolved DMSP and<br />
DIMSP were not same between the cruises. Changes<br />
of the ratios are important to make clear the role of<br />
phyto- and zooplankton for the formation of DMS in<br />
surface seawater.<br />
16-1<br />
Depth [m]<br />
0<br />
1000<br />
2000<br />
3000<br />
4000<br />
16-2 0<br />
Depth [m]<br />
16-3 0<br />
Depth [m]<br />
1000<br />
2000<br />
3000<br />
4000<br />
50<br />
100<br />
150<br />
200<br />
CH4 [nmol/kg]<br />
64˚S 62˚S 60˚S 58˚S 56˚S 54˚S<br />
Si [µmol/kg]<br />
66˚S 64˚S 62˚S 60˚S 58˚S 56˚S 54˚S<br />
DMS [nmol/1]<br />
66˚S 64˚S 62˚S 60˚S 58˚S 56˚S<br />
Fig.16 Antarctic Sea during JARE43 observation in 2002.<br />
16-1 Distribution of Methane along 140E.<br />
16-2 Distribution of SiO 2 along 140E.<br />
16-3 Distribution of DMS along 140E.<br />
Ocean Data View<br />
Ocean Data View<br />
Ocean Data View<br />
4.5<br />
4<br />
3.5<br />
3<br />
2.5<br />
2<br />
1.5<br />
1<br />
150<br />
125<br />
100<br />
75<br />
50<br />
25<br />
0<br />
15<br />
12.5<br />
10<br />
7.5<br />
5<br />
2.5<br />
0<br />
43